Abstract
The development of a low-cost, simple colorimetric sensor array capable of detection and identification of toxic gases is reported. This technology uses a disposable printed array of porous pigments in which metalloporphyrins and chemically responsive dyes are immobilized in a porous matrix of organically modified siloxanes (ormosils) and printed on a porous membrane. The printing of the ormosil into the membrane is highly uniform and does not lessen the porosity of the membrane, as shown by scanning electron microscopy. When exposed to an analyte, these pigments undergo reactions that result in well-defined color changes due to strong chemical interactions: ligation to metal ions, Lewis or Bronsted acid-base interactions, hydrogen bonding, etc. Striking visual identification of 3 toxic gases has been shown at the IDLH (immediately dangerous to life and health), at the PEL (permissible exposure level), and at a level well below the PEL. Identification and quantification of analytes were achieved using the color change profiles, which were readily distinguishable in a hierarchical clustering analysis (HCA) dendrogram, with no misclassifications in 50 trials.
Introduction
Sensing technology for toxic gases is important for both security and environmental monitoring.1 Array based sensing technology has emerged as a powerful new approach toward the detection of chemically diverse analytes. Based on cross-responsive sensor elements, array based sensing systems mimic the mammalian gustatory and olfactory systems by producing specificity, not from any single sensor, but as a unique composite response for each analyte.2-7 Previous electronic nose technology, however, do not use disposable arrays and therefore generally must employ weak chemical interactions (e.g., physical adsorption or absorption) to avoid irreversible poisoning; such approaches have included the use of conductive polymers and polymer composites,8 polymers doped with fluorescent reporters,9 electrochemical oxidation on metal oxide,10, 11 and polymer-coated surface acoustic wave (SAW) devices.12 We have developed a rather different, but quite simple, optoelectronic approach using a colorimetric sensor array of chemically-responsive dyes for the detection of a wide range of analytes both in gas phase and in aqueous solutions.13-20 The colors of the dyes are affected by a wide range of analyte-dye interactions (e.g., pH, Lewis acid-base, dipolar, π-π, etc.), and the arrays are made by simply printing non-aqueous solutions of hydrophobic dyes on a hydrophobic membrane. In recent related work, we reported a new liquid sensing array methodology based on the use of printed arrays of porous, insoluble pigments created by the immobilization of pH indicators in organically modified siloxanes (ormosils); the use of these porous pigments improves the shelf-life of the sensor array and prevents colorant leaching problems in aqueous media.21, 22 Here, we report an extension of this work for colorimetric detection of toxic gases by the use of porous pigments made by incorporation of metalloporphyrins and solvatochromic indicators in sol-gel matrices.
The design of the colorimetric sensor array is based on two fundamental requirements: (1) the chemically responsive pigment must contain a center to interact strongly with analytes, and (2) this interaction center must be strongly coupled to an intense chromophore. The first requirement implies that the interaction must not be simple physical adsorption, but rather must involve other, stronger chemical interactions, i.e., bond formation, acid-base reactions, or strong dipolar communication. The consequent dye classes from these requirements include (1) Lewis acid/base dyes (i . e . , metal ion containing dyes, metalated tetraphenylporphyrins), (2) Bronsted acidic or basic dyes (i.e., pH indicators), and (3) dyes with large permanent dipoles (i.e., zwitterionic solvatochromic dyes23). Metalloporphyrins are a natural choice for the detection of metal-ligating vapors because of their strong binding of nearly all metal ions, their open coordination sites for strong axial ligation to the metal ions, their excellent chemical and thermal stability, their large spectral shifts upon ligand binding, and their intense coloration.
The conversion of soluble dyes into porous pigments by immobilizing organic molecules in ormosils 24-29 offers advantages of improved durability and stability. Many researchers have reported that immobilized compounds can retain their chemical activity for long periods.30 Among various host materials, ormosils have come in favor due to their chemical and mechanical stability. Furthermore, the final properties of the porous pigments (e.g., hydrophobicity, porosity, and surface area) can be easily modified by controlling the physical and chemical parameters of the sol-gel process. While monoliths, films, and fibers of individual porous pigments are known,30, 31 we report here a new method of printing arrays of chemically-responsive porous pigments directly onto inert fluoropolymer (polyvinylidene diflouride, PVDF) membranes. The macroporosity of the membrane enhances mass transport of the analyte to the internal sections where porous pigments can react with the analyte.
Experimental
Array preparation and characterization
Toxic gases (ammonia, chlorine, and sulfur dioxide) were purchased from Matheson Tri-Gas Corp. through S. J. Smith, Co. (Urbana, IL) as certified pre-mixed gas tanks and were used as received. Polyvinylidene difluoride (PVDF, [CH2CF2]n) membrane (thickness: 165μm; pore size: 0.45μm) was obtained from VWR Scientific (Batavia, IL). All chemicals used were of analytical-reagent grade and employed without further purification. For characterization of the printed PVDF membrane, scanning electron microscopy (SEM) was carried out on a JEOL JSM-7000F.
Formulations of phenethyltrimethoxysilane with metalloporphyrins or mixtures of methyltriethoxysilane, triethoxy(octyl)silane with pH or solvatochromic indicators were used (Supporting Information). The resulting solution was stirred overnight at room temperature, and the selected chemically responsive dyes were then added. For some of the sol-gel-colorant solutions, pH was adjusted with 1.0 M sodium hydroxide solution to keep the pH indicator in the base form. Final formulations were loaded into a 36-hole Teflon ink well. Sensor arrays were printed using an array of 36 floating slotted pins (which delivered approximately 130 nL each) by dipping into the ink well and transferring to the PVDF membrane. From this volume, we estimate that the silica matrix occupies less than 3% of the total membrane volume. Once printed, the arrays were aged under nitrogen for at least 3 days before any sensing experiments were performed.
Experimental procedure
The toxic gases at various concentrations were prepared by mixing the analyte with dry and wet nitrogen gas with MKS digital mass flow controllers (MFCs) to achieve the desired concentrations and relative humidity (RH), as shown in Figure 1. For all sensing experiments, imaging of the arrays was done on an ordinary flatbed scanner (Epson Perfection V200). The “before” image was taken under wet nitrogen (33% RH), and the “after” image was acquired after 2 minutes of exposure to a flow of the toxic gas. The experiments were run in quintuplicate for each of three analytes at the immediately dangerous to life or health (IDLH) concentration, at the permissible exposure limit (PEL), and at a concentration well below the PEL. Changes in the RGB values of each pigment spot were obtained from a difference map by subtracting the before image from the after image. To eliminate the possibility of subtraction artifacts caused by acquisitions near the spot edge, only the spot center is included in the calculation. Measurements can be performed using Photoshop™ or with a customized software package, ChemEye™ (ChemSensing, Inc., Champaign, IL).
Fig. 1.
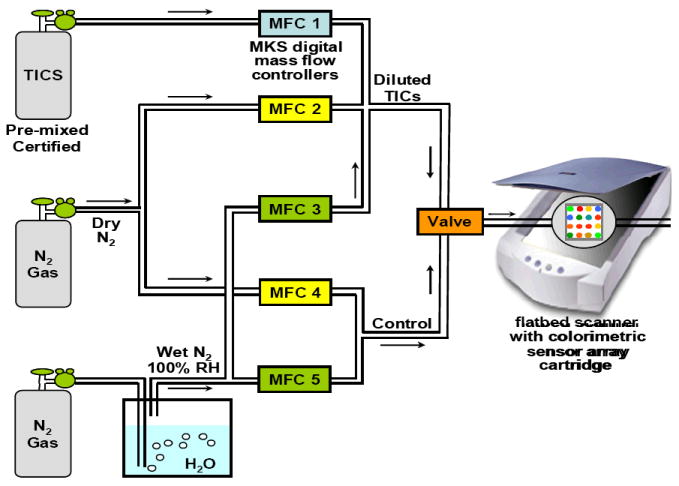
Experimental setup for the gas mixing of TICs and digital imaging of arrays
Results and discussion
Formulations and characterization
Two different formulations were developed to immobilize porphyrins and non-porphyrin indicators. We examined several commonly used silicon alkoxides, including phenethyltrimethoxysilane, triethoxy(octyl)silane and methyltriethoxysilane, as the network forming precursors to manipulate the porosity and polarity of the resulting matrices. For porphyrins, phenethyltrimethoxysilane was quite effective in immobilizing the porphyrins without causing its crystallization. For non-porphyrin indicators, the porous pigments were obtained using the mixture of triethoxy(octyl)silane and methyltriethoxysilane. Use of hydrophobic triethoxy(octyl)silane was essential to ensure the porosity necessary for rapid color changes. When the pigments were prepared using only methyltriethoxysilane, the pigments showed very slow color change to either acidic or basic gases. As the concentration of triethoxy(octyl)silane increased, the response time became increasingly more rapid; however, printing yielded non-uniform spot. In our study, a porous pigment prepared from 1:1 molar ratio of triethoxy(octyl)silane and methyltriethoxysilane was found to be optimal in terms of response time and printability.
To confirm that our formulations did not clog the pores or damage the PVDF morphology upon printing, SEM images of printed and non-printed areas of the membrane were taken. Figure 2a and 2b show unprinted and printed areas of the PVDF surface, respectively; it is clearly seen that printing did not alter the porosity of the membrane in any way, confirming that the sol-gel deposition did not fill the pores of the PVDF. Furthermore, our printing formulations did not damage or dissolve the PVDF membrane and the microstructure of the membrane was completely unaffected. Importantly, no large silica clusters were observed in the membrane, which is critical to maintenance of the polymer macroporosity necessary for gas mass transport of an analyte to the internal sections of the membrane; the SEM of the cross-section of the polymer (Figure 2c) shows that this is true for the entire depth of the polymer. In addition, if large silica clusters had been formed, response time due to analyte diffusion through such pigment clusters may have proved problematic.
Fig. 2.

SEM micrographs of (a) surface of non-printed PVDF membrane, (b) surface of printed PDVF membrane, and (c) cross-section of printed PDVF membrane.
To further investigate the dispersion of the porous pigments in the membrane, X-ray energy-dispersive spectroscopy (EDS) elemental mapping analysis was carried out both on the top surface and on a cross-section of pigment spots printed on the membrane, as shown in Figure 3. Contrast is created in these images through the relatively high Z of silica compared to the fluorocarbon. The maps of Si Kα signals show that the silica has been evenly dispersed across and throughout the entire volume of the spot, consistent with the observed uniform color over the spot (Figure 4).
Fig. 3.
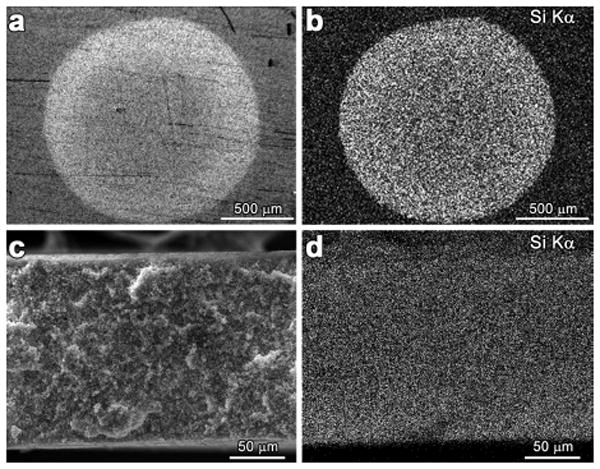
SEM micrographs PVDF printed with a 1.5 mm spot of sol-gel porous pigment: (a) top surface and (b) EDS elemental mapping (Si Kα) of top surface; (c) cross-section and (d) EDS elemental mapping (Si Kα) of cross-section.
Fig. 4.
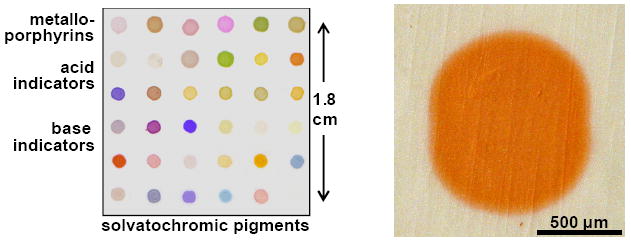
Optical images of the colorimetric sensor array of porous pigments. Left, scanned image from a flat bed scanner; right, microscopic image of a single pigment spot.
Array sensitivities and response times
Most prior electronic nose technologies have permanent sensor arrays; as such, the sensors therefore must employ absorption) to avoid irreversible poisoning from exposure to the outside environment. In contrast, our sensing strategy relies on strong interactions and uses a disposable array to overcome the problem of eventual poisoning. Metal-ligand (i.e., metal-analyte) bonds range in their bond enthalpies from ~40 to ~200 kJ/mol, whereas the enthalpy of physical adsorption is only ~5 to 20 kJ/mol. Therefore, the equilibria coefficients for ligation and strong acid-base interactions are intrinsically many thousand-fold larger than those for adsorption onto surfaces or absorption into polymers for most analytes containing any significant functionality or reactivity. Differences in the sensitivity of detection techniques, of course, can either enhance or diminish this intrinsic advantage of ligation over adsorption.
As a confirmation of this enthalpy analysis, we have tested our porous pigments array against three different toxic gases: ammonia, sulfur dioxide and chlorine. These analytes can be immediately identified in less than a minute (i.e., more than 90% of total response occurs in less than 1 min). A database was assembled from quintuplicate runs of the analytes at IDLH, PEL, and below PEL concentrations after 2 minutes of exposure to ensure full exposure. The color difference maps provide digital data (36 changes in red, green and blue values with a possible range from -255 to +255) and were compiled into a library of 108-dimensional vectors. As shown in Figure 5, the color difference maps are unique to each gas at each concentration, and highly reproducible patterns were obtained for all of the gas concentrations examined in this study. From the S/N ratio of the total Euclidean distances of the 108-dimensional vectors that we observe at the lowest concentrations (which are themselves well below the PEL), we estimate that our limits of detection is well below 100 ppb for each of these analytes.
Fig. 5.
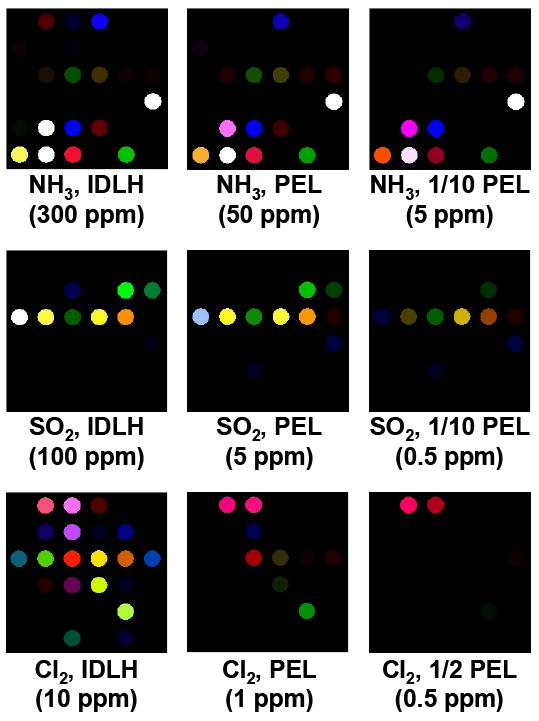
Color difference maps (averages of five trials each) of three toxic gases at different concentrations after 2 min of exposure. For purposes of visualization, the color range of these difference maps are expanded from 4 to 8 bits per color (RGB range of 4-19 expanded to 0-255). From the S/N ratio of the total Euclidean distances of these difference maps at the lowest concentrations tested, the estimated limits of detection are well below 100 ppb for each of these analytes.
The response of our colorimetric arrays are not affected by changes in humidity.20 Because the substrate membrane (PVDF) and the ormosil pigment are both hydrophobic, the array does not respond to changes in relative humidity over the range of 10% to 90% RH. Changes in temperature do lead to relatively small differences in array response, but the overall patterns are not altered signficantly. As expected from entropic considerations, lower temperatures (e.g., 0°C) increase the response of the array to any specific analyte, but no confusion among analytes are observed. For operational applications outside of normal room temperature, one could easily incorporate analyte responses over the expected range of temperatures into the database library.
Statistical and chemometric analyses
The digital database was analyzed by principal component analysis (PCA), which provides a quantitative evaluation of the analytical dispersion of the sensor based on its number of independent dimensions of variance in the data from analyte to analyte.32-35 Our colorimetric sensor arrays have a high dimensionality even for just three different analytes, with 6 dimensions necessary to capture 90% of the total variance and 10 dimensions for 95%. This is an extraordinary observation in contrast to other electronic nose technologies, which have usually only 2 or perhaps 3 dimensions for >95% of total variance.
The high dimensionality of the colorimetric sensor array data requires a classification algorithm that uses the full dimensionality of the data. The simplest approach (and one that assumes no statistical model) is hierarchical cluster analysis (HCA).32-35 The HCA was performed using the minimum variance (“Ward’s”) method. A response dendrogram based on clustering of our array response data in the 108-dimensional ΔRΔGΔB color space (i.e., 36 porous pigment array) was generated as shown in Figure 6. Remarkably, all analytes were accurately identified against one another and against each concentration of each analyte with no errors or misclassifications out of 50 cases. It is the high dimensionality inherent to our colorimetric sensor array that permits us to so easily discriminate among these analytes at different concentrations.
Fig. 6.
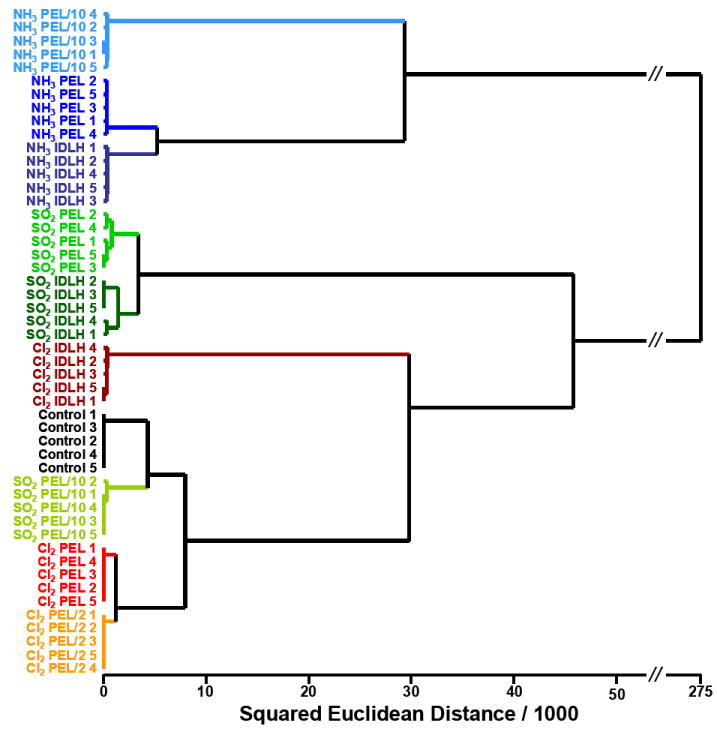
Hierarchical cluster analysis for three toxic gases at three different concentrations and one control. All experiments were run in quintuplicate; no confusions or errors in classification were observed in 50 trials, as shown. After the analyte name, the trial number is given.
The greatest limitation of any electronic nose technology, of course, is that it does not give a component-by-component analysis of mixtures. We have previously shown that colorimetric sensor arrays can distinguish among complex mixtures,13, 15 essentially as a fingerprinting of such mixtures. For binary mixtures, it is certainly feasible to include various concentrations of each component in a pattern recognition library, but this becomes unwieldy for more complicated systems. In a real world situation where multiple reactive gasses might be present, the array would still respond, but the exact analysis of gasses would not be practical without the introduction of a preliminary separation (e.g., micro-GC or temperature programmed desorption). Further work is underway.
Conclusions
In summary, we have created a simple disposable colorimetric sensor array of porous pigments that is capable of facile identification and quantification of toxic gases. By immobilizing metalloporphyrins and other chemically responsive colorimetric indicators within a porous sol-gel matrix, NH3, SO2, and Cl2 can be easily differentiated from each other without misclassifications at IDLH, at PEL and at well below PEL concentrations. Limits of detection for these gases are estimated to be well below 100 ppb.. Classification analysis reveals that the colorimetric sensor array has an extremely high dimensionality (10 dimensions for 90% of total variance), which holds promise of the ability to discriminate among very large numbers of toxic gases at low concentrations.
Supplementary Material
Acknowledgments
This work was supported through the NIH Genes, Environment and Health Initiative through award 3U01ES016011.
Footnotes
Electronic Supplementary Information (ESI) available: List of the colorants in the sol-gel pigments of the colorimetric sensor array. See DOI: 10.1039/b000000x/
Competing financial interests
K.S.S. discloses his status as a major shareholder of ChemSensing, whose software was used in image analysis of this work, and in iSense, LLC, employer of one of the coauthors (S.H.L).
References
- 1.Byrnes ME, King DA, Tierno PM., Jr . Nuclear, Chemical, and Biological Terrorism—Emergency Response and Public Protection. CRC Press; Boca Raton, FL: 2003. [Google Scholar]
- 2.Gardner JW, Bartlett PN. Electronic Noses: Principles and Applications. Oxford University Press; New York: 1999. [Google Scholar]
- 3.Rock F, Barsan N, Weimar U. Chem Rev. 2008;108:705–725. doi: 10.1021/cr068121q. [DOI] [PubMed] [Google Scholar]
- 4.Lewis NS. Acc Chem Res. 2004;37:663–672. doi: 10.1021/ar030120m. [DOI] [PubMed] [Google Scholar]
- 5.Hierlemann A, Gutierrez-Osuna R. Chem Rev. 2008;108:563–613. doi: 10.1021/cr068116m. [DOI] [PubMed] [Google Scholar]
- 6.Anslyn EV. J Org Chem. 2007;72:687–699. doi: 10.1021/jo0617971. [DOI] [PubMed] [Google Scholar]
- 7.Albert KJ, Lewis NS, Schauer CL, Sotzing GA, Stitzel SE, Vaid TP, Walt DR. Chem Rev. 2000;100:2595–2626. doi: 10.1021/cr980102w. [DOI] [PubMed] [Google Scholar]
- 8.Janata J, Josowicz M. Nat Mater. 2003;2:19–24. doi: 10.1038/nmat768. [DOI] [PubMed] [Google Scholar]
- 9.Wolfbeis OS. J Mater Chem. 2005;15:2657–2669. [Google Scholar]
- 10.Tomchenko AA, Harmer GP, Marquis BT, Allen JW. Sens Actuators, B. 2003;B93:126–134. [Google Scholar]
- 11.Marquis BT, Vetelino JF. Sens Actuators, B. 2001;B77:100–110. [Google Scholar]
- 12.Grate JW. Chem Rev. 2000;100:2627–2647. doi: 10.1021/cr980094j. [DOI] [PubMed] [Google Scholar]
- 13.Zhang C, Suslick KS. J Agric Food Chem. 2007;55:237–242. doi: 10.1021/jf0624695. [DOI] [PubMed] [Google Scholar]
- 14.Zhang C, Suslick KS. J Am Chem Soc. 2005;127:11548–11549. doi: 10.1021/ja052606z. [DOI] [PubMed] [Google Scholar]
- 15.Zhang C, Bailey DP, Suslick KS. J Agric Food Chem. 2006;54:4925–4931. doi: 10.1021/jf060110a. [DOI] [PubMed] [Google Scholar]
- 16.Suslick KS, Bailey DP, Ingison CK, Janzen M, Kosal MA, McNamara WB, III, Rakow NA, Sen A, Weaver JJ, Wilson JB, Zhang C, Nakagaki S. Quimica Nova. 2007;30:677–681. [Google Scholar]
- 17.Suslick KS. MRS Bulletin. 2004;29:720–725. doi: 10.1557/mrs2004.209. [DOI] [PubMed] [Google Scholar]
- 18.Rakow NA, Suslick KS. Nature. 2000;406:710–713. doi: 10.1038/35021028. [DOI] [PubMed] [Google Scholar]
- 19.Rakow NA, Sen A, Janzen MC, Ponder JB, Suslick KS. Angew Chem Int Ed. 2005;44:4528–4532. doi: 10.1002/anie.200500939. [DOI] [PubMed] [Google Scholar]
- 20.Janzen MC, Ponder JB, Bailey DP, Ingison CK, Suslick KS. Anal Chem. 2006;78:3591–3600. doi: 10.1021/ac052111s. [DOI] [PubMed] [Google Scholar]
- 21.Lim SH, Musto CJ, Park E, Zhong W, Suslick KS. Org Lett. 2008;10:4405. doi: 10.1021/ol801459k. [DOI] [PMC free article] [PubMed] [Google Scholar]
- 22.Musto CJ, Lim SH, Suslick KS. Anal Chem. 2009;81:6526. doi: 10.1021/ac901019g. [DOI] [PMC free article] [PubMed] [Google Scholar]
- 23.Reichardt C. Chem Rev. 1994;94:2319–2358. [Google Scholar]
- 24.Rottman C, Grader G, De Hazan Y, Melchior S, Avnir D. J Am Chem Soc. 1999;121:8533–8543. [Google Scholar]
- 25.Makote R, Collinson MM. Analytica Chimica Acta. 1999;394:195–200. [Google Scholar]
- 26.Kowada Y, Ozeki T, Minami T. J Sol-Gel Sci Tech. 2005;33:175–185. [Google Scholar]
- 27.Itagaki Y, Deki K, Nakashima S-I, Sadaoka Y. Sens Actuators, B. 2006;B117:302–307. [Google Scholar]
- 28.Nakashima S, Deki K, Itagaki Y, Aono H, Sadaoka Y. Chem Sensors. 2005;21:4–6. [Google Scholar]
- 29.Onida B, Fiorilli S, Borello L, Viscardi G, Macquarrie D, Garrone E. J Phys Chem B. 2004;108:16617–16620. [Google Scholar]
- 30.Jeronimo PCA, Araujo AN, Montenegro M. Talanta. 2007;72:13–27. doi: 10.1016/j.talanta.2006.09.029. [DOI] [PubMed] [Google Scholar]
- 31.Podbielska H, Ulatowska-Jarza A, Muller G, Eichler HJ. Sol-Gels for Optical Sensors. In: Baldini F, Chester AN, Homola J, Martellucci S, editors. Optical Chemical Sensors. Springer; Erice, Italy: 2006. [Google Scholar]
- 32.Hasswell S. Practical Guide To Chemometrics. Dekker; New York: 1992. [Google Scholar]
- 33.Scott SM, James D, Ali Z. Microchim Acta. 2007;156:183–207. [Google Scholar]
- 34.Johnson RA, Wichern DW. Applied Multivariate Statistical Analysis. 6. Prentice Hall; New Jersey: 2007. [Google Scholar]
- 35.Hair JF, Black B, Babin B, Anderson RE, Tathan RL. Multivariate Data Analysis. 6. Prentice Hall; New Jersey: 2005. [Google Scholar]
Associated Data
This section collects any data citations, data availability statements, or supplementary materials included in this article.


