Abstract
A parallel chiral/achiral LC-MS/MS assay has been developed and validated to measure the plasma and urine concentrations of the enantiomers of ketamine, (R)- and (S)-Ket, in Complex Regional Pain Syndrome (CRPS) patients receiving a 5-day continuous infusion of a sub-anesthetic dose of (R,S)-Ket. The method was also validated for the determination of the enantiomers of the Ket metabolites norketamine, (R)-and (S)-norKet and dehydronorketamine, (R)- and (S)-DHNK, as well as the diastereomeric metabolites hydroxynorketamine, (2S,6S)-/(2R,6R)-HNK and two hydroxyketamines, (2S,6S)-HKet and (2S,6R)-Hket. In this method, (R,S)-Ket, (R,S)-norKet and (R,S)-DHNK and the diastereomeric hydroxyl-metabolites were separated and quantified using a C18 stationary phase and the relative enantiomeric concentrations of (R,S)-Ket, (R,S)-norKet and (R,S)-DHNK were determined using an AGP-CSP. The analysis of the results of microsomal incubations of (R)- and (S)-Ket and a plasma and urine sample from a CRPS patient indicated the presence of 10 additional compounds and glucuronides. The data from the analysis of the patient sample also demonstrated that a series of HNK metabolites were the primary metabolites in plasma and (R)- and (S)-DHNK were the major metabolites found in urine. The results suggest that norKet is the initial, but not the primary, metabolite and that downstream norKet metabolites play a role in (R,S)-Ket-related pain relief in CRPS patients.
1. Introduction
Complex Regional Pain Syndrome (CRPS) is a chronic debilitating disease characterized by significant pain often resulting in severe disability and lost productivity. The current clinical treatment of CRPS produces limited relief and there is a high rate of recurrence. At the present time we are exploring an approach to the treatment of this disease based upon a 5-day continuous infusion of a sub-anesthetic dose of (R,S)-ketamine ((R,S)-Ket). In a recent study, “pilot study”, we demonstrated that this treatment produced significant levels of pain relief in 10/16 CRPS patients, measured as a ≥ 30% reduction in a perceived pain score [1,2].
As part of the “pilot study”, plasma samples were obtained from the participants and analyzed for the concentrations of the enantiomers of (R,S)-Ket, (R)-Ket and (S)-Ket, and its N-demethylated metabolite (R,S)-norketamine, (R)-norKet and (S)-norKet. The data from the plasma analyses and the changes in the perceived pain were used to construct pharmacodynamic models to describe the relationship between the plasma levels of (R,S)-Ket and (R,S)-norKet and reported pain relief. No significant correlations were observed between these variables suggesting that the systemic exposure of a CRPS patient to (R,S)-Ket and (R,S)-norKet does not entirely explain the drug’s analgesic properties [1,2].
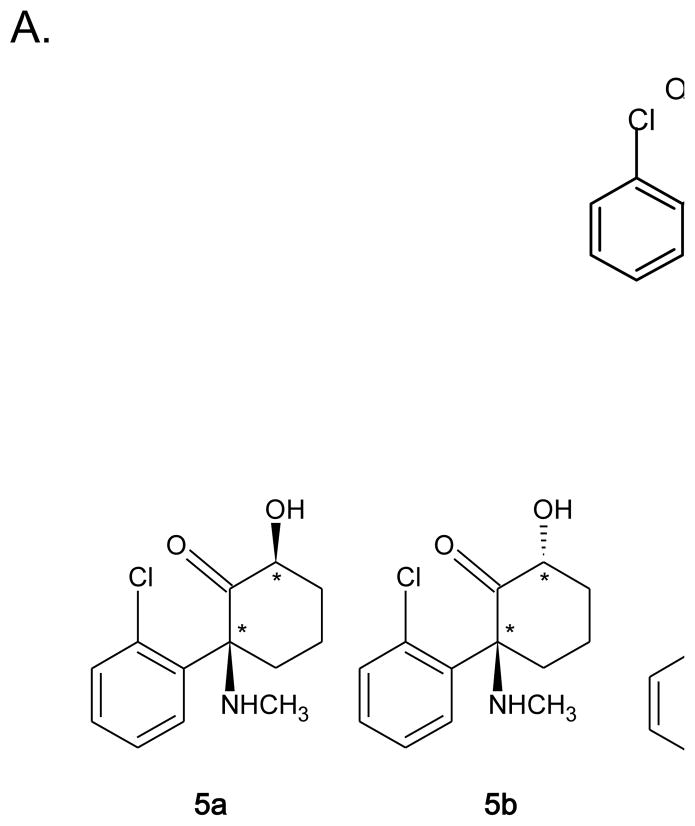
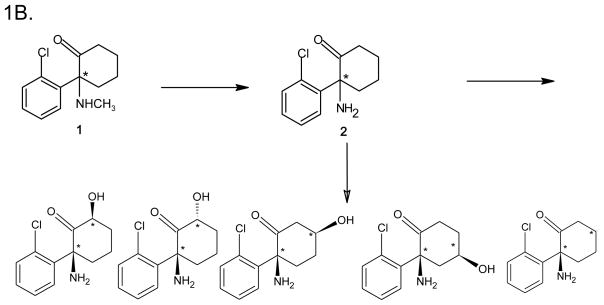
One explanation of the results from the “pilot study” is that the analgesic effect of (R,S)-Ket is due to the parent drug and one or more of its metabolites. (R,S)-Ket is extensively metabolized by microsomal enzymes producing (R,S)-norKet, (R,S)-dehydronorketamine ((R,S)-DHNK), and a series of diastereomeric hydroxynorketamines (HNK) and hydroxyketamines (HKet), Fig. 1A,B [3–5]. In order to determine if downstream metabolites play a role in (R,S)-Ket-related pain relief, we have developed a parallel achiral-chiral LC-MS method for the analysis of (R)-Ket and (S)-Ket and their metabolites in plasma and urine. The goal of the project is to use the analytical method to establish “responder” and “non-responder” metabolic patterns.
Figure 1.
The key metabolic pathways of ketamine (Ket), where: A. The direct conversion of Ket to hydroxy-ketamine (HKet) metabolites; B. The conversion of Ket to norKet to dehydronorketamine (DHNK) and hydroxy-norketamine (HNK) metabolites.
Previously reported enantioselective analytical methods have utilized the α1-acid glycoprotein chiral stationary phase, AGP-CSP, to determine the plasma concentrations of (R)- and (S)-Ket and (R)- and (S)-norKet in surgical patients [6] and volunteers [7,8] and a 3,5-dimethyl carbamoylated cellulose CSP, the OD-CSP, to measure the same compounds in the plasma of volunteers receiving (R,S)-Ket via different routes of administration [9,10]. These studies did not measure the other enantiomeric metabolite, (R,S)-DHNK, or the diastereomeric HNK and HKet metabolites. The enantioselective separations of (R,S)-Ket, (R,S)-norKet and (R,S)-DHNK have also been achieved using capillary electrophoresis with multiple isomer sulfated β-cyclodextrins as the chiral selector [11]. When the CE method was applied to the analysis of the enantioselective pharmacokinetics of (R,S)-Ket in Shetland ponies, (R)-DNHK and (S)-DHNK were identified but not quantified due to the lack of adequate standards and the HNK metabolites were observed but not identified [12–14]. The diastereomeric hydroxylated metabolites of (R,S)-Ket and (R,S)-norKet, Fig. 1, have been previously stereoselectivley separated and identified using achiral GC-MS and the respective chirality at the two asymmetric centers examined using “pseudoracemic” mixtures of (R)- and (S)-D3-Ket [4]. Recently, an achiral LC-MS/MS method was reported for the separation and identification of Ket, norKet, DHNK, HNK and HKet, as well as novel phenolic metabolites and HNK and HKet glucuronides, although the structures and stereochemistries of the hydroxylated metabolites were not definitively established [5]. In addition, this method was not capable of separating the enantiomers of Ket, norKet and DHNK nor was it validated for use in clinical studies.
We now report the development and validation of a parallel LC-MS/MS assay for the plasma and urine concentrations of (R,S)-Ket and 6 of its metabolites, and the identification of 10 additional metabolites and glucuronides. In this method, (R,S)-Ket, (R,S)-norKet and (R,S)-DHNK and the diastereomeric hydroxyl-metabolites and their glucuronides were separated and quantified using a C18 stationary phase and the relative enantiomeric concentrations of (R,S)-Ket, (R,S)-norKet and (R,S)-DHNK were determined using an AGP-CSP. The structure and stereochemistries of the validated metabolites were established through the microsomal metabolism of (R)- and (S)-Ket and the syntheses of the Z- or cis-6-hydroxy-HNK metabolites (2R,6R)-HNK and (2S,6S)-HNK [3,4], the Z- or cis-6-hydroxy-HKet metabolite (2S,6S)-HKet [3,4] and the E- or trans-6-hydroxy-HKet metabolite (2S,6R)-HKet [3,4]. Data from the application of the method to plasma and urine samples obtained from a patient receiving (R,S)-Ket for the treatment of CRPS is also reported.
2. Experimental
2.1. Standards
(R,S)-Ketamine hydrochloride ((R,S)-Ket HCl) and (S)-Ket HCl were purchased from Sigma Aldrich (St. Louis, MO, USA), (R,S)-norketamine hydrochloride (norKet) was purchased from Tocris Bioscience (Ellisville, MO, USA), (R,S)-dehydronorketamine (DHNK) and 3,4,5,6-tetradeuterophenyl-(R,S)-ketamine HCl (D4-(R,S)-Ket) were purchased from Cerillant (Round Rock, TX, USA). (R)-Ket was prepared from (R,S)-Ket using a modified version of the crystallization method described by Hudyma, et al. [15]. In brief, (R,S)-Ket HCl was converted to the free base, treated with 1 equivalent of L-(+)-tartaric acid, recrystallized from acetone/water (91/6), the crystals of (R)-Ket L-tartrate were collected and converted to the free base by treatment with 2.5 M HCl/MeOH. The (2S,6S)- and (2R,6R)-stereoisomers of hydroxynorketamine (HNK) were prepared from (R,S)-norKet by the method of Leung and Baille [16] and the (R,S)-norKet used in this synthesis was prepared using a modification of the method described by Chang Hong and Davisson [17], see Supplemental Material. The (2S,6S)- and (2S,6R)-stereoisomers of hydroxyketamine (HKet) were synthesized and isolated using the method of Woolf, et al. [18].
The structures and purities of the synthesized compounds were determined using 1H NMR spectra recorded on a Varian VMX 300-MHz Nuclear Magnetic Resonance Spectrometer (Varian, Inc., Palo Alto, CA, USA), LC/MS analysis performed using a Thermo Fisher LCQ DUO Mass Spectrometer with a Surveyor HPLC system (Thermo Fisher Scientific, Inc., Waltham, MA, USA), optical rotations obtained using a Rudolph Autopol IV Automatic Polarimeter (Rudolph Research Analytical, Hackettstown, NJ, USA) and the enantiomeric purity was determined using the previously described enantioselective separation on the AGP-CSP [8] using a Waters Alliance HPLC system with 2695 Separations Module and a 2996 Photodiode Array Detector (Waters Corp, Milford, MA, USA). See the Supplementary Material for the data.
2.2. In vitro microsomal metabolism of ketamine and norketamine
Alamethicin, NADPH, acetonitrile and MgCl2 were purchased from Sigma Aldrich and the human liver microsomes were purchased from BD Biosciences (San Jose, CA, USA). The in vitro microsomal metabolism of (R)- and (S)-Ket was carried out using a method modified from Turfus, et al. [5]. Incubations were carried out using a total volume of 500 μl containing 10 or 50 μM (R)- or (S)-Ket, 1 mg/ml human liver microsomes, 2.5 mM NADPH and 5 mM MgCl2 in phosphate buffer [0.1 M, pH 7.4]. All reagents except microsomes were pre-incubated in a 37°C shaking water bath for 5 min and reactions were initiated with the addition of microsomes. The samples were incubated in the shaking water bath (at 37°C) for 2 h and reactions were terminated with the addition of 125 μl of cold acetonitrile. Following a quick vortex mixing and centrifugation, the supernatants were transferred to new tubes and stored at −80°C until analysis.
2.3 In vitro synthesis of the glucuronides of (2S,6S)- and (2R,6R)-hydroxynorketamine
The glucuronides of (2S,6S)- and (2R,6R)-hydroxynorketamine were prepared using the UGT2B4 isoform of UDP-glucuronosyltransferase (0.3 units/mg protein, cat# U3133-1VL), Tris buffer, Triton X-100 and uridine diphosphate glucuronic acid (UDPGA) were obtained from Sigma Aldrich. A 2.5 mg portion of the protein representing 0.75 units of enzymatic activity in 0.5 ml Tris buffer [100 mM, pH 7.5] was quickly thawed from −80 °C to 0 °C by immersion in a 37°C water bath and then a 0 °C water bath. The resulting suspension was added to 4 ml of Tris buffer [100 mM, pH 7.5]) containing 8mM MgCl2, 1 mg/ml Triton X-100, 25 μg/mL alamethicin. The resulting suspension was incubated for 1 h @ 0°C and 10 mg (17 μmol) of UDPGA and 1 mg (4 μmol) of (2S,6S)/(2R,6R)-hydroxynorketamine in 10 μl acetonitrile were added and the resulting mixture incubated at 37°C for 3 days. The reaction was monitored by removing a 100 μl aliquot and quenching it by adding 100 μl of ethanol followed by centrifugation and LC/MS analysis monitoring the signal at m/z 416 (M + H). The reaction was quenched after 72 h with the addition of 4 ml of ethanol followed by centrifugation. The precipitate was washed with ethanol (3 × 5 ml), shaken and centrifuged. The aqueous/ethanolic extracts were combined and evaporated in vacuo. Solid phase extraction was performed with a Waters Sep-Pak C18 1 cc cartridge (Waters Corp.) that had been equilibrated with 1 ml methanol followed by 1 ml Tris buffer [10 mM, pH 7.5] and 1 ml water. The product was eluted using water (3 × 1ml) followed by methanol (2 × 1 ml). The (2S,6S)/(2R,6R)-hydroxynorketamine glucuronide was characterized using the following MRM transitions: 416.0 → 222.0, 416.0 → 240.0, 416.0 → 125.0 and 416.0 → 207.0
2.4 Chromatographic conditions
2.4.1 Instrumentation
The chromatographic experiments were carried out on a Shimadzu Prominence HPLC system (Shimadzu, Columbia, MD, USA). The samples were introduced to the analytical column using Shimadzu SIL-20A autosampler and maintained at 4°C in the autosampler tray, and injections of 10 μl were made with a column temperature kept at 30°C
2.4.2 Achiral separation of Ket and its metabolites
The separations of Ket, norKet, DHNK, HNK, HKet and the glucuronides of HNK were accomplished using an Eclipse XDB-C18 guard column (4.6 mm × 12.5 mm) and an analytical column Varian Pursuit XRs 5 C18 (250× 4.0 mm ID, 5 μm) purchased from Varian, Inc. The mobile phase consisted of ammonium acetate [5 mM, pH 7.6] as Component A and acetonitrile as component B. A linear gradient was run as follows: 0 min 20% B; 5 min 20% B; 15 min 80% B; 20 min 20% B at a flow rate of 0.4 ml/min. The total run time was 30 min per sample.
2.4.3 Enantioselective separation of Ket, norKet and DHNK
The enantioselective separation of (R,S)-Ket, (R,S)-norKet and (R,S)-DHNK was accomplished using a previously described HPLC method [8]. In brief, the separation was carried out using a Chrial-AGP guard column (4.0 × 2.0mm) and an analytical column Chiral-AGP (100× 4.0 mm ID, 5 μm) purchased from Advanced Separation Technologies (Whippany, NJ, USA). The mobile phase consisted of ammonium acetate [10 mM, pH 7.6] as Component A and 2-propanol as Component B. A linear gradient was run as follows: 0 min 6% B; 1 min 20% B; 8 min 8%; 8.1 min 6% at a flow rate of 0.4 ml/min. The total run time was 20 min per sample.
2.4.4 Mass spectrometry conditions
MS/MS analysis was performed using a triple quadrupole mass spectrometer model API 4000 system from Applied Biosystems/MDS Sciex equipped with Turbo Ion Spray® (TIS) (Applied Biosystems, Foster City, CA, USA). The data was acquired and analyzed using Analyst version 1.4.2 (Applied Biosystems). Positive electrospray ionization data were acquired using multiple reaction monitoring (MRM). The TIS instrumental source settings for temperature, curtain gas, ion source gas 1 (nebulizer), ion source gas 2 (turbo ion spray) and ion spray voltage were 550 °C, 20 psi, 70 psi, 10 psi and 5500 V, respectively. The TIS compound parameter settings for declustering potential, entrance potential, and collision cell exit potential were 70 V, 10 V, and 12 V, respectively. The collision energy setting was 40V for Ket, 25V for norKet and DHNK, 30V for HKet, HNK and D4-Ket and 35V for the glucuronide. Ket and its metabolites were identified with collision activated dissociation parameter set up at a pressure setting at 5. The standards were characterized using the MRM ion transitions listed in Table 1.
Table 1.
The multiple reaction monitoring (MRM) ion transitions used to identify the standard compounds used in this study.
| Compound | MRM Transition |
|---|---|
| (R,S)-Ket | 238 → 125 |
| (R,S)-D4-Ket | 242 → 129 |
| (R,S)-norKet | 223 → 125 |
| (R,S)-DHNK | 222 → 177 |
| (2S,6S)-HNK, (2R,6R)-HNK | 240 → 125; 240 → 151; 240 → 177; 240 → 179; 240 → 195 |
| (2S,6S)- and (2S,6R)-HKet | 254 → 125; 254 → 141; 254 → 151; 254 → 163; 254 → 179; 254 → 195 |
2.5 Sample preparation
The extraction of (R,S)-Ket and its metabolites were carried out as previously described [8]. Briefly, the 1 ml solid phase extraction (SPE) cartridges (Oasis HLB, Waters Corp.) were preconditioned with 1 ml of methanol, followed by 1 ml of water and then 1 ml ammonium acetate [10 mM, pH 9.5]. Subsequently, the microsomes, plasma or urine samples were added and washed with 1 ml of water and then the compounds were eluted with 1 ml of methanol, which was transferred to the autosampler vial for analysis.
2.6 Validation of the achiral method-plasma
2.6.1 Stock solution
A concentrated stock solution was prepared containing (R,S)-Ket (1,000 μg/ml), (R,S)-norKet (1,000 μg/ml), (R,S)-DHNK (1,000 μg/ml), (2R,6R)-/(2S,6S)-HNK (100 μg/ml), (2S,6S)-HKet (10 μg/ml) and (2S,6R)-HKet (10 μg/ml). The solution was prepared in ultra-pure water and stored in polypropylene tubes at −20°C. Serial dilutions of the stock solution were used to prepare the samples for the calibration curves and quality control standards (QC).
2.6.2 General procedures
The quantification of (R,S)-Ket, (R,S)-norKet, (R,S)-DHNK, (2R,6R)-/(2S,6S)-HNK, (2S,6S)-HKet and (2S,6R)-HKet was accomplished using area ratios calculated using D4-(R,S)-Ket as the internal standard, where the concentration of the internal standard was set at 500 ng/ml. Quality control standards were prepared daily by adding 50 μl of the corresponding spiking standard solution to 450 μl of drug free plasma or 450 μl of drug free urine purchased from Bioreclamation (East Meadow, NY, USA).
2.6.3 Calibration curves and QC standards
The standards used in the calibration studies as QC standards in the validation of the achiral analysis of (R,S)-Ket, (R,S)-norKet, (R,S)-DHNK, (2R,6R)-/(2S,6S)-HNK, (2S,6S)-HKet and (2S,6R)-HKet in plasma are listed in Table 2. The standards used in the calibration studies as QC standards in the validation of the achiral analysis of (R,S)-Ket, (R,S)-norKet, (R,S)-DHNK, (2R,6R)-/(2S,6S)-HNK, (2S,6S)-HKet and (2S,6R)-HKet in urine are listed in Table 3.
Table 2.
The concentrations of R,S)-Ket, (R,S)-norKet, (R,S)-DHNK, (2R,6R)-/(2S,6S)-HNK, (2S,6S)-HKet and (2S,6R)-HKet in the calibration standards and quality control standards used in the validation of the achiral method in plasma.
| (R,S)-Ket (ng/ml) | (R,S)-norKet (ng/ml) | (R,S)-DHNK (ng/ml) | (2R,6R)-/(2S,6S)-HNK (ng/ml) | (2S,6S)-HKet (ng/ml) | (2S,6R)-HKet (ng/ml) | |
|---|---|---|---|---|---|---|
| Calibration | ||||||
| 1 | 25,000 | 500 | 500 | 2,000 | 40 | 30 |
| 2 | 18,750 | 375 | 375 | 1,500 | 30 | 22.5 |
| 3 | 12,500 | 350 | 350 | 1,000 | 20 | 15 |
| 4 | 6,250 | 125 | 125 | 500 | 10 | 7.5 |
| 5 | 5,000 | 94 | 94 | 375 | 7.5 | 5.6 |
| 6 | 3,125 | 63 | 63 | 250 | 5 | 3.8 |
| QC | ||||||
| High | 21,875 | 437 | 437 | 1,750 | 35 | 26 |
| Medium | 15,625 | 312 | 312 | 1,250 | 25 | 18 |
| Low | 9,375 | 187 | 187 | 750 | 15 | 11 |
Table 3.
The concentrations of R,S)-Ket, (R,S)-norKet, (R,S)-DHNK, (2R,6R)-/(2S,6S)-HNK, (2S,6S)-HKet and (2S,6R)-HKet in the calibration standards and quality control standards used in the validation of the achiral method in plasma.
| (R,S)-Ket (ng/ml) | (R,S)-norKet (ng/ml) | (R,S)-DHNK (ng/ml) | (2R,6R)-/(2S,6S)-HNK (ng/ml) | (2S,6S)-HKet (ng/ml) | (2S,6R)-HKet (ng/ml) | |
|---|---|---|---|---|---|---|
| Calibration | ||||||
| 1 | 25,000 | 750 | 12,500 | 12,500 | 40 | 30 |
| 2 | 18,750 | 562 | 9,375 | 9,375 | 30 | 22.5 |
| 3 | 12,500 | 375 | 6,250 | 6,250 | 20 | 15 |
| 4 | 6,250 | 188 | 3,125 | 3,125 | 10 | 7.5 |
| 5 | 5,000 | 141 | 2,344 | 2,344 | 7.5 | 5.6 |
| 6 | 3,125 | 63 | 1,563 | 1,563 | 5 | 3.8 |
| QC | ||||||
| High | 21,875 | 656 | 10,938 | 10,938 | 35 | 26 |
| Medium | 15,625 | 469 | 7,813 | 7,813 | 25 | 18 |
| Low | 9,375 | 281 | 4,688 | 4,688 | 15 | 11 |
2.7 Application of the analytical method
The validated assay was used to analyze plasma and urine samples obtained from a CRPS patient receiving (R,S)-Ket following a previously described clinical protocol [1,2]. In brief, after approval from the Cooper University Hospital Institutional Review Board, the patient gave written informed consent and was admitted to a monitored telemetry unit. (R,S)-Ket was mixed in a 500 ml bag of normal saline and started at an infusion rate of 10 mg/hr and titrated to a maximum of 40 mg/hr to achieve comfort without evidence of significant side effects or oxygen desaturation (< 92%). The infusion was maintained for 5 days with 24 h monitoring of the subject. Pre-dose and post dose blood and urine samples were obtained as proscribed by the protocol and frozen at −80°C until analysis.
3. Results
3.1 Enantioselective separation of (R,S)-Ket, (R,S)-norKet, (R,S)-DHNK
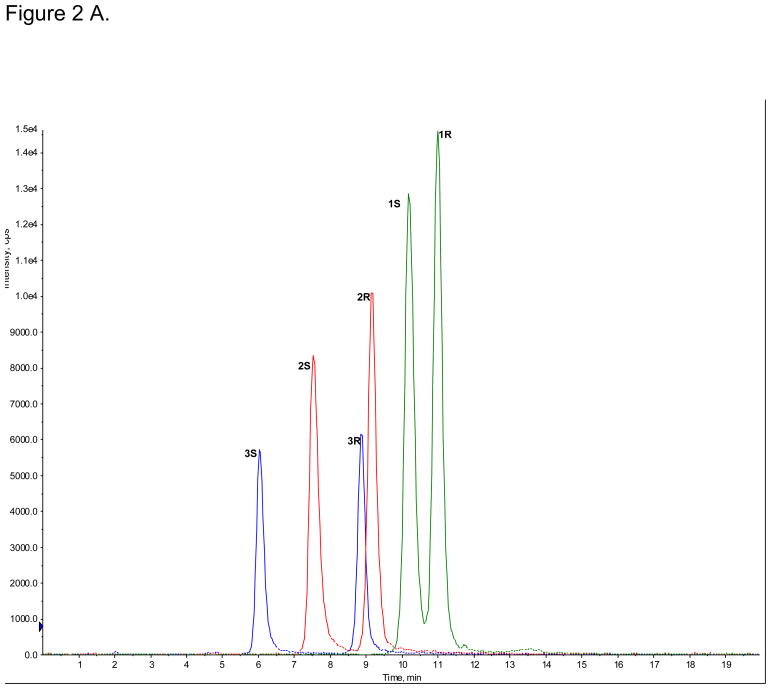
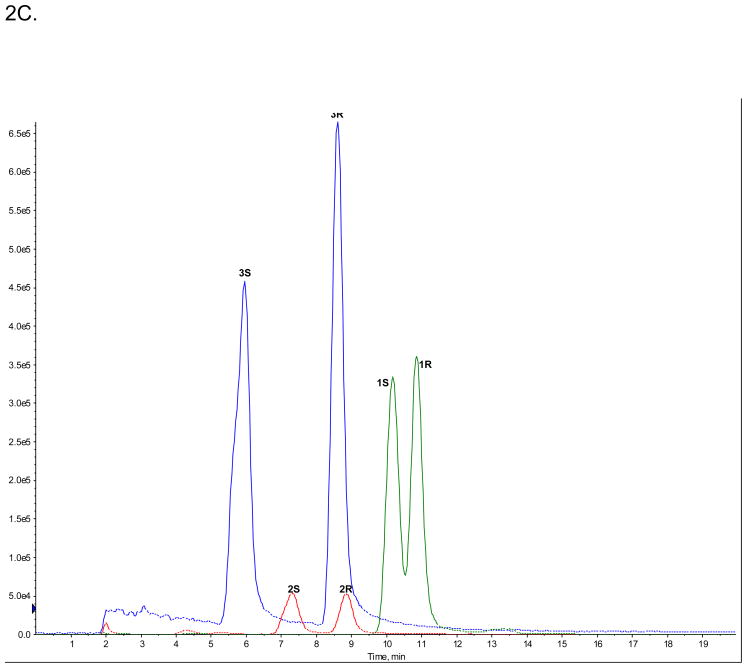
The enantioselective separations of (R,S)-Ket (peak 1R and 1S), (R,S)-norKet (2R and 2S) and (R,S)-DHNK (3R and 3S) were achieved on the AGP-CSP, Fig. 2A, while the diastereomeric HNKs and HKets were not efficiently separated (data not shown). The observed enantioselectivities (αs) were αs(Ket) = 1.07, αs(norKet) = 1.21, αs(DHNK) = 1.46. The enantioselectivites for Ket and norKet were similar to the previously reported αs values, 1.09 and 1.46, respectively, obtained on an AGP-CSP using similar chromatographic conditions [8]. The elution order of 1S before 1R was confirmed using reference standards and the elution orders of 2S before 2R and 3S before 3R were confirmed by the independent metabolism of (R)-Ket and (S)-Ket using human microsomes, see supplemental data, Fig. S1A,1B.
Figure 2.
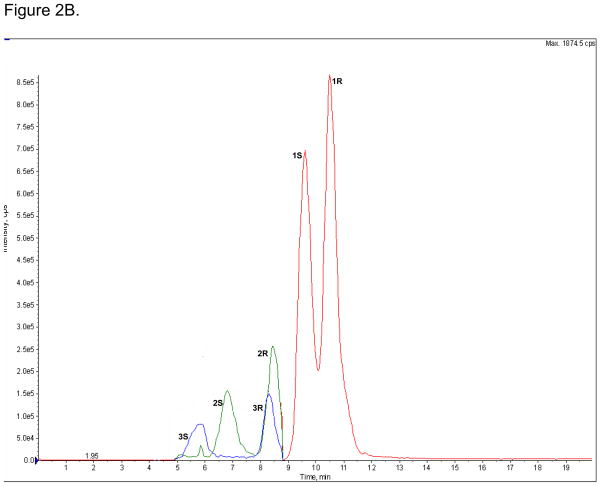
The enantioselective separations of (R,S)-Ket (peak 1R and 1S), (R,S)-norKet (2R and 2S) and (R,S)-DHNK (3R and 3S) on the AGP-CSP, where: A. Standard solutions; B. An extracted plasma sample obtained on Day 3 from a CRPS patient receiving (R,S)-Ket; C. An extracted urine sample obtained on Day 3 from a CRPS patient receiving (R,S)-Ket. See text for experimental details.
The AGP-CSP was used to determine the relative (R)-/(S)-Ket, (R)-/(S)-norKet and (R)-/(S)-DHNK ratios in extracted plasma and urine samples obtained on Day 3 from a CRPS patient receiving (R,S)-Ket, Fig 2B,C. The relative plasma concentrations of (R)-/(S)-Ket and (R)-/(S)-norKet were 1.3 and 1.4, respectively, Fig 2B, which is consistent with data from the previous study where the average (R)-/(S)-Ket and (R)-/(S)-norKet plasma concentrations were 1.1 and 1.2, respectively [1,2]. The relative concentrations reflect the previous reports that there is a significant difference in the plasma clearance of (R)-Ket versus (S)-Ket and that the Cmax and AUC values for (R)-norKet are greater than those of (S)-norKet [1,2,6,7,10]. The relative plasma concentration of (R)-/(S)-DHNK was 1.4, which represents the first report of the relative enantiomeric plasma concentrations of these compounds in humans after the administration of (R,S)-Ket.
The relative enantiomeric urine concentration of (R)-/(S)-norKet was opposite of the plasma ratios, 0.83, while there was a significant reduction in the relative enantiomeric concentrations of (R)-/(S)-Ket and (R)-/(S)-DHNK from 1.3 to 1.0 and 1.4 to 1.1, respectively, Fig. 2C. To our knowledge this represents the first report of the relative enantiomeric concentrations of these compounds in human urine after the administration of (R,S)-Ket.
3.2 Achiral separation of Ket and Ket metabolites
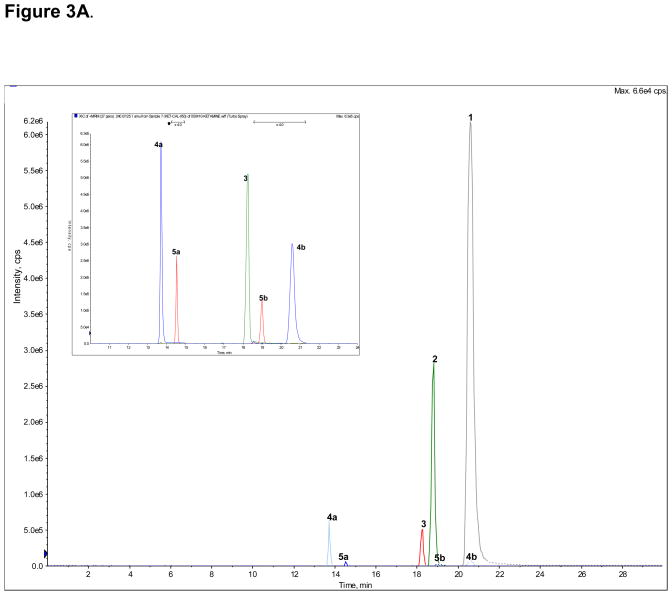
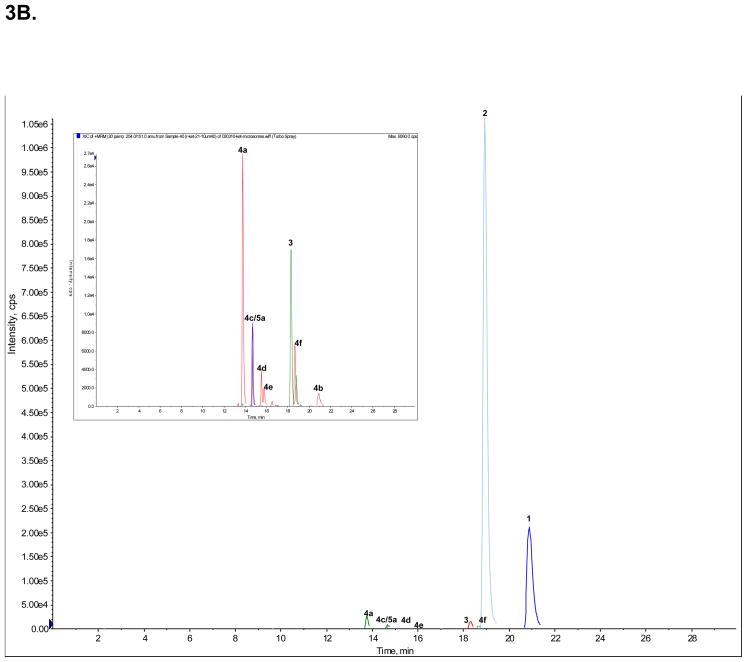
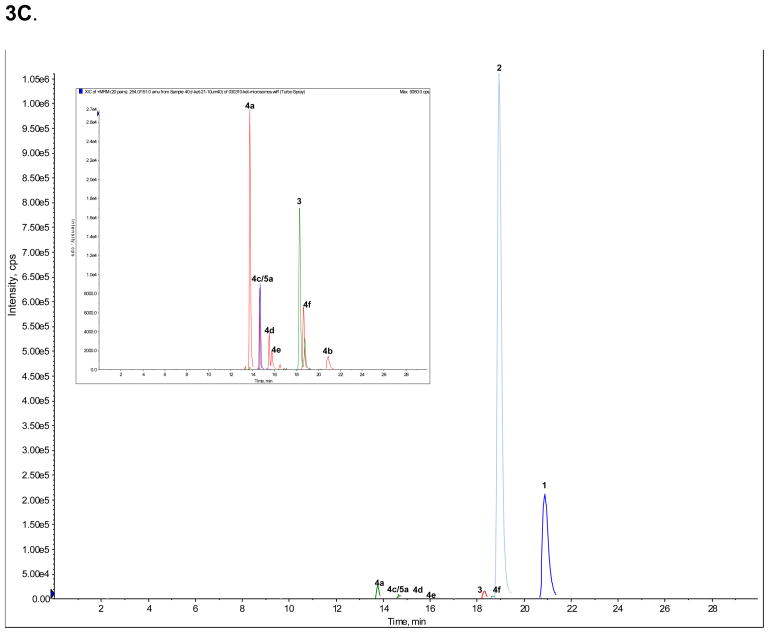
A standard mixture of Ket (peak 1), norKet (2), DHNK (3), (2S,6S;2R,6R)-HNK (4a), (2S,6R;2R,6S)-HNK (4b), (2S,6S)-HKet (5a) and (2S,6R)-HKet (5b) was used to optimize the chromatographic conditions and a representative chromatogram is presented in Fig. 3A. The observed retention times are presented in Table 4 as are the retention factors. The optimized chromatographic conditions were applied to the analysis of samples obtained from the incubation of (R)- and (S)-Ket with human microsomal preparations. Peaks 1, 2, 3, 4a, 4b and 5a were present in both incubates, Fig 3B, 3C.
Figure 3.
The achiral separation of (R,S)-Ket (peak 1), (R,S)-norKet (2), (R,S)-DHNK (3), (2S,6S;2R,6R)-HNK (4a), (2S,6R;2R,6S)-HNK (4b), (2S,6S)-HKet (5a) and (2S,6R)-HKet (5b) on a C18 column, where: A. Standard solution; B. Extracted sample obtained from the incubation of (R)-Ket with human microsomal preparation; C. Extracted sample obtained from the incubation of (S)-Ket with human microsomal preparations. See Table 2 for the assignment of the structures for peaks 4c–f, 5c–d and 6a–e and the text for experimental details.
Table 4.
The observed and relative retentions of ketamine (Ket) and its metabolites achieved using the achiral chromatographic separation developed in this study.
| Compound | Peak | Retention (min) | Retention Factor | MRM Ion Transition |
|---|---|---|---|---|
| (R.S)-Ketamine* | 1 | 20.7 | 3.50 | 238 → 115 |
| (R,S)-Norketamine* | 2 | 18.7 | 3.06 | 224 → 125 |
| (R,S)-Dehydronorketamine* | 3 | 18.2 | 2.96 | 222 → 177 |
| (2S,6S); (2R,6R)-Hydroxynorketamine* | 4a | 13.7 | 1.98 | 240 → 125 |
| (2S,6R); (2R,6S)-Hydroxynorketamine* | 4b | 20.9 | 3.54 | 240 → 125 |
| (2S,5S); (2R,5R)-Hydroxynorketamine | 4c | 14.6 | 2.17 | 240 → 125 |
| (2S,4S); (2R,4R)-Hydroxynorketamine | 4d | 15.5 | 2.37 | 240 → 125 |
| (2S,4R); (2R,4S)-Hydroxynorketamine | 4e | 15.8 | 2.43 | 240 → 125 |
| (2S,5R); (2R,5S)-Hydroxynorketamine | 4f | 18.7 | 3.07 | 240 → 125 |
| (2S,6S); (2R,6R)-Hydroxyketamine* | 5a | 14.5 | 2.15 | 254 → 151 |
| (2S,6R); (2R,6S)-Hydroxyketamine* | 5b | 18.9 | 3.11 | 254 → 151 |
| (2S,5S); (2R,5R)-Hydroxyketamine | 5c | 15.5 | 2.37 | 254 → 151 |
| (2R,5S)-Hydroxyketamine | 5d | 16.9 | 2.67 | 254 → 151 |
| (2S,6S); (2R,6R)-Hydroxynorketamine glucuronide | 6a | 4.9 | 0.07 | 416 → 125 |
| Hydroxynorketamine glucuronide | 6b | 7.4 | 0.61 | 416 → 125 |
| Hydroxynorketamine glucuronide | 6c | 8.3 | 0.80 | 416 → 125 |
| Hydroxynorketamine glucuronide | 6d | 9.9 | 1.15 | 416 → 125 |
| Hydroxynorketamine glucuronide | 6e | 13.5 | 1.93 | 416 → 125 |
| (R,S)-D4-Ketamine* | 7 | 20.5 | 3.46 | 242 → 129 |
The retention time of a compound was identified using standards and microsomal incubates obtained with (R)-Ket and (S)-Ket and the established structures are denoted by *. No attempt was made to establish the stereochemistries of the glucuronide metabolites. The retention factors were determined. The multiple reaction monitoring (MRM) ion transitions presented in the table were used to quantify the compounds in the validation studies and in the application to the analyses of plasma and urine samples from a CRPS patient undergoing treatment with (R,S)-Ket.
The chromatogram obtained from the incubation of (R)-Ket contained 4 additional peaks that displayed the same MRM ion transitions as peaks 4a and 4b, Fig. 3B. Since previous studies demonstrated that norKet is hydroxylated at the C4, C5 and C6 positions on the cyclohexanone ring [6,7], the four unknown compounds were identified as HNK metabolites and labeled as compounds 4c, 4d, 4e and 4f. While the structures of 4c – 4f have not been definitively identified, it is possible to make tentative assignments. These assignments are based on the observation that the Z-isomers of the 6-hydroxy metabolites of norKet (4a) and Ket (5a) elute before the corresponding E-isomers, 4b and 5b and that the regio-selectivity of the hydroxylation of norKet by rat liver microsomes is C6 ≫ C5 ≫ C4 [3,4]. Therefore, compound 4c is listed in Table 4 as (2R,5R)-HNK, 4d as (2R,4R)-HNK, 4e as (2R,4S)-HNK and 4f as (2R,5S)-HNK. The chromatogram obtained from the incubation of (S)-Ket, Fig 3C, contained peaks 4a, 4b, 4c and 4f. Peaks 4c and 4f are identified in Table 4 as (2S,5S)-HNK and (2S,5R)-HNK, respectively. No significant signals were observed for the peaks identified as 4d and 4e.
3.3 Validation of the method
Based upon the data from the “pilot study” [1,2], the initial calibration curves for (R,S)-Ket and (R,S)-norKet were set at 200 – 1,500 ng/ml and 100 – 500 ng/ml, respectively. The plasma and urine samples assayed in this study were then analyzed and the range of the calibration standards were adjusted for the observed (R,S)-Ket and (R,S)-norKet concentrations and selected for (R,S)-DHNK, (2R,6R)-/(2S,6S)-HNK, (2S,6S)-HKet and (2S,6R)-HKet, Tables 2 and 3. The resulting standard calibration curves for spiked human plasma and human urine samples containing all the standards were linear with correlation coefficients (r2) values ranging between 0.997 to 0.999 (plasma) and 0.991 to 0.998 (urine).
The method was then validated for intra-day and inter-day accuracy and reproducibility using the QC samples listed in Tables 2 and 3. The results of these studies indicate that the achiral analytical method is accurate and reproducible within accepted limits, Table 5,6 and can be used to analyze plasma and urine samples obtained from CRPS patients participating in the (R,S)-Ket study.
Table 5.
Results from the validation studies in plasma
| Ket | norKet | DHNK | HNK | HK1 | HK2 | ||
|---|---|---|---|---|---|---|---|
| QC1intra | Mean | 22232.7 | 430.0 | 421.5 | 1794.4 | 33.4 | 31.1 |
| SD | 0.028 | 0.059 | 0.013 | 0.010 | 0.001 | 0.002 | |
| RSD(%) | 3.9 | 2.6 | 3.5 | 2.8 | 4.1 | 2.8 | |
| Accuracy(%) | 101.6 | 98.3 | 98.6 | 102.5 | 87.6 | 95.9 | |
| QC2intra | Mean | 16688.8 | 302.5 | 270.0 | 1273.9 | 24.3 | 19.2 |
| SD | 0.010 | 0.084 | 0.009 | 0.011 | 0.001 | 0.0003 | |
| RSD(%) | 1.8 | 5.2 | 3.7 | 4.8 | 5.5 | 2.2 | |
| Accuracy(%) | 106.8 | 96.8 | 95.3 | 96.9 | 94.6 | 102.5 | |
| QC3intra | Mean | 10273.1 | 185.1 | 168.3 | 736.2 | 15.1 | 11.2 |
| SD | 0.015 | 0.055 | 0.005 | 0.006 | 0.0006 | 0.0003 | |
| RSD(%) | 4.3 | 5.4 | 3.2 | 4.7 | 5.2 | 3.9 | |
| Accuracy(%) | 109.6 | 98.7 | 94.3 | 98.2 | 101.6 | 99.6 | |
| QC1inter | Mean | 22165.1 | 452.8 | 452.2 | 1832.4 | 36.5 | 31.1 |
| SD | 0.018 | 0.061 | 0.023 | 0.010 | 0.002 | 0.0007 | |
| RSD(%) | 2.5 | 2.6 | 5.5 | 2.9 | 5.2 | 2.9 | |
| Accuracy(%) | 101.0 | 102.7 | 103.1 | 103.9 | 109.2 | 115.6 | |
| QC2inter | Mean | 16216.5 | 330.9 | 320.4 | 1285.0 | 26.3 | 19.7 |
| SD | 0.015 | 0.065 | 0.011 | 0.013 | 0.0012 | 0.0006 | |
| RSD(%) | 2.8 | 3.7 | 3.7 | 5.5 | 5.5 | 3.9 | |
| Accuracy(%) | 103.9 | 104.0 | 101.5 | 103.1 | 97.8 | 109.4 | |
| QC3inter | Mean | 9854.9 | 195.6 | 185.9 | 794.6 | 14.5 | 12.0 |
| SD | 0.012 | 0.046 | 0.0051 | 0.0099 | 0.0006 | 0.0004 | |
| RSD(%) | 3.5 | 4.3 | 3.0 | 7.1 | 4.9 | 4.8 | |
| Accuracy(%) | 105.9 | 101.8 | 97.0 | 104.2 | 101.0 | 106.5 |
Table 6.
Results from the validation studies in urine.
| Ket | norKet | DHNK | HNK | HK1 | HK2 | ||
|---|---|---|---|---|---|---|---|
| QC1intra | Mean | 23230.7 | 630.5 | 9406.2 | 8355.3 | 26.3 | 32.7 |
| SD | 0.028 | 0.15 | 0.084 | 0.063 | 0.0011 | 0.00063 | |
| RSD(%) | 2.97 | 6.03 | 3.82 | 3.97 | 6.16 | 3.02 | |
| Accuracy(%) | 100.6 | 94.1 | 90.8 | 76.5 | 103.3 | 121.6 | |
| QC2intra | Mean | 17170.9 | 468.6 | 7043.8 | 5898.0 | 18.8 | 23.7 |
| SD | 0.023 | 0.15 | 0.11 | 0.075 | 0.00044 | 0.00065 | |
| RSD(%) | 3.26 | 4.51 | 2.87 | 6.89 | 4.09 | 4.41 | |
| Accuracy(%) | 106.6 | 100.0 | 95.3 | 88.5 | 107.8 | 127.6 | |
| QC3intra | Mean | 10905.9 | 296.1 | 4394.1 | 3763.4 | 11.3 | 14.9 |
| SD | 0.013 | 0.080 | 0.059 | 0.047 | 0.00026 | 0.00034 | |
| RSD(%) | 2.91 | 2.89 | 1.81 | 7.09 | 4.39 | 4.02 | |
| Accuracy(%) | 109.7 | 101.2 | 98.8 | 88.2 | 102.6 | 128.4 | |
| QC1inter | Mean | 22162.1 | 531.6 | 10035.0 | 8567.2 | 26.3 | 34.6 |
| SD | 0.018 | 0.58 | 0.27 | 0.094 | 0.0032 | 0.0015 | |
| RSD(%) | 1.94 | 5.10 | 4.06 | 5.77 | 5.10 | 6.75 | |
| Accuracy(%) | 104.6 | 109.8 | 86.9 | 78.1 | 93.1 | 113.3 | |
| QC2inter | Mean | 16828.0 | 406.0 | 7584.2 | 6906.4 | 18.8 | 28.7 |
| SD | 0.026 | 0.51 | 0.13 | 0.087 | 0.0028 | 0.0018 | |
| RSD(%) | 3.83 | 3.93 | 3.09 | 6.75 | 3.92 | 9.90 | |
| Accuracy(%) | 106.4 | 111.7 | 89.4 | 77.8 | 87.8 | 114.3 | |
| QC3inter | Mean | 10472.9 | 249.6 | 4764.9 | 4138.9 | 11.3 | 16.0 |
| SD | 0.019 | 0.33 | 0.13 | 0.054 | 0.0013 | 0.00044 | |
| RSD(%) | 4.26 | 2.45 | 1.96 | 7.32 | 2.45 | 4.70 | |
| Accuracy(%) | 111.6 | 115.6 | 92.7 | 82.6 | 88.0 | 116.7 |
3.4 Application of the assay to plasma and urine samples obtained from a CRPS patient receiving (R,S)-Ket
Plasma and urine samples were obtained from a CRPS patient receiving (R,S)-Ket as a continuous infusion over a 5-day period. The samples were obtained on Day 3 of the treatment. This point was chosen based on data from the “pilot study” [1,2] which demonstrated that on Day 3, (R,S)-Ket plasma levels were at steady-state and that significant pain relief was reported by a majority of the CRPS patients. Perceived pain, reported as the pain score, was determined using a visual analog scale, where 0 = no pain and 10 = intolerable pain, and pain relief was assessed by the difference in the perceived pain score reported before the initiation of the (R,S)-Ket infusion (Day 0) and the score on study Days 2 – 5. In this study, the patient reported a pain score of 8 at the initiation of the study and a score of 3 on Day 3 at the time of the plasma sampling, representing a ~ 60% reduction in the perceived pain.
3.4.1. Plasma concentrations of (R,S)-Ket and metabolites
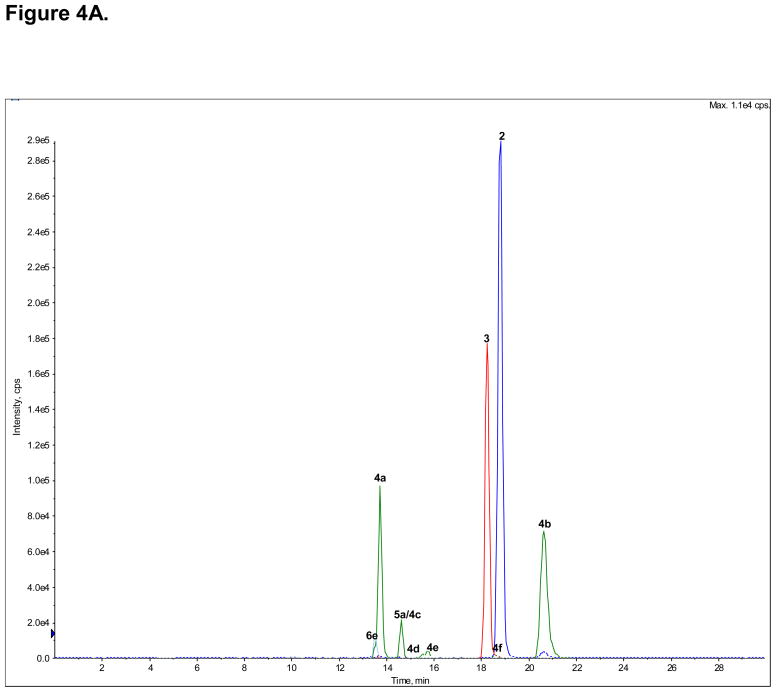
The plasma concentrations of (R,S)-Ket (1), (R,S)-norKet (2), (R,S)-DHNK (3), (2S,6S)-/(2R,6R)-HNK (4a), (2S,6S)-HKet (5a) and (2S,6R)-HKet (5b) at the time of the pain assessment were determined using the validated achiral chromatographic assay, Fig. 4A, Table 7. The chromatogram of the extracted plasma sample contained additional peaks which had been identified as HNKet metabolites (4b–4f) and the plasma concentrations of these compounds were estimated using the standard curve created using (2S,6S)-/(2R,6R)-HNK, Table 7. It should be noted that the plasma concentration of (R,S)-Ket was ~ 40 fold greater than the next highest validated component, (2S,6S)/(2R,6R)-HNKet, Table 7, and, for clarity, the peak corresponding to this compound (1) has been deleted from Fig. 4A. The relative enantiomeric concentrations of (R,S)-Ket, (R,S)-norKet and (R,S)-DHNK assessed using the AGP-CSP, see Fig 2B, were used to calculate the plasma concentrations of the (R)- and (S)-enantiomers, Table 7.
Figure 4.
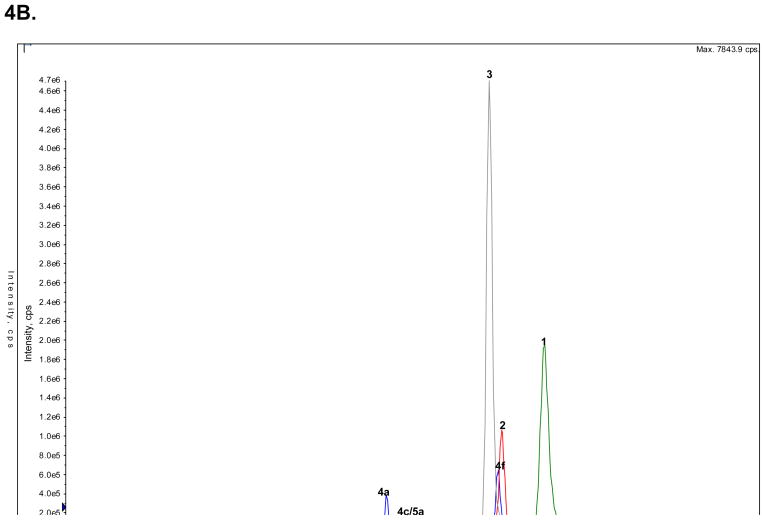
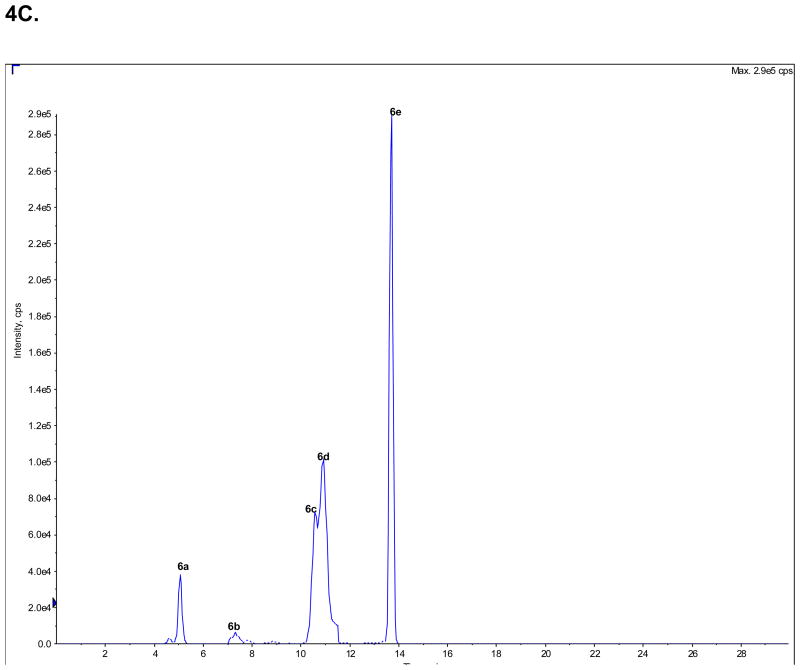
The analysis of the concentrations of (R,S)-Ket and its metabolites in clinical samples obtained from a CRPS patient on Day 3 of a 5-Day infusion of (R,S)-Ket obtained using an achiral chromatographic method, where: A. An extracted plasma sample, in which the peak corresponding to (R,S)-Ket (peak 1) has been deleted from the chromatogram; B. An extracted urine sample in which the peaks corresponding to the glucuronides of the HNKs metabolites (6a–e) have been deleted from the chromatogram; C. An extracted urine sample in which only the peaks corresponding to the glucuronides of the HNKs metabolites (6a–e) are presented. See Table 2 for the assignment of the structures for peaks 4c–f, 5c–d and 6a–e and the text for experimental details.
Table 7.
The calculated plasma and urine concentrations of (R)-Ket and (S)-Ket and their respective metabolites in samples obtained from a CRPS patient receiving (R,S)-Ket (40 mg/h) as a continuous infusion over a 5-day period. The samples were obtained during the morning of Day 3 of the treatment.
| Compound | Peak | Plasma (ng/ml) | Urine (ng/ml) |
|---|---|---|---|
| (S)-Ketamine | 1S | 12,496 | 1,836 |
| (R)-Ketamine | 1R | 16,214 | 1,933 |
| (S)-Norketamine | 2S | 27 | 74 |
| (R)-Norketamine | 2R | 38 | 62 |
| (S)-Dehydronorketamine | 3S | 109 | 7,696 |
| (R)-Dehydronorketamine | 3R | 153 | 8,917 |
| (2S,6S); (2R,6R)-Hydroxynorketamine | 4a | 656 | 1,915 |
| (2S,6R); (2R,6S)-Hydroxynorketamine* | 4b | 881 | 572 |
| (2S,5S); (2R,5R)-Hydroxynorketamine* | 4c | 245 | 940 |
| (2S,4S); (2R,4R)-Hydroxynorketamine* | 4d | 145 | 475 |
| (2S,4R); (2R,4S)-Hydroxynorketamine* | 4e | 160 | 515 |
| (2S,5R); (2R,5S)-Hydroxynorketamine* | 4f | 141 | 4,099 |
| (2S,6S); (2R,6R)-Hydroxyketamine | 5a | 4 | 13 |
| (2S,6R); (2R,6S)-Hydroxyketamine | 5b | ND | 3 |
| (2S,5S); (2R,5R)-Hydroxyketamine# | 5c | ND | 4 |
| (2R,5S)-Hydroxyketamine# | 5d | ND | 5 |
Where: the concentrations estimated using the standard curve for (2S,6S); (2R,6R)-hydroxynorketamine are denoted by *, the concentrations estimated using the standard curve for (2S,6S)-hydroxyketamine are denoted by # and the compounds that were not detected are denoted by N.D.
The analysis of the plasma sample indicated that the major circulating metabolites were the 6-hydroxylated norKet metabolites, (2S,6S)/(2R,6R)-HNK (4a) and (2S,6R)/(2R,6S)-HNK (4b), with concentrations of > 600 ng/ml and > 800 ng/ml, respectively. Significant plasma concentrations, ≥ 100 ng/ml, of the other HNK metabolites (4c–4f) and (R,S)-DHNK (3) were observed, while the concentration of (R,S)-norKet (2) was only ~ 60 ng/ml. This was unexpected since (R,S)-norKet has been assumed to be the primary circulating compound after the administration of (R,S)-Ket and is the only metabolite that is routinely measured in clinical studies. Only a minor concentration, < 5 ng/ml, of (2S,6S)-HKet (5a) was detected in the sample. The low concentrations of (2S,6S)-HKet and the absence of any other HKet metabolites may be due to the rapid N-demethylation of these metabolites to the corresponding HNK metabolites, which has been observed in in vitro microsomal studies [20].
3.4.2. Urine concentrations of (R,S)-Ket and metabolites
The urine concentrations of (R,S)-Ket (1), (R,S)-norKet (2), (R,S)-DHNK (3), (2S,6S)-/(2R,6R)-HNK (4a), (2S,6S)-HKet (5a) and (2S,6R)-HKet (5b) were determined in the morning urine of Day 3 of the (R,S)-Ket infusion using the validated achiral chromatographic assay, Fig. 4B, Table 7. The chromatogram of the extracted urine sample contained additional peaks which had been identified as HNKet metabolites (4b–4f) and the urine concentrations of these compounds were estimated using the standard curve created using (2S,6S)-/(2R,6R)-HNK, Table 7. The relative enantiomeric concentrations of (R,S)-Ket, (R,S)-norKet and (R,S)-DHNK assessed using the AGP-CSP, see Fig 2C, were used to calculate the urine concentrations of the (R)- and (S)-enantiomers, Table 7.
The analysis of the urine sample indicated that the major excreted metabolites were (R)- and (S)-DHNK (3), with an (R)-/(S)-ratio of 1.2. The concentration of (R,S)-DHNK was more than 100-fold higher than the concentration of (R,S)-norKet. This difference is consistent with an earlier study of (R,S)-Ket excretion in humans after a single i.v. dose in which the 24-h cumulative urinary excretion of (R,S)-DHNK was 16.1% of the administered dose while (R,S)-norKet accounted for only 1.6% of the dose, [19]. The urinary concentrations of the hydroxylated norKet and Ket metabolites have not been previously determined. In this study, the hydroxylated norKet metabolites constituted the second major group of metabolites with the peak associated with the estimated concentration of the peak identified as (2S,5R)/(2R,5S)-HNKet (4f) at 4,000 ng/ml and the concentration of (2S,6S)/(2R,6R)-HNKet (4a) at > 2,000 ng/ml, Table 7. No significant concentrations of the HKet metabolites (5a–5d) were detected, which was consistent with the analysis of the plasma sample.
3.4.2. Urinary patters of the glucuronides of HNKet
Only the glucuronides of the HNKet were detected in the urine sample (peaks 6a–6e). The peak labeled as 6a was identified as the glucuoronide produced by the incubation of (2S,6S)-/(2R,6R)-HNKet with UGT 2B4 microsomal protein. No attempt was made to identify the structures of peaks 6b–6e or to determine the concentrations of these glucuronides.
4. Discussion
The current “ketamine paradigm” assumes that (R,S)-Ket and (R,S)-norKet are the active agents responsible for the antinociceptive response with the (S)-enantiomers of these compounds the more potent analgesic agents [21,22]. These assumptions have led to the design of pharmacokinetic and pharmacodynamic studies which only measured the plasma concentrations of (R,S)-Ket and (R,S)-norKet or the individual (R)- and (S)-enantiomers of these compounds. This was the approach we employed in the “pilot study” with the objective of determining the pharmacodynamic relationship between the plasma concentrations of (R)- and (S)-Ket and (R)- and (S)-norKet and perceived pain relief in CRPS patients. However, the results of the “pilot study” indicated that the systemic exposure to (R,S)-Ket and (R,S)-norKet may not be responsible for all of this drug’s antinociceptive properties. In addition, the varied responses to treatment observed in the “pilot study” and in an earlier study also employing (R,S)-Ket in CRPS patients [24] suggest that inter-individual differences in the ability to metabolize (R,S)-Ket and the resulting differences in the concentrations of downstream metabolites may play a role in the observed therapeutic efficacy.
The primary “downstream” metabolites of (R,S)-Ket and (R,S)-norKet have been identified as the enantiomeric (R,S)-DHNK and a family of diastereomeric hydroxy metabolites [3–5]. However, the antinociceptive properties of these “downstream” metabolites have not been definitively established, nor has their plasma pharmacokinetics and urinary excretion in humans. Indeed, to our knowledge only one study has measured the plasma concentrations of (R,S)-DHNK after administration of (R,S)-Ket to intensive care patients [23]. (R)-DNHK, (S)-DHNK and have also been identified but not quantified in studies of the enantioselective pharmacokinetics of (R,S)-Ket in Shetland ponies [12–14] and in the urine of volunteers administered (R,S)-Ket [5]. Thus, the current study was designed to measure the plasma and urinary concentrations of (R,S)-DHNK and the diastereomeric HNK and HKet metabolites. In this study, commercially available (R,S)-DHNK was used directly in the development and validation of the assay. The HNK and HKet metabolites were not available and had to be synthesized. Previous studies have identified 12 potential HNK and 12 potential HKet metabolites arising from hydroxylation at the 4, 5 and 6 positions on the cyclohexanone ring [3,4]. Since the synthesis and characterization of (2R,6R)-HNK/(2S,6S)-HNK [16] and (2S,6S)-HKet and (2S,6R)-HKet [18] had been reported, it was decided to synthesize these compounds and use them in the validation studies. The approach utilized in this study was to use the calibration curves developed and validated for (2R,6R)-HNK/(2S,6S)-HNK and (2S,6S)-HKet to approximate the plasma and urine concentrations of the other HNK and HKet metabolites using the same MRM transitions.
The assay developed in this study was used to analyze plasma and urine samples obtained from an CRPS patient receiving (R,S)-Ket. The data from these samples suggest that in this patient, (R,S)-norKet was not the primary metabolite, but the initial metabolite. The primary circulating metabolites were the HNK metabolites suggesting that these compounds may play a role in pain relief experienced by the patient. However, there is only one reported study of the pharmacological activity of these compounds in which it was determined that (2S,6S)/(2R,6R)-HNK has no anesthetic activity, but reaches significant concentration in the CNS [16]. The pharmacological activity of these compounds and the (2S,6S)-HKet and (2S,6R)-HKet metabolites is currently under investigation and will be reported elsewhere.
The analysis of the plasma and urine samples from this patient also demonstrate that the norKet is a relatively minor metabolite relative to DNHK as the plasma concentration of this compound is ~40-fold greater than norKet and the urine concentration is >120-fold larger. The relationship between the plasma concentrations of DHNK and norKet are also consistent with data from the earlier study in which intensive care patients received an initial i.v. bolus injection of (R,S)-Ket followed by a 2-h infusion of the drug [23]. The plasma concentration – time curve demonstrated that (R,S)-Ket was rapidly cleared and replaced by (R,S)-norKet as the major circulating compound, see Fig. 3 in [23]. Significant concentrations of (R,S)-DHNK were also observed after the initial administration of (R,S)-Ket and 4 h after the end of the infusion, the plasma level of (R,S)-DHNK was greater than that of (R,S)-Ket and almost as great as (R,S)-norKet. These results led the authors to suggest that (R,S)-norKet and (R,S)-DHNK may contribute to the observed pharmacological effects of (R,S)-Ket. The relative urine concentrations of DHNK and norKet are also consistent with the total urinary excretion of the two compounds in humans after a single i.v. dose of (R,S)-Ket in which the 24-h cumulative urinary excretion of (R,S)-DHNK was 16.1% of the administered dose while (R,S)-norKet accounted for only 1.6% of the dose, [19]. The pharmacological activities of (R)- and (S)-DHNK have not been established and are currently under investigation. The results of these studies will be reported elsewhere.
The data from this study demonstrate that an extended study of the plasma and urine concentrations of (R,S)-Ket and its metabolites in CRPS patients is feasible and possible, and that the currently accepted “ketamine paradigm” may not explain the antinociceptive activity of (R,S)-Ket in CRPS patients. These studies have been initiated using the assay and the standards prepared in this study and the results will be reported elsewhere.
Supplementary Material
Acknowledgments
This research was supported in part by the Intramural Research Program of the National Institute on Aging/NIH and by the National Institutes on Aging under contract number N01AG-3-1008.
Footnotes
Publisher's Disclaimer: This is a PDF file of an unedited manuscript that has been accepted for publication. As a service to our customers we are providing this early version of the manuscript. The manuscript will undergo copyediting, typesetting, and review of the resulting proof before it is published in its final citable form. Please note that during the production process errors may be discovered which could affect the content, and all legal disclaimers that apply to the journal pertain.
References
- 1.Goldberg ME, Torjman MC, Schwartzman RJ, Mager DE, Wainer IW. Pain Physician. 2010;13:379–387. [PMC free article] [PubMed] [Google Scholar]
- 2.Goldberg ME, Torjman MC, Schwartzman RJ, Mager DE, Wainer IW. Chirality. in press. [DOI] [PMC free article] [PubMed] [Google Scholar]
- 3.Adams JD, Jr, Baillie TA, Trevor AJ, Castagnoli N. Biomed Mass Spec. 1981;8:527–538. doi: 10.1002/bms.1200081103. [DOI] [PubMed] [Google Scholar]
- 4.Trevor AJ, Woolf TF, Baillie TA, Adams JD, Castagnoli N. In: Phencyclidine and Related Arylcyclohexylamines: Present and Future Applications. Kamenka JM, Domino EF, Geneste P, editors. NPP Books; Ann Arbor: 1983. pp. 279–289. [Google Scholar]
- 5.Turfus SC, Parkin MC, Cowan DA, Halket JM, Smith NW, Braithwaite RA, Elliot SP, Steventon GB, Kicman AT. Drug Metab Dispos. 2009;37:1769–1778. doi: 10.1124/dmd.108.026328. [DOI] [PMC free article] [PubMed] [Google Scholar]
- 6.Geisslinger G, Hering W, Thomann P, Knoll R, Kamp HD. Br J Anaesthesia. 1993;70:666–671. doi: 10.1093/bja/70.6.666. [DOI] [PubMed] [Google Scholar]
- 7.Ihmsen H, Geisslinger G, Schuttler J. Clin Pharmacol Ther. 2001;70:431–8. doi: 10.1067/mcp.2001.119722. [DOI] [PubMed] [Google Scholar]
- 8.Rosas MER, Patel S, Wainer IW. J Chromatogr B. 2003;794:99–108. doi: 10.1016/s1570-0232(03)00420-3. [DOI] [PubMed] [Google Scholar]
- 9.Yanagihara Y, Ohtani M, Kariya S, Uchino K, Aoyama T, Yamamura Y, Iga T. J Chromatogr B. 2000;746:227–231. doi: 10.1016/s0378-4347(00)00331-5. [DOI] [PubMed] [Google Scholar]
- 10.Yanagihara Y, Ohtani M, Kariya S, Uchino K, Hiraishi T, Ashozawa N, Aoyama T, Yamamura Y, Yamada Y, Iga T. Biopharm Drug Dispos. 2003;24:37–43. doi: 10.1002/bdd.336. [DOI] [PubMed] [Google Scholar]
- 11.Theurillat R, Knobloch M, Schmitz A, Lassahn PG, Mevissen M, Thormann W. Electrophoresis. 2007;28:2748–2757. doi: 10.1002/elps.200600820. [DOI] [PubMed] [Google Scholar]
- 12.Larenza MP, landoni MF, Levionnois OL, Knobloch M, Kronen PW, Theurillat R, Shatzmann U, Thormann W. Br J Anaesthesia. 2007;98:204–212. doi: 10.1093/bja/ael336. [DOI] [PubMed] [Google Scholar]
- 13.Knobloch M, Portier CJ, Levionnois OL, Theurillat R, Thormann W, Spadavecchia C, Mevisen M. Tox App Pharmacol. 2006;216:373–386. doi: 10.1016/j.taap.2006.06.011. [DOI] [PMC free article] [PubMed] [Google Scholar]
- 14.Larenza MP, Peterbauer C, Landoni MF, Levionnois OL, Schatzmann U, Spadavecchia C, Thormann W. Am J Vet Res. 2009;70:831–839. doi: 10.2460/ajvr.70.7.831. [DOI] [PubMed] [Google Scholar]
- 15.Hudyma TW, Holmes SW, Hooper IR. German Patent. DE 206260. Ger Offen. 1971:27.
- 16.Leung LY, Baillie TA. J Med Chem. 1986;29:2396–2399. doi: 10.1021/jm00161a043. [DOI] [PubMed] [Google Scholar]
- 17.Chang Hong S, Davisson JN. J Pharm Sci. 1982;71:912–914. doi: 10.1002/jps.2600710818. [DOI] [PubMed] [Google Scholar]
- 18.Woolf T, Trevor A, Baillie T, Castagnoli N., Jr J Org Chem. 1984;49:3305–3310. [Google Scholar]
- 19.Wieber J, Gugler R, Hengstmann JH, Dengler HJ. Anaesthesist. 1975;24:260–263. [PubMed] [Google Scholar]
- 20.Woolf TF, Adams JD. Xenobiotica. 1987;17:839–847. doi: 10.3109/00498258709043993. [DOI] [PubMed] [Google Scholar]
- 21.White PF, Schuettler J, Shafer A, Stanski DR, Horai Y, Trevor AJ. Br J Anaesthesia. 1985;57(1987):197–203. doi: 10.1093/bja/57.2.197. [DOI] [PubMed] [Google Scholar]
- 22.Holtman JR, Crooks PA, Johnson-Hardy JK, Hojomat M, Kleven M, Wala EP. Pharmacol Biochem Behavior. 2008;90:676–685. doi: 10.1016/j.pbb.2008.05.011. [DOI] [PubMed] [Google Scholar]
- 23.Bolze S, Boulieu R. Clin Chem. 1998;44:560–564. [PubMed] [Google Scholar]
- 24.Rabben T, Skjelbred P, Øye I. Pharmacol Exp Ther. 1999;289:1060–1066. [PubMed] [Google Scholar]
Associated Data
This section collects any data citations, data availability statements, or supplementary materials included in this article.


