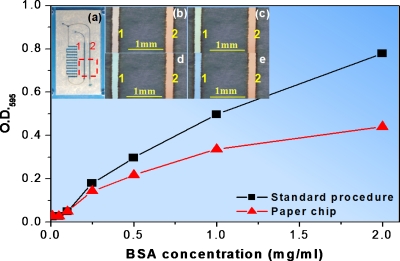
Figure 5.
Signal intensity dependency from protein concentration in solution. Absorbance intensity of BSA solution in microfluidic channel 2 in (a) (red) and tubes (black). The measurements were performed using a spectrophotometer at 595 nm. (b)–(e) are magnified pictures corresponding to the selected area in (a) to show the color changes in the chip as a qualitative measurement of protein. Coomassie Brilliant Blue G-250 dye solution was first infused into the channel 2 as a reference, mixed with BSA dilutions in the left area of the chip and then flew into channel 1(a). (b) Background (no protein), color of dye diluted by synthetic urine. (c) Synthetic urine solution with BSA concentration of 500 μg∕ml. (d) Synthetic urine solution with BSA concentration of 1000 μg∕ml (e) Synthetic urine solution with BSA concentration of 2000 μg∕ml.

