

Abstract
Protein translocation, or the change in a protein’s location between different subcellular compartments, is a critical process by which intracellular proteins carry out their cellular functions. Aberrant translocation events contribute to various diseases ranging from metabolic disorders to cancer. In this study, we demonstrate the use of a newly developed single-cell tool, microfluidic total internal reflection fluorescence flow cytometry (TIRF-FC), for detecting both cytosol to plasma membrane and cytosol to nucleus translocations using the tyrosine kinase Syk and the transcription factor NF-κB as models. This technique detects fluorescent molecules at the plasma membrane and in the membrane-proximal cytosol in single cells. We were able to record quantitatively changes in the fluorescence density in the evanescent field associated with these translocation processes for large cell populations with single cell resolution. We envision that TIRF-FC will provide a new approach to explore the molecular biology and clinical relevance of protein translocations.
Introduction
Within eukaryotic cells, proteins efficiently and selectively transit between functionally distinct subcellular compartments including the plasma membrane, cytosol, nucleus and other membrane-enclosed organelles. A variety of mechanisms then function to localize proteins to the appropriate subcellular compartments where they can carry out their intended functions. The translocation of a protein from the cytosol to the plasma membrane, for example, can result from the receptor-triggered binding of signaling proteins with PH (pleckstrin homology), C1, C2, and related domains to membrane phospholipids 1, 2. Nucleocytoplasmic transport (the translocation between the cytosol and the nucleus) occurs via nuclear pore complexes (NPCs) with the participation of a large family of transport receptors called karyopherins 3, 4. The transport receptors bind to nuclear localization signals (NLSs) or nuclear export signals (NESs) in their cargoes and mediate their transport through the NPCs. A regulating switch, RanGTPase, determines the directionality and rate of transport 5. Finally, proteins also move into and out of organelles such as the endoplasmic reticulum (ER), Golgi and mitochondria 6, 7. Regulatory steps that target a protein such as a tumor suppressor, transcription factor or oncoprotein to its intracellular site of action often involve cell-signaling events, protein modifications, and coordinated interactions with transport proteins. Dysfunctions in any of these steps may lead to disrupted translocation or mislocalization. For example, mislocalizations of Akt, NF-κB, FOXO, p27, and p53 have been well-documented as key features in a variety of cancers 8, 9. Thus, modulation of the translocation of these molecules has been proposed and practiced as an interesting therapeutic approach for the treatment of cancer 9, 10. Understanding the nature of the signaling dysfunctions and the molecular biology associated with these translocations is critical for obtaining mechanistic insights into the cellular processes and for developing treatments for disease.
Several important tools have been applied to study protein translocations. Subcellular fractionation is routinely used to homogenize cells and then physically separate the lysate into fractions representing different subcellular compartments11, 12. Western blotting analysis typically follows subcellular fractionation for the identification of the target protein. Unfortunately, besides the semi-quantitative nature of Western blotting, analyses based on subcellular fractionation reflect only the average properties of the entire population without single cell resolution due to the required homogenization. Such results may bury critical information on cell subsets and population heterogeneity. Fluorescence imaging and imaging-based cytometric tools such as Laser scanning cytometry (LSC) 13, 14 or imaging flow cytometry 15, 16 have been utilized to study cytosol/nucleus distribution of a protein and nucleocytoplasmic transport. However, these methods are not ideal for quantitative analysis. The image analysis algorithms implemented in these techniques are often complex and lack robustness and consistency for satisfactory quantitative measurements. More importantly, the throughput of these techniques (i.e., how fast each cell is examined) is ultimately limited both by the exposure time needed to form images with sufficient spatial resolution and the response time taken by the array detector (e.g., a CCD camera) to transfer the image data. Recent development of microfluidic cell arrays 17–20 allows observation of cellular dynamics at the single cell level. However, such observation is limited by the frame size of the imaging device and the interrogation of a large cell population remains challenging. The use of high-throughput tools to extract information from a large number of cells is critical for understanding the potential population heterogeneity. For example, when cells show an all-or-none response to a particular stimulus (bistability) 21, 22, a large sample size ensures accurate representation of different cell subsets. Thus, single-cell tools with high throughput and quantitative power are desired for studying protein translocations.
In this study, we demonstrated the use of a high-throughput quantitative technique, total internal reflection fluorescence flow cytometry (TIRF-FC)23, to study both cytosol to plasma membrane and cytosol to nucleus translocations. TIRF takes advantage of a surface evanescent field (~100 nm in the thickness) generated by an internally reflecting laser beam at a planar interface between two media with different refractive indices. TIRF microscopy (TIRFM) has been used to observe cellular events in the vicinity of the plasma membrane with low background by illuminating only the fluorescent molecules in the evanescent field 24–31. Compared to TIRFM which images a small number of adherent cells with a CCD camera, TIRF-FC allows rapid screening of a cell population at the single cell level and recording of the fluorescence intensity in the evanescent field by a single element photodetector (e.g., a photomultiplier tube). This offers ultrafast response time and easy quantification23. The data generated by TIRF-FC accurately reflect the population distribution and characteristics which may be poorly represented by imaging a small cell subset. The quantitative nature of TIRF-FC, together with its single cell resolution, also renders it superior to Western blotting that reflects only the population average and is semi-quantitative. We used a kinase Syk and a transcription factor NF-κB as model proteins for the studies of cytosol to membrane and cytosol to nucleus translocations, respectively. Although TIRFM has been applied to study membrane translocations 32–34, this is the first report that cytosol to nucleus translocation can be studied by techniques based on evanescent wave illumination. We envision that TIRF-FC will be a useful new tool for studying the molecular biology of protein translocations and for examining clinical samples where protein translocations may contribute to the disease state.
RESULTS
The design of the microfluidic device for TIRF-FC (Fig. 1) is similar to what was described in our previous study23. The central part of the TIRF-FC device utilizes a partially closed elastomeric two-layer valve35 to force flowing cells to “squeeze through” a constriction whose depth was smaller than the cell diameter. When a cell passes the detection, the part of the cell that is in the vicinity of the membrane is subjected to the evanescent field illumination and the fluorescence intensity from this region is recorded by a photomultiplier tube (PMT) (Fig. 1a). Hydrodynamic focusing is used to confine the flowing cells to the center of the microfluidic channel so that they pass under the constriction created by the two-layer valve (Fig. 1b). The fluorescence signals are calibrated to reflect the fluorescence density (fluorescence intensity/membrane area) for each cell (detailed in the experimental section). A valve control circuit is used to respond promptly to clogging events by opening the valve temporarily to remove clogged cells and then restoring the pressure to resume the screening23. Cells were screened at a speed of ~200–300 cells/s. Fig. 1c shows the actual setup based on a fluorescence microscope.
Figure 1.
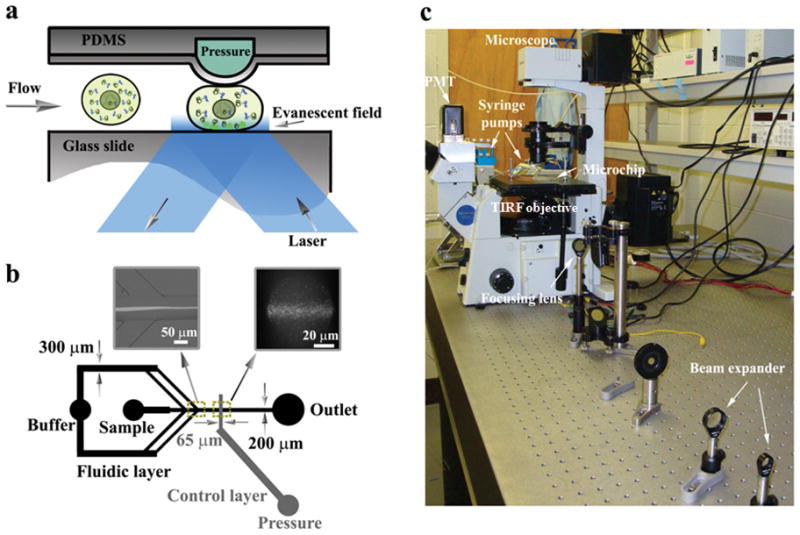
(a) Schematic of microfluidic TIRF-FC device with an elastomeric valve that forces flowing cells into the evanescent field. (b) The design of microfluidic channels on the device. The buffer flow enters from one inlet and is then symmetrically divided into two pairs of streams for hydrodynamic focusing of the sample flow that contains cells. The distance between the two focusing points is 750 μm. Left inset: the hydrodynamic focusing. Right inset: TIRFM image of fluorescent trail detected by the evanescent wave illumination. (c) The optical setup of the apparatus. Details about the setup are given in the experimental section.
We first used TIRF-FC to study the translocation of Syk from the cytosol to the plasma membrane. The protein-tyrosine kinase Syk is essential for the survival, proliferation and differentiation of B lymphocytes 36, 37. Syk translocates to the plasma membrane by interacting with a pair of phosphotyrosines located within immunoreceptor tyrosine-based activation motifs (ITAMs) present on the cytoplasmic tails of components of the B cell antigen receptor (BCR) 38, 39. Clustering of the BCR by interactions with antigens leads to the phosphorylation of receptor ITAMs and the recruitment of Syk, which binds via a tandem pair of N-terminal SH2 domains. Syk and Lyn deficient DT40 chicken B cells expressing SykEGFP were used for our demonstration. As demonstrated previously, SykEGFP is recruited to the plasma membrane and interacts with the clustered BCR when the cells are stimulated by anti-IgM antibody40.
Fluorescence microscopy was used to confirm the translocation and examine changes occurring close to the membrane of cells. Epifluorescence images of DT40 cells revealed that treatment with anti-IgM (5 μg/ml) led to the clustering and redistribution of Syk-receptor complexes to form a cap at one pole of the cell (Fig. 2a). This is indicative of the membrane translocation of SykEGFP. As shown in the TIRFM images in Fig. 2b, patches of aggregated SykEGFP on the membrane started to appear 10 min following stimulation. The fluorescence intensity at the membrane vicinity increased significantly between 10 and 20 min. The intensity decreased from 20 to 60 min possibly due to the photobleaching of the fluorescent protein marker. Finally, the movement of a portion of SykEGFP to the membrane fraction as a function of time was verified by subcellular fractionation and Western blotting (Fig. 2c).
Figure 2.

Translocation of Syk to the plasma membrane examined by epifluorescence, TIRFM imaging and Western blotting. (a) Epifluorescence images of SykEGFP-DT40-Syk−-Lyn− cells stimulated at 22 °C for 0 min and 60 min with 5 μg/ml anti-IgM antibody. Syk translocation can be recognized by the characteristic SykEGFP capping on one pole of the cells (marked by arrows). (b) Syk translocation observed by TIRFM when the cells were stimulated for 0, 10, 20 and 60 min. (c) Western blotting analysis of Syk from different subcellular compartments after stimulation for various periods of time. Subcellular fractionation was used to separate cell lysates into fractions representing different subcellular compartments (M: Membrane; C: Cytosol).
The TIRFM data in Fig. 2b reveal that photobleaching is a critical limitation to quantitative time-lapsed analysis of protein translocation by fluorescence imaging. TIRF-FC solves this problem by subjecting flowing cells only briefly to the laser illumination during screening. TIRF-FC also examines the fluorescence of a much larger cell population than imaging so that the data are reflective of the characteristics of the population distribution. As shown in Fig. 3a, the histogram of the fluorescence density generated by a cell population of ~5000 cells gradually shifted to the higher end as time following stimulation progressed from 0 to 20 min. The shift of the histogram between 20 and 60 min was not as pronounced. As shown in Fig. 3b, the population-averaged fluorescence density from the evanescent field increased by about 84% over the 60-min period after stimulation due to the translocation of the kinase to the membrane. As a negative control, such a shift after stimulation did not occur when cells lacking the EGFP fusion protein, but stained instead by calcein AM, were examined (Fig. 3c).
Figure 3.

Syk translocation to the plasma membrane studied by microfluidic TIRF-FC. (a) Histograms of fluorescence density collected from populations of ~5000 cells at various periods (0, 10, 20, and 60 min) after stimulation by anti-IgM at 22 °C. (b) The population-averaged fluorescence density variation over various stimulation times. The initial average fluorescence density at time 0 is designated as 100%. (c) Histograms of fluorescence density taken from DT40 cells without SykEGFP expression stained with calcein AM. One cell population was stimulated by anti-IgM at 22 °C for 60 min while the other was not stimulated.
We found that evanescent-field-based tools such as TIRFM and TIRF-FC also offer the capacity to study the nucleocytoplasmic transport of proteins, although such translocations do not directly involve the plasma membrane as a subcellular location of action. We used TIRF-FC to study the transport of NF-κB from the cytosol to the nucleus as a proof-of-concept. NF-κB is a family of dimeric transcription factors that regulate cellular stress responses, cell division, apoptosis, and inflammation 41–43. The activity of NF-κB is regulated by its cytoplasmic inhibitor IκB, which binds to NF-κB, masks its nuclear localization signal and retains it in the cytoplasm44,45. Signals from extracellular stimuli (e.g., TNFα, IL-1, LPS and DNA-damaging agents) are transduced to the IκB kinase (IKK) complex. IKK then phosphorylates IκB, leading to its degradation via ubiquitination and proteolysis. This allows NF-κB to translocate to the nucleus, bind DNA and regulate gene transcription46–48. Prominent basal nuclear localization of NF-κB is found in breast, ovary, colon, pancreas and thyroid tumor cells 49.
We examined the translocation of NF-κB using a Chinese hamster ovary (CHO) cell line expressing the p65 component of NF-κB fused to GFP. The time-lapsed epifluorescence and TIRFM images of cells expressing p65-GFP after stimulation by IL-1β are shown in Fig. 4a. Based on the epifluorescence images, the nucleocytoplasmic translocation (from cytosol to nucleus) was complete by 60 min following stimulation. As the protein translocated to the nucleus from the cytoplasm, the fluorescence from the evanescent field layer decreased substantially. The translocation was confirmed by subcellular fractionation and Western blotting (Fig. 4b).
Figure 4.

Nucleocytoplasmic translocation of NF-κB examined by epifluorescence, TIRFM imaging and Western blotting. (a) Epifluorescence images (upper row) and TIRFM images (lower row) of CHO/GFP-NFκBp65 undergoing nucleocytoplasmic transport after stimulation by 20 ng/ml IL-1β at 22 °C for 0, 10, 60, and 120 min. (b) Western blotting analysis of NF-κB from different subcellular compartments after stimulation for various periods of time. Subcellular fractionation was used to separate cell lysates into nuclear and cytosolic fractions.
It is difficult to determine, based solely on TIRFM images, whether a fluorescence decline is due to an actual change in the location of a protein or to photobleaching. However, photobleaching does not affect the data obtained using TIRF-FC. As shown in Fig. 5a, the histogram of the fluorescence density decreased substantially with the increased transit of NF-κB into the nucleus as a function of time. Thus, the translocation to the nucleus decreased the concentration of membrane-proximal cytosolic NF-κB, which is detectable by TIRF-FC. In Fig. 5b, we show that the population-averaged fluorescence density of membrane-proximal NF-κB (which is proportional to its cytosolic concentration close to the membrane) decreased to 65% of its original value 60 min after stimulation, with no further decrease between 60 and 120 min.
Figure 5.

Nucleocytoplasmic translocation of NF-κB studied by microfluidic TIRF-FC. (a) Histograms of fluorescence density collected from populations of ~5000 cells at 0, 10, 60, and 120 min after stimulation by IL-1β at 22 °C. (b) The population-averaged fluorescence density variation over various stimulation times. The initial average fluorescence density at time 0 is designated as 100%.
DISCUSSION
TIRF-FC provides a quantitative approach to study protein translocations. TIRF illumination excites fluorescent molecules both at the plasma membrane and in the membrane-proximal cytosol. This feature allows us to examine both cytosol to plasma membrane translocation and nucleocytoplasmic transport. With the use of a PMT (as in classical flow cytometry), TIRF-FC generates quantitative data with ultrafast response times and high throughput, thus eliminating the burden associated with image storage and analysis. Also similar to classical flow cytometry, it is possible to establish for TIRF-FC a data calibration system that facilitates inter-laboratory and cross-platform comparison, quality control and absolute quantification 50–52. For example, if we use the fluorescence density artificially created in labeled cells (e.g., cells labeled by calcein AM at a concentration of 50 ng/ml for 10 min) as a reference, we can determine that, on average, the SykEGFP molecules that moved into the evanescent field within 60 min generate fluorescence equivalent to 31.7% of the calcein molecules present in the same field. In comparison, the amount of NF-κB translocated in 2 hrs is equivalent to 18.2% of the fluorescence of the calcein molecules.
The comparison of TIRF-FC results with Western blotting data reveals some interesting facts. For the translocation of Syk to the membrane, the quantification using Western blotting analysis reveals a 2.87-fold increase in the amount of membrane-bound Syk at 60 min compared to the initial amount at time 0. This is significantly larger than the change (a factor of 1.84) detected by TIRF-FC. This is due to the fact that Western blotting after subcellular fractionation detects only the protein amount associated with the membrane while TIRF-FC detects both the membrane protein and the membrane-proximal cytosolic protein. The comparison suggests that the change in the protein concentration in the membrane-proximal cytosol is minimal compared to that at the membrane during the translocation of the kinase to the membrane receptor. The analysis of NF-κB translocation by Western blotting shows that the cytosolic fraction dropped to 74% at 120 min, which is comparable to 65% detected by TIRF-FC (given the semi-quantitative nature of Western blotting). This indicates that the NF-κB concentration in the vicinity of the membrane was similar to its average concentration in the cytosol.
EXPERIMENTAL
Cell sample preparation
Chicken DT40 B cells with Syk- and Lyn-deficiency (DT40-Syk−-Lyn−) and SykEGFP-DT40-Syk−-Lyn− cell lines were produced as described previously 40. Briefly, an XhoI/HpaI DNA fragment encoding Syk was cut from EPB:SykMyc 53. Insertion of this fragment into XhoI/SmaI sites of thepEGFP-N2 vector (Clontech) resulted in a fusionof Syk and enhanced GFP (SykEGFP). DT40-Syk−-Lyn− cells (1 × 10⁶) were transfected with 20μg of the DNA construct as previously described to produce SykEGFP-DT40-Syk−-Lyn−54. Both DT40 cell lines were cultured for at least 15 passages in complete medium (RPMI 1640media supplemented with 10% heat-inactivated fetal calf serum, 1% chicken serum, 50 μM 2-mercaptoethanol, 1 mM sodium pyruvate, 100 IU/ml penicillin G, and 100 μg/ml streptomycin) before the experiment in microfluidic TIRF-FC devices. After 48 hours of culturing, cells were harvested and suspended in phosphate buffered saline (PBS). To stimulate cells, 5 μg goat anti-chicken immunoglobulin M (IgM) antibody (Bethyl Laboratories) was added to 106 cells and incubated for designated periods at 22 °C. To establish a negative control, both stimulated and unstimulated DT40-Syk−-Lyn− cells were stained with a fluorogenic dye, calcein AM (Invitrogen), at a concentration of 50 ng/ml for 10 min. Cells were washed twice in PBS to remove unabsorbed calcein AM before analysis with TIRF-FC. CHO/GFP-NFκBp65 cell line (Panomics) was obtained by co-transfection of an expression vector for a fusion protein of turboGFP (Evrogen) and human NFκBp65, as well as pHyg into Chinese hamster ovary (CHO) cells. The cells were subcultured every two days in Hams F12K media supplemented with 10% fetal bovine serum,100 IU/ml penicillin G, 100 μg/ml streptomycin and 100 μg/ml Hygromycin. In order to stimulate cells with IL-1 β at 20 ng/ml, cells were starved in serum free media for 4 hr. Cells were detached by addition of 0.25% trypsin for 1 min and washed twice by PBS. To stimulate suspension cells, cells at a concentration of 106/ml were treated with 20 ng/ml IL-1 β at 22 °C for designated periods. All cell samples were centrifuged at 300 × g for 4 min and resuspended in PBS at a final cell density of 107 cells/ml before TIRF-FC experiments.
Subcellular fractionation and Western blotting
SykEGFP-DT40-Syk−-Lyn− cells (1×10⁶ cells/ml) treated with or without 50 μg/ml anti-IgM antibody were permeabilized by incubation in a buffer containing 0.1% digitonin, 250 mM sucrose and 1 mM EDTA. The particulate (membrane) fraction was collected by centrifugation at 1000 ×g, washed once with digitonin free lysis buffer and solubilized in sodium dodecyl sulfate (SDS)-sample buffer to release proteins. The proteins in both soluble (cytosolic) fraction and particulate (membrane) fraction were separated by SDS-polyacrylamide gel electrophoresis (SDS-PAGE), transferred to polyvinylidene difluoride (PVDF) membranes and detected by Western blotting with an anti-Syk antibody (N-19, Santa Cruz Biotechnology). Before performing fractionation of GFP-NFκBp65 CHO cells, cells were washed with PBS supplemented with 200 μg/ml soybean trypsin inhibitor before they were suspended in 400 μl cold buffer A (10 mM Hepes, pH 7.9, 10 mM KCl, 0.1 mM EDTA, 0.1 mM EGTA, 1 mM DTT, 0.5 mM PMSF, 1 mM NaOV, 2X protease inhibitor cocktail) and allowed to swell on ice for 10 min. NP-40 was added to cells to achieve a final concentration of 0.2%. The homogenates were incubated on ice for another 5 min and then centrifuged at 20,000 × g for 30 s. The supernatants were saved as cytosolic fractions while the nuclear pellets were washed with 200 μl detergent-free buffer A. The nuclear fractions were then resuspended in 300 μl SDS-sample buffer (25% sucrose, 2.5% SDS, 25 mM Tris/2.5 mM EDTA, 0.25 % pyronin Y) by using a 1-ml syringe with a 22G1/2 needle to shear the chromosomal DNA. The resulting samples were then subjected to SDS-PAGE and Western blot analysis with an anti-RelA antibody (Santa Cruz Biotechnology).
Microchip fabrication
The design of the microfluidic TIRF-FC device is shown in Fig. 1. The device including a control layer and a fluidic layer was fabricated using multilayer soft lithography 23, 35. Microscale features were designed using a computer aided software (Freehand) and printed out on a transparency as a photomask with high resolution at 5080 dpi. The control layer master (photoresist/silicon wafer) was made using a negative photoresist SU-8 2025 (Microchem) with a thickness of 33 μm. The fluidic layer master fabricated with a positive photoresist AZ 9260 (Clariant) was baked at 120 °C for 2 min to generate a rounded cross section for the channel. The depth at the center of the fluidic channel was ~18 μm. Both control and fluidic layers of the device were molded using PDMS of the same composition (GE Silicones RTV 615, mass ratio of A:B=10:1). The thickness of the fluidic layer was measured to be 35 μm, formed by spinning of prepolymer PDMS at 4000 rpm for 30 s. The control layer had a thickness ~0.5 cm. The two layers were bonded together after oxidization of the PDMS surfaces in a plasma cleaner (Harrick). This complex was then bonded to a pre-cleaned glass slip (45 mm × 50 mm × 170 μm, No.1, Fisher Scientific) using the same oxidation method. The fluidic channels were conditioned with 1% Pluronic F-68 (Sigma) for 1 h before experiments to avoid cell adsorption to the surfaces.
Optical setup
The optical setup for TIRF-FC was described previously 23. In brief, a laser beam at 488 nm from an air-cooled 100mW argon ion laser (Spectra-Physics) was applied as the light source. The laser beam was expanded 5 times in diameter by a pair of lenses (f =15 mm and 75 mm, Thorlabs) before it was focused by a lens (f = 400 mm, Thorlabs) and entered the laser port B of an invert fluorescence microscope (IX-71, Olympus). The laser was then reflected by a dichroic beamsplitter (505DCLP, Chroma Technology) and focused at the back focal plane (BFP) of a TIRF objective (PlanApo, oil, 60X, NA=1.45, Olympus). By adjustment of the angle of incident light out of the objective (~2.1 mW), TIRF was achieved and the fluorescent molecules close to the surface of the glass substrate were illuminated by the evanescent field. The diameter of the circular illuminated area was approximately 70 μm. The fluorescence emission was collected by the same objective and filtered by the dichroic filter and emitter (D535/40, Chroma Technology) before it was recorded by a side-on photomultiplier tube (R9220, Hamamatsu) biased at 500 V. The bias voltage of the PMT was adjusted so that cells without labeling did not generate signal. A CCD camera (Coolsnap HQ, Photometrics) was used to take epifluorescence and TIRFM images based on the same setup.
Microchip operation and signal detection
The microfluidic device was mounted on an inverted fluorescence microscope (IX-71, Olympus). The sample and buffer inlets were connected with syringe pumps (PHD infusion pump, Harvard Apparatus) through plastic tubing. PBS was infused at 8 μl/min from the buffer inlet while the flow rate of the sample containing cells was set at 2 μl/min. The sample stream was focused twice (with a distance of 750 μm between the two focusing points), resulting in a focusing width of ~15.8 μm when 0.2 μm fluorescent beads were applied as the sample. The control channel was filled with deionized water to prevent air from leaking into the fluidic channel. The microfluidic elastomeric valve was operated by applying/releasing pressure (provided by a nitrogen cylinder) to the control channel via a fast-response solenoid valve (ASCO Scientific). The actuation pressure for the control valve (partially closed during operation) was maintained at 12 psi that generated strong fluorescence intensity without causing too much cell clogging. It is worth noting that this actuation pressure was optimized under the specific dimensions of the control and the fluidic channels and the PDMS membrane thickness between them (~17 μm). A control circuit was designed to quickly open-close the valve in case of cell clogging so that clogged cells were flushed out 23.
Signal processing
The fluorescence light collected by the PMT was transformed into a voltage signal which was input into a PCI data acquisition card (PCI-6254, National Instruments) operated by LabView software (National Instruments). A LabView program written in our lab recorded the fluorescence intensity at 106 Hz in the form of a series of spikes, each of which represents one cell flowing through the detection window. These data were further processed offline by MATLAB programs to generate the width and height of each spike. Thresholds for the peak width and height were set so that artifact peaks and peaks generated by adsorbed cells were discarded. The ratio of height to width (H/W) for each spike was a measure of the “fluorescence density” (the amount of fluorescence divided by the membrane area being examined) close to the cell surface for a particular cell 23. The fluorescence density data generated by a cell population were sorted into a histogram to represent the population. The fluorescence density was converted to 4 decade logarithmic voltage scale and assigned into 256 scale channels similar to conventional flow cytometry. Each histogram typically included a sample size of ~5000 cells.
Acknowledgments
We thank NSF CBET 1016547 and NIH NCI CA115465 and CA037372 for financial support of this research.
References
- 1.Pawson T. Nature. 1995;373:573–580. doi: 10.1038/373573a0. [DOI] [PubMed] [Google Scholar]
- 2.Lemmon MA, Ferguson KM. Biochem J. 2000;350(Pt 1):1–18. [PMC free article] [PubMed] [Google Scholar]
- 3.Nakielny S, Dreyfuss G. Cell. 1999;99:677–690. doi: 10.1016/s0092-8674(00)81666-9. [DOI] [PubMed] [Google Scholar]
- 4.Nigg EA. Nature. 1997;386:779–787. doi: 10.1038/386779a0. [DOI] [PubMed] [Google Scholar]
- 5.Gorlich D, Kutay U. Annu Rev Cell Developmental Biol. 1999;15:607–660. doi: 10.1146/annurev.cellbio.15.1.607. [DOI] [PubMed] [Google Scholar]
- 6.Rapoport TA. Nature. 2007;450:663–669. doi: 10.1038/nature06384. [DOI] [PubMed] [Google Scholar]
- 7.Wickner W, Schekman R. Science. 2005;310:1452–1456. doi: 10.1126/science.1113752. [DOI] [PubMed] [Google Scholar]
- 8.Bellacosa A, Kumar C, Di Cristofano A, Testa J. Adv Cancer Res. 2005;94:29–86. doi: 10.1016/S0065-230X(05)94002-5. [DOI] [PubMed] [Google Scholar]
- 9.Kau TR, Way JC, Silver PA. Nat Rev Cancer. 2004;4:106–117. doi: 10.1038/nrc1274. [DOI] [PubMed] [Google Scholar]
- 10.Davis JR, Kakar M, Lim CS. Pharm Res. 2007;24:17–27. doi: 10.1007/s11095-006-9133-z. [DOI] [PubMed] [Google Scholar]
- 11.Huber LA, Pfaller K, Vietor I. Circ Res. 2003;92:962–968. doi: 10.1161/01.RES.0000071748.48338.25. [DOI] [PubMed] [Google Scholar]
- 12.Richwood JMGaD. Subcellular Fractionation: a Practical Apprach. Oxford University Press; New York: 1997. [Google Scholar]
- 13.Deptala A, Bedner E, Gorczyca W, Darzynkiewicz Z. Cytometry. 1998;33:376–382. doi: 10.1002/(sici)1097-0320(19981101)33:3<376::aid-cyto13>3.0.co;2-q. [DOI] [PMC free article] [PubMed] [Google Scholar]
- 14.Harnett MM. Nat Rev Immunol. 2007;7:897–904. doi: 10.1038/nri2188. [DOI] [PubMed] [Google Scholar]
- 15.Arechiga AF, Bell BD, Solomon JC, Chu IH, Dubois CL, Hall BE, George TC, Coder DM, Walsh CM. J Immunol. 2005;175:7800–7804. doi: 10.4049/jimmunol.175.12.7800. [DOI] [PubMed] [Google Scholar]
- 16.Fanning SL, George TC, Feng D, Feldman SB, Megjugorac NJ, Izaguirre AG, Fitzgerald-Bocarsly P. J Immunol. 2006;177:5829–5839. doi: 10.4049/jimmunol.177.9.5829. [DOI] [PubMed] [Google Scholar]
- 17.Di Carlo D, Lee LP. Anal Chem. 2006;78:7918–7925. doi: 10.1021/ac069490p. [DOI] [PubMed] [Google Scholar]
- 18.Di Carlo D, Wu LY, Lee LP. Lab Chip. 2006;6:1445–1449. doi: 10.1039/b605937f. [DOI] [PubMed] [Google Scholar]
- 19.Kovac JR, Voldman J. Anal Chem. 2007;79:9321–9330. doi: 10.1021/ac071366y. [DOI] [PMC free article] [PubMed] [Google Scholar]
- 20.Salazar GT, Wang YL, Young G, Bachman M, Sims CE, Li GP, Allbritton NL. Anal Chem. 2007;79:682–687. doi: 10.1021/ac0615706. [DOI] [PubMed] [Google Scholar]
- 21.Ferrell JE, Jr, Machleder EM. Science. 1998;280:895–898. doi: 10.1126/science.280.5365.895. [DOI] [PubMed] [Google Scholar]
- 22.Ferrell JE., Jr Curr Opin Cell Biol. 2002;14:140–148. doi: 10.1016/s0955-0674(02)00314-9. [DOI] [PubMed] [Google Scholar]
- 23.Wang J, Bao N, Paris LL, Geahlen RL, Lu C. Anal Chem. 2008;80:9840–9844. doi: 10.1021/ac801940w. [DOI] [PMC free article] [PubMed] [Google Scholar]
- 24.Axelrod D. Traffic. 2001;2:764–774. doi: 10.1034/j.1600-0854.2001.21104.x. [DOI] [PubMed] [Google Scholar]
- 25.Steyer JA, Almers W. Nat Rev Mol Cell Biol. 2001;2:268–275. doi: 10.1038/35067069. [DOI] [PubMed] [Google Scholar]
- 26.Seisenberger G, Ried MU, Endress T, Buning H, Hallek M, Brauchle C. Science. 2001;294:1929–1932. doi: 10.1126/science.1064103. [DOI] [PubMed] [Google Scholar]
- 27.Stephens DJ, Allan VJ. Science. 2003;300:82–86. doi: 10.1126/science.1082160. [DOI] [PubMed] [Google Scholar]
- 28.Duncan RR, Greaves J, Wiegand UK, Matskovich I, Bodammer G, Apps DK, Shipston MJ, Chow RH. Nature. 2003;422:176–180. doi: 10.1038/nature01389. [DOI] [PubMed] [Google Scholar]
- 29.Jones JT, Myers JW, Ferrell JE, Meyer T. Nat Biotechnol. 2004;22:306–312. doi: 10.1038/nbt941. [DOI] [PubMed] [Google Scholar]
- 30.Chronis N, Lee LP. Lab Chip. 2004;4:125–130. doi: 10.1039/b311088e. [DOI] [PubMed] [Google Scholar]
- 31.Chen DL, Du WB, Ismagilov RF. New J Phys. 2009;11:075017. doi: 10.1088/1367-2630/11/7/075017. [DOI] [PMC free article] [PubMed] [Google Scholar]
- 32.Pinton P, Tsuboi T, Ainscow EK, Pozzan T, Rizzuto R, Rutter GA. J Biol Chem. 2002;277:37702–37710. doi: 10.1074/jbc.M204478200. [DOI] [PubMed] [Google Scholar]
- 33.Teruel MN, Meyer T. Science. 2002;295:1910–1912. doi: 10.1126/science.1065028. [DOI] [PubMed] [Google Scholar]
- 34.Smyth JT, Lemonnier L, Vazquez G, Bird GS, Putney JW. J Biol Chem. 2006;281:11712–11720. doi: 10.1074/jbc.M510541200. [DOI] [PubMed] [Google Scholar]
- 35.Unger MA, Chou HP, Thorsen T, Scherer A, Quake SR. Science. 2000;288:113–116. doi: 10.1126/science.288.5463.113. [DOI] [PubMed] [Google Scholar]
- 36.Zioncheck TF, Harrison ML, Geahlen RL. J Biol Chem. 1986;261:15637–15643. [PubMed] [Google Scholar]
- 37.Zioncheck TF, Harrison ML, Isaacson CC, Geahlen RL. J Biol Chem. 1988;263:19195–19202. [PubMed] [Google Scholar]
- 38.Takata M, Sabe H, Hata A, Inazu T, Homma Y, Nukada T, Yamamura H, Kurosaki T. EMBO J. 1994;13:1341–1349. doi: 10.1002/j.1460-2075.1994.tb06387.x. [DOI] [PMC free article] [PubMed] [Google Scholar]
- 39.Turner M, Mee PJ, Costello PS, Williams O, Price AA, Duddy LP, Furlong MT, Geahlen RL, Tybulewicz VL. Nature. 1995;378:298–302. doi: 10.1038/378298a0. [DOI] [PubMed] [Google Scholar]
- 40.Ma H, Yankee TM, Hu JJ, Asai DJ, Harrison ML, Geahlen RL. J Immunol. 2001;166:1507–1516. doi: 10.4049/jimmunol.166.3.1507. [DOI] [PubMed] [Google Scholar]
- 41.Ghosh S, May MJ, Kopp EB. Annu Rev Immunol. 1998;16:225–260. doi: 10.1146/annurev.immunol.16.1.225. [DOI] [PubMed] [Google Scholar]
- 42.Hoffmann A, Baltimore D. Immunol Rev. 2006;210:171–186. doi: 10.1111/j.0105-2896.2006.00375.x. [DOI] [PubMed] [Google Scholar]
- 43.Hoffmann A, Natoli G, Ghosh G. Oncogene. 2006;25:6706–6716. doi: 10.1038/sj.onc.1209933. [DOI] [PubMed] [Google Scholar]
- 44.Hoffmann A, Levchenko A, Scott ML, Baltimore D. Science. 2002;298:1241–1245. doi: 10.1126/science.1071914. [DOI] [PubMed] [Google Scholar]
- 45.Malek S, Chen Y, Huxford T, Ghosh G. J Biol Chem. 2001;276:45225–45235. doi: 10.1074/jbc.M105865200. [DOI] [PubMed] [Google Scholar]
- 46.Lernbecher T, Muller U, Wirth T. Nature. 1993;365:767–770. doi: 10.1038/365767a0. [DOI] [PubMed] [Google Scholar]
- 47.Chen LF, Fischle W, Verdin E, Greene WC. Science. 2001;293:1653–1657. doi: 10.1126/science.1062374. [DOI] [PubMed] [Google Scholar]
- 48.Nelson DE, Ihekwaba AEC, Elliott M, Johnson JR, Gibney CA, Foreman BE, Nelson G, See V, Horton CA, Spiller DG, Edwards SW, McDowell HP, Unitt JF, Sullivan E, Grimley R, Benson N, Broomhead D, Kell DB, White MRH. Science. 2004;306:704–708. doi: 10.1126/science.1099962. [DOI] [PubMed] [Google Scholar]
- 49.Rayet B, Gelinas C. Oncogene. 1999;18:6938–6947. doi: 10.1038/sj.onc.1203221. [DOI] [PubMed] [Google Scholar]
- 50.Wang LL, Gaigalas AK, Abbasi F, Marti GE, Vogt RF, Schwartz A. J Res Natl Inst Standards Technol. 2002;107:339–353. doi: 10.6028/jres.107.027. [DOI] [PMC free article] [PubMed] [Google Scholar]
- 51.Martin BR, Giepmans BNG, Adams SR, Tsien RY. Nat Biotechnol. 2005;23:1308–1314. doi: 10.1038/nbt1136. [DOI] [PubMed] [Google Scholar]
- 52.Wang J, Bao N, Paris LL, Wang HY, Geahlen RL, Lu C. Anal Chem. 2008;80:1087–1093. doi: 10.1021/ac702065e. [DOI] [PMC free article] [PubMed] [Google Scholar]
- 53.Keshvara LM, Isaacson C, Harrison ML, Geahlen RL. J Biol Chem. 1997;272:10377–10381. doi: 10.1074/jbc.272.16.10377. [DOI] [PubMed] [Google Scholar]
- 54.Keshvara LM, Isaacson CC, Yankee TM, Sarac R, Harrison ML, Geahlen RL. J Immunol. 1998;161:5276–5283. [PubMed] [Google Scholar]