Figure 3.
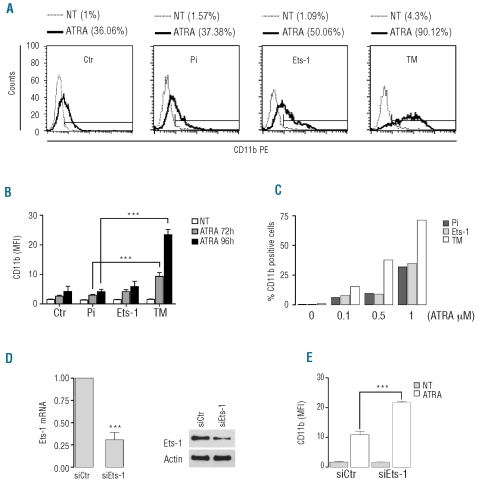
Inhibition of Ets-1 functions increased ATRA-induced differentiation in NB4 cells. (A) FACS analysis of CD11b, in untreated and 96 h ATRA-treated NB4 transduced cells. One representative experiment out of four is presented. (B) Mean fluorescence intensity (MFI) of CD11b in NB4 transduced cells after ATRA treatment. The values reported are the ratio between MFI of the sample and the isotype control. The error bars represent mean ± SD (n=4). (C) Representative experiment of CD11b expression in NB4 transduced cells treated with different concentrations of ATRA for 72 h. (D) NB4 cells transfected with control siRNA (siCtr) or Ets-1 siRNA (siEts-1). (Left) Analysis of Ets-1 mRNA by qRT-PCR at 48 h after transfection. The error bars represent the mean ± SD (n=3). (Right) A representative western blot of Ets-1 performed on NB4 cells transfected with siCtr and siEts-1. (E) Flow cytometric analysis of CD11b MFI in NB4 cells transfected with siCtr and siEts-1 after 72 h of treatment with ATRA. Mean values ± SD from three independent experiments.

