

Abstract
Context
Just as typical development of anatomical asymmetries in the human brain has been linked with normal lateralization of motor and cognitive functions, disruption of asymmetry has been implicated in the pathogenesis of neurodevelopmental disorders such as attention-deficit/hyperactivity disorder (ADHD). No study has examined the development of cortical asymmetry using longitudinal neuroanatomical data.
Objective
To delineate the development of cortical asymmetry in children with and without ADHD.
Design
Longitudinal study.
Setting
Government Clinical Research Institute.
Participants
A total of 218 children with ADHD and 358 typically developing children, from whom 1133 neuroanatomical magnetic resonance images were acquired prospectively.
Main Outcome Measures
Cortical thickness was estimated at 40 962 homologous points in the left and right hemispheres, and the trajectory of change in asymmetry was defined using mixed-model regression.
Results
In right-handed typically developing individuals, a mean (SE) increase in the relative thickness of the right orbitofrontal and inferior frontal cortex with age of 0.011 (0.0018) mm per year (t337=6.2, P<.001) was balanced against a relative left-hemispheric increase in the occipital cortical regions of 0.013 (0.0015) mm per year (t337=8.1, P<.001). Age-related change in asymmetry in non–right-handed typically developing individuals was less extensive and was localized to different cortical regions. In ADHD, the posterior component of this evolving asymmetry was intact, but the prefrontal component was lost.
Conclusions
These findings explain the way that, in typical development, the increased dimensions of the right frontal and left occipital cortical regions emerge in adulthood from the reversed pattern of childhood cortical asymmetries. Loss of the prefrontal component of this evolving asymmetry in ADHD is compatible with disruption of prefrontal function in the disorder and demonstrates the way that disruption of typical processes of asymmetry can inform our understanding of neurodevelopmental disorders.
Just as typical development of anatomical asymmetries in the human brain has been linked with the normal lateralization of motor and cognitive functions,1,2 disruption of asymmetry has been implicated in the pathogenesis of several neurodevelopmental disorders, such as autism, schizophrenia, and attention-deficit/ hyperactivity disorder (ADHD).3-5 The most consistently reported structural asymmetry in typically developing adults is a relative increase in the dimensions of the right frontal and left occipital lobes.6-10 Such adult structural asymmetries are classically thought to result from the action of torque, a rotational force, on the brain.11 This concept implies that adult asymmetries are the result of a dynamic developmental process, which is supported by demonstrations of different patterns of structural asymmetry in healthy children and infants. For example, one volumetric study4 of 46 children reported complete reversal of adult a symmetries (it found larger childhood left anteroinferior frontal cortical and right temporo-occiptal volumes), and others12-15 reported only a partial, but not yet complete, pattern of adult a symmetry. If asymmetry is, indeed, an evolving property of the childhood brain, such a dynamic phenomenon could be further understood using longitudinal neuroanatomical data. To date, to our knowledge, all studies have been cross sectional.
Variations in structural asymmetries have been linked with handedness. Most studies find increased asymmetries in right-handed individuals compared with those who are left-handed or ambidextrous (referred to henceforth as non–right-handed). This phenomenon has been most extensively examined for language areas because atypical (ie, nonleftward) hemispheric specialization for language occurs in approximately 30% of non–right-handed people but in fewer than 10% of right-handed individuals.16 The planum temporale and perhaps more anterior speech areas and the postcentral gyrus show less marked leftward asymmetry in non–right-handed individuals, particularly males.8-10,17-26 The differing asymmetries related to handedness may reflect the action of genes, resulting in a left-hemispheric bias with concomitant right-handedness.27-29 Individuals who lack this genetic effect have no such directional bias for cerebral dominance or handedness and may, thus, be right-handed, ambidextrous, or left-handed. Herein, we further ask whether the lack of a genetic effect for hemispheric bias in non–right-handed individuals translates to an attenuation of the dynamic forces sculpting typical cortical asymmetry. This would manifest as a decreased proportion of the cortex in non–right-handed individuals showing significant changes in asymmetry with age.
Alterations of these asymmetries might play a role in the pathogenesis of one of the most common neurodevelopmental disorders of childhood: ADHD.5 A loss of typical frontal asymmetry owing to right frontal volume loss is one of the more consistently replicated findings in cross-sectional neuroimaging studies in ADHD, and abnormal development of prefrontal lateralized processing has been implicated in the disorder.5,30-33 We can further these findings by incorporating longitudinal data and using recent methodologic advances in image analysis that afford the detection of cortical asymmetries with exquisite spatial resolution. We use a metric of cortical thickness measured at more than 80 000 points across the cerebrum that reflects the columnar architecture of the cortex and affords exquisite spatial resolution. We, thus, aim to delineate the typical pattern of development of cortical asymmetry and to test the hypothesis that disruption of this process, particularly of evolving frontal asymmetry, may be found in ADHD.
Methods
Participants
Three hundred fifty-eight healthy children and adolescents with no personal or family history of psychiatric or neurologic disorders had 730 magnetic resonance images (MRIs). These participants are part of the National Institute of Mental Health Intramural Program of typical brain development, on which previous reports34-36 have been made. Each participant completed the Childhood Behavior Checklist as a screening tool and then underwent a structured diagnostic interview by a child psychiatrist to rule out any psychiatric or neurologic diagnoses.12 Handedness was determined using the Physical and Neurological Examination for Soft Signs,37 in which right-handed individuals stated that they used the right hand for at least 10 of 12 everyday activities, left-handed individuals used the left hand for the same proportion of activities, and ambidextrous individuals occupied the intermediate ground. Of the 358 participants, 316 (88.3%) were predominantly right-handed, 22 (6.1%) were predominantly left-handed, and 20 (5.6%) were ambidextrous. Mean (SD) IQ was 114 (13), as determined using age-appropriate versions of the Wechsler intelligence scales. The proportion of males did not differ significantly by handedness (52% in the right-handed group and 57% in the non–right-handed group: χ2=0.46, P=.5). The age range was 3.2 to 21.8 years. The numbers of participants at each wave of MRI and their age are given in the Table.
Table. Numbers of Individuals in Each Group at Each Wave of MRI Acquisition, With Age and Sex.
| Typically Developing Group | ADHD Group | |||
|---|---|---|---|---|
| Right-handed | Non–Right-handed | Right-handed | Non–Right-handed | |
| MRI 1 | (n=316) | (n=42) | (n=192) | (n=26) |
| Age, mean (SD), y | 11.2 (3.9) | 11.6 (4.1) | 10.3 (3.1) | 9.6 (3.6) |
| Male sex, % | 52 | 57 | 62 | 69 |
| MRI 2 | (n=180) | (n=21) | (n=98) | (n=13) |
| Age, mean (SD), y | 13.1 (3.8) | 13.6 (3.7) | 12.9 (3.6) | 12.3 (3.6) |
| Male sex, % | 56 | 33 | 55 | 69 |
| MRI 3 | (n=96) | (n=8) | (n=51) | (n=8) |
| Age, mean (SD), y | 14.7 (3.7) | 16.3 (3.6) | 15.6 (3.8) | 13.5 (2.6) |
| Male sex, % | 61 | 25 | 57 | 75 |
| MRI ≥4 | (n=46) | (n=5) | (n=12) | (n=3) |
| Age, mean (SD), y | 17.7 (3.4) | 17.8 (2.4) | 17.7 (3.9) | 18.4 (1.9) |
| Male sex, % | 56 | 40 | 75 | 33 |
Abbreviations: ADHD, attention-deficit/hyperactivity disorder; MRI, magnetic resonance image.
Details of the ADHD cohort are given in previous articles.38-40 In brief, diagnosis was based on the Parent Diagnostic Interview for Children and Adolescents,41 the Conners' Teacher Rating Scale,42 and the Teacher Report Form. Of 218 children with ADHD, 201 (92.2%) had combined-type ADHD at base line, 12 (5.5%) had the inattentive subtype, and 5 (2.3%) had the hyperactive/impulsive subtype. Handedness was determined in the same manner as in typically developing participants. There were 192 right-handed individuals with ADHD with 353 MRIs; 119 (62.0%) were male. The numbers of participants at each wave of MRI and their ages are given in the Table. Most individuals on whom treatment data were available were medicated with psychostimulant drugs (at the time of the first MRI, 65%; the second, 64%; the third, 64%; and the fourth, 50%). At base line, methylphenidate preparations were most common (85%); amphetamine preparations constituted the remaining 15%. Of individuals entering the study taking medication, the mean (SD) age when starting psychostimulant drug use was 8.1 (2.3) years; the mean (SD) duration of treatment before study entry was 2.4 (1.6) years.
Neuroimaging
T1-weighted images with contiguous 1.5-mm axial slices and 2.0-mm coronal slices were obtained using 3-dimensional spoiled gradient–recalled echo in the steady state on a 1.5-T scanner (GE Signa; GE Medical Systems, Milwaukee, Wisconsin). Imaging parameters were echo time of 5 milliseconds, repetition time of 24 milliseconds, flip angle of 45°, acquisition matrix of 256 × 192, number of excitations equals 1, and 24-cm field of view. Head placement was standardized as previously described.30 The same scanner was used throughout the study. The images were processed using the cortical surface extraction pipeline CIVET.43 The native MRIs were first masked using the Brain Extraction Tool method,44 and then they were registered into standardized stereotaxic space (MNI-ICBM152 nonlinear 6th-generation symmetrical target45) using a 9-parameter linear transformation46 and corrected for nonuniformity artifacts.47 The registered and corrected volumes were segmented into white matter, gray matter, cerebrospinal fluid, and background using an advanced neural net classifier.48,49 The Constrained Laplacian Anatomic Segmentation Using Proximities surface extraction procedure was then used to generate surface meshes representing the white matter and gray matter interfaces.50 The root mean square thickness between corresponding nodes on the surface meshes was then calculated in native space.51 The thickness measurements were aligned using surface registration to maximize thickness value correspondence between participants in terms of gyral patterning.52,53 A 30-mm surface-blurring algorithm was used to reduce noise in the thickness measurements and to reduce the effective number of statistical comparisons being performed.54 This kernel allows anatomical localization because blurring along the surface using a diffusion-smoothing operator preserves cortical topologic features and represents considerably less cortex than does the equivalent volumetric gaussian blurring kernel.55 Validity of the technique used was established through its ability to extract accurately the cortical surfaces of a “phantom” brain and capture the neuropathologically established pattern of progression of cortical degeneration in Alzheimer disease.56,57 Quality control measures are detailed in the eMethods (http://archgenpsychiatry.com).
Asymmetry in cortical thickness was estimated using the difference between corresponding left- and right-hemispheric thickness at 40 962 corresponding points in each hemisphere. In addition, we calculated the asymmetry index as follows:
All the results are projected onto a symmetrical left-hemispheric template. A positive value of either asymmetry measure indicates that the left-hemispheric cortical point is relatively thicker than its right-hemispheric homologue, and a negative value indicates a right-hemispheric bias.
To determine the developmental trajectories of the asymmetry measures, mixed-model regression analysis was chosen because it permits the inclusion of multiple measurements per person, missing data, and irregular intervals between measurements, thereby increasing statistical power.58 A model including linear effects of age best fit the asymmetry data. A random effect for each individual was also included in the model to account for within-person dependence. Thus, the jth asymmetry measure of the ith individual was modeled as follows:
where di is the random-effect modeling within-person dependence, the intercept and β terms are fixed effects, and eij represents the residual error. In analyses with large participant numbers (the right-handed typically developing and right-handed ADHD groups), the resulting statistical maps were thresholded to control for multiple comparisons using the false discovery rate (FDR) procedure, with P=.05.59,60 In analyses with smaller group numbers (the non–right-handed typically developing and ADHD groups), an unadjusted P<.05 was adopted. Results were projected onto a symmetrical left-hemispheric template: a positive value indicates relative gain with age in left- over right-hemispheric cortical thickness; a negative value indicates relative gain with age in the right over the left hemisphere.
The initial analyses examined data from the right-handed typically developing cohort only. We then determined the effects of handedness by comparing the non–right-handed typically developing group with a right-handed group matched for number of MRIs, age, and sex (exact numbers in this contrast and age at MRI acquisition are given in eTable 1). Such matching ensures that any group differences in the trajectories of asymmetry measures are not owing to differences in data density or confounding demographic factors. Sex effects were examined by entering sex as an interacting factor into the data from the entire right-handed group only. There was insufficient data to examine higher-order interactions between sex and handedness in the trajectory analysis.
In examining diagnostic effects, the right-handed cohort of individuals with ADHD were compared with a right-handed group of typically developing individuals matched for number of MRIs, age, IQ, and sex (exact numbers of individuals and age at MRI acquisition in this contrast are given in eTable 2). There were too few non–right-handed individuals with ADHD to allow a detailed examination of the possibility of higher-order interactions among changing asymmetry, handedness, diagnosis, and sex.
Results
Typical Development
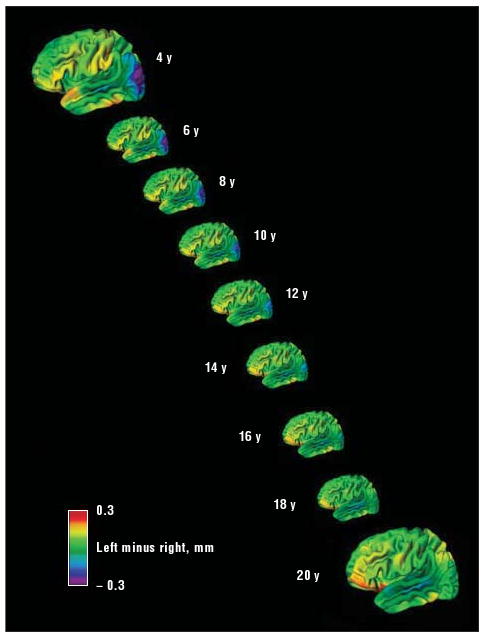
First, the trajectory of change in cortical thickness asymmetry (left- minus right-side cortical thickness) was examined in the right-handed typically developing group and is illustrated in Figure 1 and as a time-lapse sequence in a video (http://archgenpsychiatry.com). There was a significant decrease with age in the index of cortical asymmetry, indicating relative gain in right-hemispheric thickness across time in the lateral orbitofrontal cortex, extending to the inferior frontal gyrus and anterior insula (Figure 2 shows the extent and location of this region at an FDR-adjusted P<.05). Thus, in early childhood, the left orbitofrontal and inferior frontal gyrus was relatively thicker than the right, but by late adolescence, this result had reversed, and this anterior region was relatively thicker in the right hemisphere, resembling the well-established adult pattern of asymmetry. A similar increase with age in relative right-hemispheric thickness was found in the medial occipital region, extending superiorly to the medial aspect of the superior parietal lobule and motor cortex and inferiorly to the medial occipitotemporal junction. The reverse pattern, with a significant increase with age in cortical asymmetry, indicating relative gain in left-hemispheric thickness, was seen in the region centered on the middle occipital and angular gyri, extending from the posterior temporal cortex to the occipital pole. Thus, in childhood, this posterior region was thicker on the right, but by adulthood, the asymmetry had reversed to resemble established adult asymmetries and was relatively thicker on the left.
Figure 1.
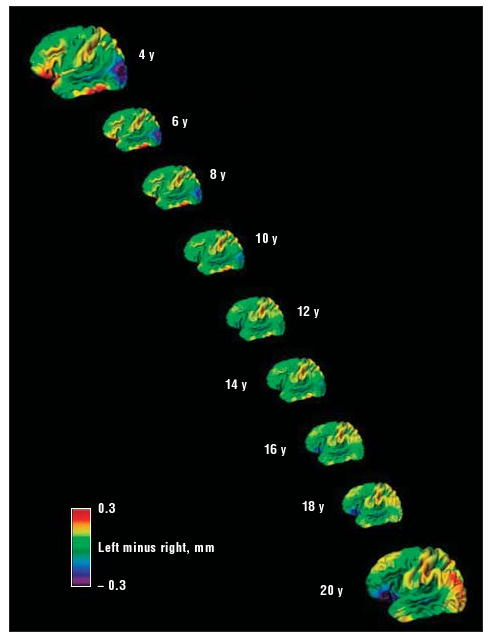
Differences between left and right cortical thickness at each age. Red and yellow areas indicate a thicker left cortex; blue and purple areas, a thicker right cortex. Note the changing asymmetries in the right orbitofrontal and inferior frontal regions and in the left posterior temporo-occipital cortex.
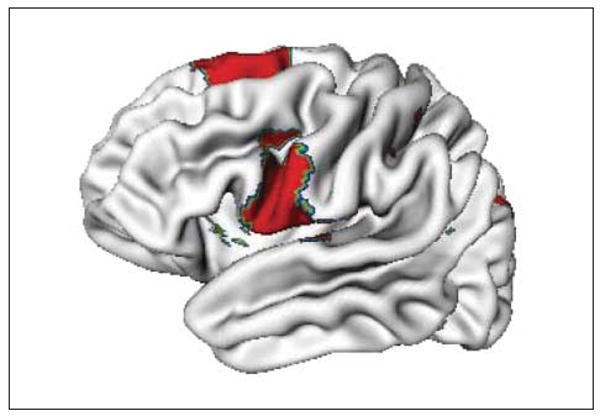
Figure 2.
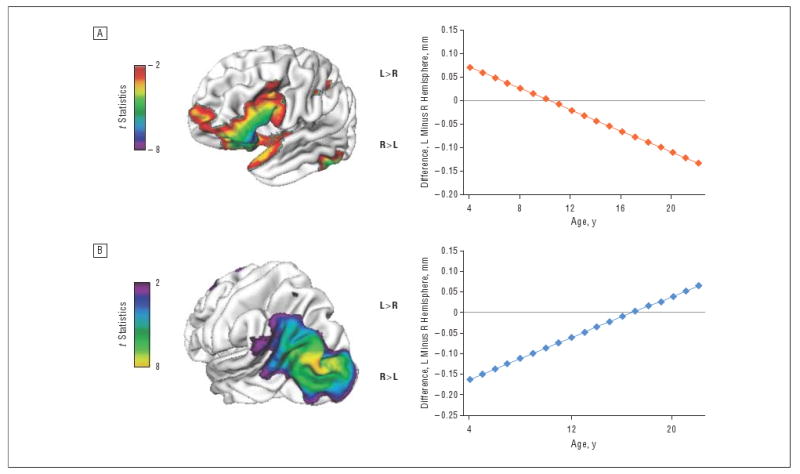
A, Regions with a significant (at false discovery rate–adjusted P<.05) increase in relative right-hemispheric thickness with age. B, Regions with an increase in relative left-hemispheric thickness with age. L indicates left; R, right.
The mean (SE) rate of relative gain in right-hemispheric thickness in the anterior orbitofrontal and inferior frontal region shown in Figure 2 was 0.011 (0.0018) mm per year (t337=6.2, P<.001); in the posterior temporo-occipital region, the rate of relative gain in left-hemispheric thickness was 0.013 (0.0016) mm per year (t337=8.1, P<.001). This pattern of results held when the asymmetry index, rather than the absolute difference in thickness, was used.
Effects of Handedness and Sex in Typical Development
No cortical region in the non–right-handed typically developing group showed significantly changing cortical asymmetry when adjustment was made for multiple comparisons. However, given the small numbers in this group, we also report the results at a nominal P<.05. Compared with a group of right-handed healthy peers matched for number of MRIs, sex, and age, there were group differences in the extent and location of regions that showed significant age-related change in asymmetry (Figure 3). The matched right-handed group showed age-related change in asymmetry in 13.1% of all cortical points compared with 6.3% for the non–right-handed group. The handedness groups differed in the location of cortical regions that showed change in asymmetry with age. The non–right-handed group showed significant age-related relative gain in right-hemispheric thickness in the middle temporal gyrus (unlike the orbito-inferior frontal gyrus of the right-handed group). The regions that showed relative gain in left-hemispheric thickness also differed, being more circumscribed and centered on the angular gyrus in the non–right-handed group. In addition, there was a region in the inferior portion of the precentral and post-central gyri in the non–right-handed group, that showed relative increase in the left hemisphere (this region did not show any such change in the right-handed group).
Figure 3.
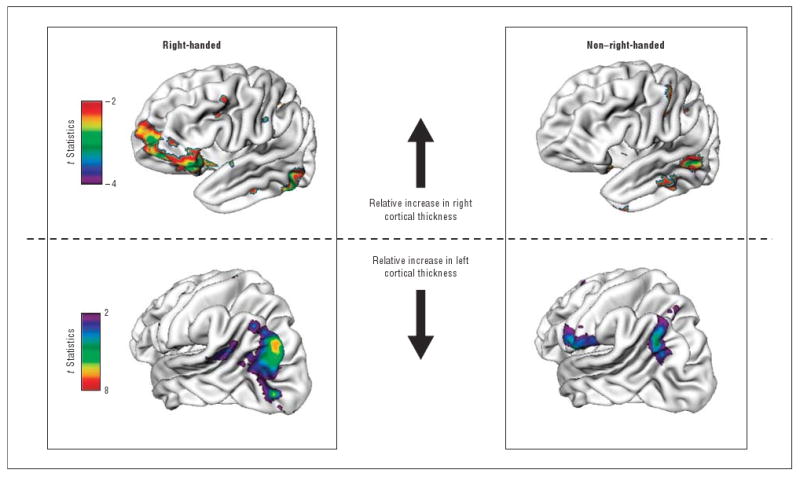
Comparison of regions with significantly (P<.05) changing asymmetry with age in right-handed and non–right-handed typically developing individuals. The groups were strictly matched, which explains the lesser extent of the changing asymmetry with age in the right-handed typically developing cohort compared with the entire right-handed group shown in Figure 2.
Significant sex differences were found in change in asymmetry across time in the right-handed typically developing cohort when a correction for multiple comparisons was made (FDR-adjusted P<.05). This localized to the superior temporal gyrus, where males had a rate of changing asymmetry of 0.0003 mm per year, indicative of relative (but minimal) left-hemispheric gain, whereas females had a rate of -0.013 mm per year, indicative of relative right-hemispheric gain (sex difference: t336=5.8, P<.001) (Figure 4). At a nominal P<.05, sex interacted with changing asymmetry in the lateral postcentral gyrus, where males had a mean rate of change in asymmetry of −0.006 mm per year, indicating relative right-hemispheric gain, and females had a changing asymmetry rate of 0.007 mm per year, indicating relative left-hemispheric gain (t336=4.9, P<.001). These areas did not overlap with the regions showing a main effect of age on asymmetry (ie, the regions with significantly changing asymmetry with age shown in the entire right-handed cohort [Figure 2]).
Figure 4.
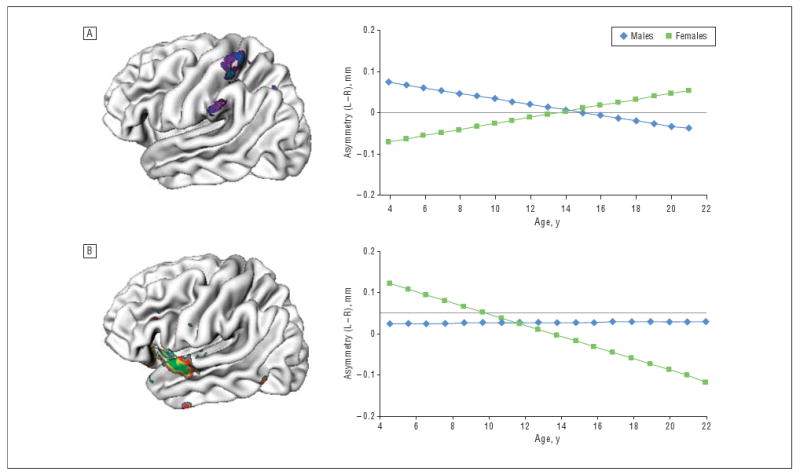
Regions where there was a significant interaction of sex with changing asymmetry. A, Regions where males had a greater decrease with age in asymmetry (left [L] minus right [R]), indicating relative right-hemispheric gain; females showed the opposite pattern of an increase with age in asymmetry, indicative of a relative left-hemispheric gain. B, Superior temporal region where the reverse pattern occurred.
ADHD
The right-handed ADHD cohort showed significant (FDR-adjusted P<.05) increasing asymmetry with age (indicating left-hemispheric gain in relative cortical thickness with age) in a similar posterior temporo-occipital region as the typically developing group (Figure 5). However, unlike typically developing individuals, the ADHD group showed no opposing tendency of increasing relative right-hemispheric thickness in the frontal cortex. Instead, there was a small region in the anterior superior temporal gyrus that showed this increase in relative right-hemispheric thickness with age. Thus, the right-handed ADHD group showed typical posterior but atypical anterior evolving asymmetry. Definitive conclusions cannot be made about non–right-handed individuals with ADHD due to the small sample size. With this caveat, it is noted that this non–right-handed ADHD group showed an atypical rightward temporal asymmetry with age like their right-handed ADHD peers (eFigure).
Figure 5.
Differences between left and right cortical thickness at each age for the right-handed attention-deficit/hyperactivity disorder cohort. Red and yellow areas indicate a thicker left cortex; blue and purple areas, a thicker right cortex. Note the essential absence of changing asymmetries in the right orbitofrontal and inferior frontal regions. The left posterior temporo-occipital cortex shows a similar pattern of changing asymmetry with age as in the typically developing group.
In the comparison of the ADHD and typically developing controls, the proportions of males did not differ. In addition, there was no significant interaction between changing asymmetry, diagnostic group, and sex and, thus, no evidence of diagnostically specific effects of sex on changing asymmetry.
There were too few participants who remained unmedicated with psychostimulants throughout the entire study to allow examination of the longitudinal effects of medication status. However, a comparison of cortical asymmetry in individuals with ADHD either treated or untreated with psychostimulant drugs at study entry showed that the groups differed in asymmetry in the posterior superior frontal gyrus and the inferior precentral gyrus (Figure 6). In these regions, the medicated group showed a slight rightward bias (right hemisphere was a mean [SE] of 0.06 (0.01) mm thicker than the homologous area on the left), whereas the unmedicated group had a slight leftward bias (left cortex was a mean [SD] of 0.1 [0.02] mm thicker than the right). This medication effect did not survive adjustment for multiple comparisons, and the region lay outside the cortical regions that showed significant changing asymmetry in the ADHD group as a whole (Figure 5).
Figure 6.
Regions where asymmetry at study entry differed between individuals with attention-deficit/hyperactivity disorder treated vs not treated with psychostimulant drugs. Results are shown at an unadjusted P<.05; the group difference did not survive correction for multiple comparisons.
Comment
Asymmetry emerges as a dynamic cortical process: a relative increase in right prefrontal cortical thickness with age is balanced against a relative gain in the left occipital cortex. The results partly explain how the adult right prefrontal and left occipital biases arise from the infantile pattern of cortical asymmetries, where hemispheric biases have been found to be essentially reversed4 or to only partially resemble adult asymmetry.12,13,15 The similar rates of changing asymmetry in the anterior and posterior regions is congruent with the high correlation found in a cross-sectional adult study between right frontal and left occipital cortical expansion using a deformation-based morphometric approach.61
The findings relate to a change in relative thickness of the right and left hemispheres: our earlier work35,62 and that of others63-65 has shown that the cortex becomes thinner bilaterally throughout most of late childhood and adolescence. Herein, we demonstrate that the rate of this thinning differs by hemisphere: there is more rapid cortical thinning in the left hemisphere in the prefrontal regions (resulting in a relatively thicker right prefrontal cortex), with the reverse pattern in posterior regions. Some studies suggest that more rapid thinning is associated with the acquisition of cognitive skills63,66 and is a characteristic of cortical change in children with higher general intelligence.36 Thus, more rapid thinning in the left ventrolateral prefrontal cortex may support the refinement during adolescence of cognitive skills supported by this region.67 However, others have argued that an increase with age in right inferior frontal activation is characteristic of the development of key cognitive skills68 (including cognitive control), illustrating the complexity of forging links between structure and function. The salience of the right inferior frontal gyrus in response inhibition is demonstrated by deficits in this key cognitive skill in adults who have lesions of this area, and, notably, similar deficits are found in those with ADHD.60,69,70 It is also not clear what, if any, psychological processes supported by the posterior parietal and occipital cortex would show a similar age-related shift in lateralized cortical activity. We can equally only speculate about the evolutionary significance of the findings. It is unknown whether this age-related shift in asymmetry is more prominent in humans than in other species or, indeed, whether shifting asymmetry is a uniquely human feature.71 Perhaps the changing asymmetries in most humans might reflect a plastic cortical substrate that could be advantageous in adaptation to early central nervous system insults.
Cortical asymmetries have been delineated using lobar, sublobar, and voxel-level estimates of cortical volumes, gray matter density, and cortical shape and thickness. We can, thus, compare the patterns of childhood and young adult asymmetry from this study, represented by the initial (age 4 years) and final (age 21 years) “stills” in Figure 1 against a wealth of data. The pattern of young adult cortical asymmetry resembles the picture reported in the only other cortical thickness study,25 particularly in the location of relatively thicker right anterior cortex. Like wise, rightward prefrontal and leftward occipital cortical surface expansion, defined in terms of distance from a central point in the brain, have been reported and overlap with the regions showing increased cortical thickness by adulthood in the present study.17 Resultsofvoxel-based morphometric studies9,10 are also consistent, although they report more extensive asymmetries, particularly right-hemispheric asymmetry, which extends from the prefrontal to the temporoparietal regions. Left-hemispheric asymmetry is frequently reported in posterior language areas,9,20-22 and the left posterior superior temporal gyrus is thicker in young adults in the present cohort (although the most pronounced asymmetry is centered on the angular gyrus and immediately posterior to the Wernicke area). We did not find a similar left-hemispheric bias in the anterior speech areas, congruent with some studies using metrics of cortical thickness,25 shape,17 and volume10 but not others.23,24 Asymmetries of the motor cortex that occur below the resolution capacity of conventional MRI are reported,72 as are some gross asymmetries,73 although we did not confirm these.
As mentioned earlier, the infantile and childhood pattern of asymmetry is either essentially reversed4 or lacks the right prefrontal13-15 or left occipital bias.12,14 Comparison with the “childhood” picture of asymmetry (Figure 1) confirms this reversed pattern of adult asymmetries, with relatively thicker right occipital and left or-bito-inferior prefrontal regions.
Effects of Handedness and Sex
Less of the cortex in non–right-handed typically developing participants shows age-related change in asymmetry, a result that is compatible with those of adult studies, including one that used cortical thickness, which generally find reduced left occipital6,8 or right prefrontal74 asymmetry in non–right-handed individuals.9 In the present study, this finding cannot be attributed to differences in group sizes or demographic differences between the right-handed and non–right-handed groups because groups were matched for number of MRIs, age, and sex. The findings are compatible with the absence or silencing of genes in non–right-handed individuals driving hemispheric asymmetries and lateralization of function. Some progress has already been made in identifying such genes.28,29,75 For example, the Lim domain only 4 gene (LMO4) is differentially expressed in the right and left hemisphere at different stages of human fetal development.76 The identification of such asymmetrically expressed genes and the other mechanisms driving asymmetry may give insights into not only the processes of typical lateralization but also the consequences of its disruption.
Some, but not all,10,17 adult studies find males to have more leftward hemispheric asymmetry,8,18 especially around the planum temporal9,19 and perhaps the postcentral gyrus.73,77 This finding is congruent with the regions showing an increased leftward bias with age in males but not with the present finding of increased postcentral gyrus leftward bias in females.
Attention-Deficit/Hyperactivity Disorder
We can only speculate about the functional significance of the disrupted evolution of typical asymmetry in the orbito-inferior frontal gyral region. In one of the few functional studies to examine directly anomalous lateralization of activation in ADHD,33 single-photon emission computed tomography demonstrated decreased right and increased left dorsolateral prefrontal cortical perfusion during response inhibition in individuals with clinically severe ADHD compared with those with mild ADHD, suggesting that anomalous prefrontal lateralization may characterize the disorder. Disrupted development of prefrontal asymmetry might contribute to the consistent findings of anomalous prefrontal activation in the disorder during tasks of cognitive control.32,78 The dimensions of the right inferior frontal gyrus in ADHD may also change during development: whereas reduced volume is reported in childhood ADHD, one study79 noted an increase in volume in adolescents with the disorder.
We recently reported evidence of delayed cortical maturation in frontotemporal regions in the same cohort of children with ADHD as measured by a later age of attaining peak cortical thickness (representing the point at which childhood increase gives way to adolescent decrease in cortical thickness).38 The anomalous evolving prefrontal cortical asymmetry in ADHD nestles with in this overall delay of cortical maturation of both hemispheres in the disorder.
Limitations
This reflection-based approach relies on identification of the interhemispheric asymmetry plane, and artifacts can arise where the falx curves, as in the occipital pole.80 This affects mainly the posteromedial cortical wall, where cortical thickness asymmetry findings must be interpreted with caution, but spares the lateral cortical surfaces, where the most prominent findings lie. Possible errors arising from the lack of total homology in cortical surfaces such as the planum temporale21 are attenuated by the use of spatial surface smoothing, which diminishes the effects of small regional shape differences.
Nearly all of the participants were treated with psychostimulants at some stage during the study, and, thus, it was not possible to longitudinally compar emedicated and unmedicated ADHD groups. We note, however, that at study entry, individuals with ADHD divided by medication status differed little in the pattern of cortical asymmetry, and the regions showing possible medication effects lay outside the regions that demonstrate changing asymmetry with age. In addition, we recently reported that during adolescence, when a higher proportion of individuals were unmedicated, psychostimulant drug treatment was associated with highly regional differences in cortical change confined to the left dorsolateral and right medial precentral gyrus regions, which do not show significant change in asymmetry with age.81 Nonetheless, in the present observational study, we cannot exclude the possibility that psychostimulants or, indeed, nonpharmacologic interventions do not affect the pattern of changing asymmetry in ADHD.
We demonstrate a “flip” in cortical asymmetries during typical development: a relatively thicker left anterior and right posterior cortex in childhood develops into the well-established adult asymmetries of a thicker right anterior and left posterior cortex. Disruptions of this process cast light on the pathogenesis of neurodevelopmental disorders.
Supplementary Material
Acknowledgments
Funding/Support: This study was funded by the Intramural Program of the National Institute of Mental Health.
Footnotes
Author Contributions: Drs Shaw, Greenstein, Giedd, and Rapoport had full access to all the data in the study and take responsibility for the integrity of the data and the accuracy of the data analysis.
Financial Disclosure: None reported.
Additional Information: A video and the eFigure, eTables, and eMethods text are available at http://archgenpsychiatry.com.
References
- 1.Toga AW, Thompson PM. Mapping brain asymmetry. Nat Rev Neurosci. 2003;4(1):37–48. doi: 10.1038/nrn1009. [DOI] [PubMed] [Google Scholar]
- 2.Galaburda AM, LeMay M, Kemper TL, Geschwind N. Right-left asymmetrics in the brain. Science. 1978;199(4331):852–856. doi: 10.1126/science.341314. [DOI] [PubMed] [Google Scholar]
- 3.Crow TJ. Schizophrenia as failure of hemispheric dominance for language. Trends Neurosci. 1997;20(8):339–343. doi: 10.1016/s0166-2236(97)01071-0. [DOI] [PubMed] [Google Scholar]
- 4.Herbert MR, Ziegler DA, Deutsch CK, O'Brien LM, Kennedy DN, Filipek PA, Bakard-jiev AI, Hodgson J, Takeoka M, Makris N, Caviness VS., Jr Brain asymmetries in autism and developmental language disorder: a nested whole-brain analysis. Brain. 2005;128(pt 1):213–226. doi: 10.1093/brain/awh330. [DOI] [PubMed] [Google Scholar]
- 5.Rubia K, Overmeyer S, Taylor E, Brammer M, Williams SC, Simmons A, Andrew C, Bullmore ET. Functional frontalisation with age: mapping neurodevelopmental trajectories with fMRI. Neurosci Biobehav Rev. 2000;24(1):13–19. doi: 10.1016/s0149-7634(99)00055-x. [DOI] [PubMed] [Google Scholar]
- 6.Le May M, Kido DK. Asymmetries of the cerebral hemispheres on computed tomograms. J Comput Assist Tomogr. 1978;2(4):471–476. doi: 10.1097/00004728-197809000-00018. [DOI] [PubMed] [Google Scholar]
- 7.Bilder RM, Wu H, Bogerts B, Degreef G, Ashtari M, Alvir JM, Snyder PJ, Lieberman JA. Absence of regional hemispheric volume asymmetries in first-episode schizophrenia. Am J Psychiatry. 1994;151(10):1437–1447. doi: 10.1176/ajp.151.10.1437. [DOI] [PubMed] [Google Scholar]
- 8.Bear D, Schiff D, Saver J, Greenberg M, Freeman R. Quantitative analysis of cerebral asymmetries: fronto-occipital correlation, sexual dimorphism, and association with handedness. Arch Neurol. 1986;43(6):598–603. doi: 10.1001/archneur.1986.00520060060019. [DOI] [PubMed] [Google Scholar]
- 9.Good CD, Johnsrude IS, Ashburner J, Henson RN, Friston KJ, Frackowiak RS. A voxel-based morphometric study of ageing in 465 normal adult human brains. Neuroimage. 2001;14(1, pt 1):21–36. doi: 10.1006/nimg.2001.0786. [DOI] [PubMed] [Google Scholar]
- 10.Watkins KE, Paus T, Lerch JP, Zijdenbos A, Collins DL, Neelin P, Taylor J, Worsley KJ, Evans AC. Structural asymmetries in the human brain: a voxel-based statistical analysis of 142 MRI scans. Cereb Cortex. 2001;11(9):868–877. doi: 10.1093/cercor/11.9.868. [DOI] [PubMed] [Google Scholar]
- 11.LeMay M. Morphological cerebral asymmetries of modern man, fossil man, and nonhuman primate. Ann N Y Acad Sci. 1976;280:349–366. doi: 10.1111/j.1749-6632.1976.tb25499.x. [DOI] [PubMed] [Google Scholar]
- 12.Giedd JN, Snell JW, Lange N, Rajapakse JC, Casey BJ, Kozuch PL, Vaituzis AC, Vauss YC, Hamburger SD, Kaysen D, Rapoport JL. Quantitative magnetic resonance imaging of human brain development: ages 4-18. Cereb Cortex. 1996;6(4):551–560. doi: 10.1093/cercor/6.4.551. [DOI] [PubMed] [Google Scholar]
- 13.Reiss AL, Abrams MT, Singer HS, Ross JL, Denckla MB. Brain development, gender and IQ in children: a volumetric imaging study. Brain. 1996;119(pt 5):1763–1774. doi: 10.1093/brain/119.5.1763. [DOI] [PubMed] [Google Scholar]
- 14.Matsuzawa J, Matsui M, Konishi T, Noguchi K, Gur RC, Bilker W, Miyawaki T. Age-related volumetric changes of brain gray and white matter in healthy infants and children. Cereb Cortex. 2001;11(4):335–342. doi: 10.1093/cercor/11.4.335. [DOI] [PubMed] [Google Scholar]
- 15.Gilmore JH, Lin W, Prastawa MW, Looney CB, Vetsa YSK, Knickmeyer RC, Evans DD, Smith JK, Hamer RM, Lieberman JA, Gerig G. Regional gray matter growth, sexual dimorphism, and cerebral asymmetry in the neonatal brain. J Neurosci. 2007;27(6):1255–1260. doi: 10.1523/JNEUROSCI.3339-06.2007. [DOI] [PMC free article] [PubMed] [Google Scholar]
- 16.Woods RP, Dodrill CB, Ojemann GA. Brain injury, handedness, and speech lateralization in a series of amobarbital studies. Ann Neurol. 1988;23(5):510–518. doi: 10.1002/ana.410230514. [DOI] [PubMed] [Google Scholar]
- 17.Narr KL, Bilder RM, Luders E, Thompson PM, Woods RP, Robinson D, Szeszko PR, Dimtcheva T, Gurbani M, Toga AW. Asymmetries of cortical shape: effects of handedness, sex and schizophrenia. Neuroimage. 2007;34(3):939–948. doi: 10.1016/j.neuroimage.2006.08.052. [DOI] [PMC free article] [PubMed] [Google Scholar]
- 18.Gur RC, Turetsky BI, Matsui M, Yan M, Bilker W, Hughett P, Gur RE. Sex differences in brain gray and white matter in healthy young adults: correlations with cognitive performance. J Neurosci. 1999;19(10):4065–4072. doi: 10.1523/JNEUROSCI.19-10-04065.1999. [DOI] [PMC free article] [PubMed] [Google Scholar]
- 19.Shapleske J, Rossell SL, Woodruff PW, David AS. The planum temporale: a systematic, quantitative review of its structural, functional and clinical significance. Brain Res Brain Res Rev. 1999;29(1):26–49. doi: 10.1016/s0165-0173(98)00047-2. [DOI] [PubMed] [Google Scholar]
- 20.Barrick TR, Mackay CE, Prima S, Maes F, Vandermeulen D, Crow TJ, Roberts N. Automatic analysis of cerebral asymmetry: an exploratory study of the relationship between brain torque and planum temporale asymmetry. Neuroimage. 2005;24(3):678–691. doi: 10.1016/j.neuroimage.2004.09.003. [DOI] [PubMed] [Google Scholar]
- 21.Geschwind N, Levitsky W. Human brain: left-right asymmetries in temporal speech region. Science. 1968;161(837):186–187. doi: 10.1126/science.161.3837.186. [DOI] [PubMed] [Google Scholar]
- 22.Steinmetz H. Structure, functional and cerebral asymmetry: in vivo morphometry of the planum temporale. Neurosci Biobehav Rev. 1996;20(4):587–591. doi: 10.1016/0149-7634(95)00071-2. [DOI] [PubMed] [Google Scholar]
- 23.Foundas AL, Eure KF, Luevano LF, Weinberger DR. MRI asymmetries of Broca's area: the pars triangularis and pars opercularis. Brain Lang. 1998;64(3):282–296. doi: 10.1006/brln.1998.1974. [DOI] [PubMed] [Google Scholar]
- 24.Falzi G, Perrone P, Vignolo LA. Right-left asymmetry in anterior speech region. Arch Neurol. 1982;39(4):239–240. doi: 10.1001/archneur.1982.00510160045009. [DOI] [PubMed] [Google Scholar]
- 25.Luders E, Narr KL, Thompson PM, Rex DE, Jancke L, Toga AW. Hemispheric asymmetries in cortical thickness. Cereb Cortex. 2006;16(8):1232–1238. doi: 10.1093/cercor/bhj064. [DOI] [PubMed] [Google Scholar]
- 26.Amunts K, Schlaug G, Schleicher A, Steinmetz H, Dabringhaus A, Roland PE, Zilles K. Asymmetry in the human motor cortex and handedness. Neuroimage. 1996;4(3, pt 1):216–222. doi: 10.1006/nimg.1996.0073. [DOI] [PubMed] [Google Scholar]
- 27.McManus IC, Bryden MP. Geschwind's theory of cerberal lateralization: developing a formal, causal model. Psychol Bull. 1991;110(2):237–253. doi: 10.1037/0033-2909.110.2.237. [DOI] [PubMed] [Google Scholar]
- 28.Geschwind DH, Miller BL, DeCarli C, Carmelli D. Heritability of lobar brain volumes in twins supports genetic models of cerebral laterality and handedness. Proc Natl Acad Sci U S A. 2002;99(5):3176–3181. doi: 10.1073/pnas.052494999. [DOI] [PMC free article] [PubMed] [Google Scholar]
- 29.Annett M. Handedness in the children of two left-handed parents. Br J Psychol. 1974;65(1):129–131. doi: 10.1111/j.2044-8295.1974.tb02778.x. [DOI] [PubMed] [Google Scholar]
- 30.Castellanos FX, Giedd JN, Marsh WL, Hamburger SD, Vaituzis AC, Dickstein DP, Sarfatti SE, Vauss YC, Snell JW, Lange N, Kaysen D, Krain AL, Ritchie GF, Rajapakse JC, Rapoport JL. Quantitative brain magnetic resonance imaging in attention-deficit hyperactivity disorder. Arch Gen Psychiatry. 1996;53(7):607–616. doi: 10.1001/archpsyc.1996.01830070053009. [DOI] [PubMed] [Google Scholar]
- 31.Filipek PA, Semrud-Clikeman M, Steingard RJ, Renshaw PF, Kennedy DN, Biederman J. Volumetric MRI analysis comparing subjects having attention-deficit hyperactivity disorder with normal controls. Neurology. 1997;48(3):589–601. doi: 10.1212/wnl.48.3.589. [DOI] [PubMed] [Google Scholar]
- 32.Rubia K, Smith AB, Brammer MJ, Toone B, Taylor E. Abnormal brain activation during inhibition and error detection in medication-naive adolescents with ADHD. Am J Psychiatry. 2005;162(6):1067–1075. doi: 10.1176/appi.ajp.162.6.1067. [DOI] [PubMed] [Google Scholar]
- 33.Langleben DD, Austin G, Krikorian G, Ridlehuber HW, Goris ML, Strauss HW. Interhemispheric asymmetry of regional cerebral blood flow in prepubescent boys with attention deficit hyperactivity disorder. Nucl Med Commun. 2001;22(12):1333–1340. doi: 10.1097/00006231-200112000-00009. [DOI] [PubMed] [Google Scholar]
- 34.Shaw P, Lerch JP, Pruessner JC, Taylor KN, Rose AB, Greenstein D, Clasen L, Evans A, Rapoport JL, Giedd JN. Cortical morphology in children and adolescents with different apolipoprotein E gene polymorphisms: an observational study. Lancet Neurol. 2007;6(6):494–500. doi: 10.1016/S1474-4422(07)70106-0. [DOI] [PubMed] [Google Scholar]
- 35.Giedd JN, Blumenthal J, Jeffries NO, Castellanos FX, Liu H, Zijdenbos A, Paus T, Evans AC, Rapoport JL. Brain development during childhood and adolescence: a longitudinal MRI study. Nat Neurosci. 1999;2(10):861–863. doi: 10.1038/13158. [DOI] [PubMed] [Google Scholar]
- 36.Shaw P, Greenstein D, Lerch J, Clasen L, Lenroot R, Gogtay N, Evans A, Rapoport J, Giedd J. Intellectual ability and cortical development in children and adolescents. Nature. 2006;440(7084):676–679. doi: 10.1038/nature04513. [DOI] [PubMed] [Google Scholar]
- 37.Denckla MB. Revised neurological examination for subtle signs. Psychopharmacol Bull. 1985;21(4):773–800. [PubMed] [Google Scholar]
- 38.Shaw P, Eckstrand K, Sharp W, Blumenthal J, Lerch JP, Greenstein D, Clasen L, Evans A, Giedd J, Rapoport JL. Attention-deficit/hyperactivity disorder is characterized by a delay in cortical maturation. Proc Natl Acad Sci U S A. 2007;104(49):19649–19654. doi: 10.1073/pnas.0707741104. [DOI] [PMC free article] [PubMed] [Google Scholar]
- 39.Shaw P, Lerch J, Greenstein D, Sharp W, Clasen L, Evans A, Giedd J, Castellanos FX, Rapoport J. Longitudinal mapping of cortical thickness and clinical outcome in children and adolescents with attention-deficit /hyperactivity disorder. Arch Gen Psychiatry. 2006;63(5):540–549. doi: 10.1001/archpsyc.63.5.540. [DOI] [PubMed] [Google Scholar]
- 40.Castellanos FX, Lee PP, Sharp W, Jeffries NO, Greenstein DK, Clasen LS, Blumenthal JD, James RS, Ebens CL, Walter JM, Zijdenbos A, Evans AC, Giedd JN, Rapoport JL. Developmental trajectories of brain volume abnormalities in children and adolescents with attention-deficit /hyperactivity disorder. JAMA. 2002;288(14):1740–1748. doi: 10.1001/jama.288.14.1740. [DOI] [PubMed] [Google Scholar]
- 41.Reich W. Diagnostic Interview for Children and Adolescents (DICA) J Am Acad Child Adolesc Psychiatry. 2000;39(1):59–66. doi: 10.1097/00004583-200001000-00017. [DOI] [PubMed] [Google Scholar]
- 42.Werry JS, Sprague RL, Cohen MN. Conners' Teacher Rating Scale for use in drug studies with children: an empirical study. J Abnorm Child Psychol. 1975;3(3):217–229. doi: 10.1007/BF00916752. [DOI] [PubMed] [Google Scholar]
- 43.Ad-Dab'bagh Y. The CIVET image-processing environment: a fully automated comprehensive pipeline for anatomical neuroimaging research. Paper presented at: 12th Annual Meeting of the Organization for Human Brain Mapping; Florence, Italy. Jun 15, 2006. [Google Scholar]
- 44.Smith SM. Fast robust automated brain extraction. Hum Brain Mapp. 2002;17(3):143–155. doi: 10.1002/hbm.10062. [DOI] [PMC free article] [PubMed] [Google Scholar]
- 45.Grabner G, Janke AL, Budge MM, Smith D, Pruessner J, Collins DL. Symmetric atlasing and model based segmentation: an application to the hippocampus in older adults. Med Image Comput Comput Assist Interv Int Conf Med Image Comput Comput Assist Interv. 2006;9(pt 2):58–66. doi: 10.1007/11866763_8. [DOI] [PubMed] [Google Scholar]
- 46.Collins DL, Neelin P, Peters TM, Evans AC. Automatic 3D intersubject registration of MR volumetric data in standardized Talairach space. J Comput Assist Tomogr. 1994;18(2):192–205. [PubMed] [Google Scholar]
- 47.Sled JG, Zijdenbos AP, Evans AC. A nonparametric method for automatic correction of intensity nonuniformity in MRI data. IEEE Trans Med Imaging. 1998;17(1):87–97. doi: 10.1109/42.668698. [DOI] [PubMed] [Google Scholar]
- 48.Zijdenbos AP, Forghani R, Evans AC. Automatic “pipeline” analysis of 3-D MRI data for clinical trials: application to multiple sclerosis. IEEE Trans Med Imaging. 2002;21(10):1280–1291. doi: 10.1109/TMI.2002.806283. [DOI] [PubMed] [Google Scholar]
- 49.Tohka J, Zijdenbos A, Evans A. Fast and robust parameter estimation for statistical partial volume models in brain MRI. Neuroimage. 2004;23(1):84–97. doi: 10.1016/j.neuroimage.2004.05.007. [DOI] [PubMed] [Google Scholar]
- 50.Kim JS, Singh V, Lee JK, Lerch J, Ad-Dab'bagh Y, MacDonald D, Lee JM, Kim SI, Evans AC. Automated 3-D extraction and evaluation of the inner and outer cortical surfaces using a Laplacian map and partial volume effect classification. Neuroimage. 2005;27(1):210–221. doi: 10.1016/j.neuroimage.2005.03.036. [DOI] [PubMed] [Google Scholar]
- 51.MacDonald D, Kabani N, Avis D, Evans AC. Automated 3-D extraction of inner and outer surfaces of cerebral cortex from MRI. Neuroimage. 2000;12(3):340–356. doi: 10.1006/nimg.1999.0534. [DOI] [PubMed] [Google Scholar]
- 52.Robbins S, Evans AC, Collins DL, Whitesides S. Tuning and comparing spatial normalization methods. Med Image Anal. 2004;8(3):311–323. doi: 10.1016/j.media.2004.06.009. [DOI] [PubMed] [Google Scholar]
- 53.Lyttelton O, Boucher M, Robbins S, Evans A. An unbiased iterative group registration template for cortical surface analysis. Neuroimage. 2007;34(4):1535–1544. doi: 10.1016/j.neuroimage.2006.10.041. [DOI] [PubMed] [Google Scholar]
- 54.Chung MK, Worsley KJ, Robbins S, Paus T, Taylor J, Giedd JN, Rapoport JL, Evans AC. Deformation-based surface morphometry applied to gray matter deformation. Neuroimage. 2003;18(2):198–213. doi: 10.1016/s1053-8119(02)00017-4. [DOI] [PubMed] [Google Scholar]
- 55.Lerch JP, Evans AC. Cortical thickness analysis examined through power analysis and a population simulation. Neuroimage. 2005;24(1):163–173. doi: 10.1016/j.neuroimage.2004.07.045. [DOI] [PubMed] [Google Scholar]
- 56.Lee JK, Lee JM, Kim JS, Kim IY, Evans AC, Kim SI. A novel quantitative cross-validation of different cortical surface reconstruction algorithms using MRI phantom. Neuroimage. 2006;31(2):572–584. doi: 10.1016/j.neuroimage.2005.12.044. [DOI] [PubMed] [Google Scholar]
- 57.Singh V, Chertkow H, Lerch JP, Evans AC, Dorr AE, Kabani NJ. Spatial patterns of cortical thinning in mild cognitive impairment and Alzheimer's disease. Brain. 2006;129(pt 11):2885–2893. doi: 10.1093/brain/awl256. [DOI] [PubMed] [Google Scholar]
- 58.Pinheiro JC, Bates DM. Mixed-Effects Models in S and S-PLUS. New York, NY: Springer Publishing Company; 2000. [Google Scholar]
- 59.Genovese CR, Lazar NA, Nichols T. Thresholding of statistical maps in functional neuroimaging using the false discovery rate. Neuroimage. 2002;15(4):870–878. doi: 10.1006/nimg.2001.1037. [DOI] [PubMed] [Google Scholar]
- 60.Benjamini Y, Hochberg Y. Controlling the false discovery rate: a practical and powerful approach to multiple testing. J Roy Statist Soc B. 1995;57(1):289–300. [Google Scholar]
- 61.Lancaster JL, Kochunov PV, Thompson PM, Toga AW, Fox PT. Asymmetry of the brain surface from deformation field analysis. Hum Brain Mapp. 2003;19(2):79–89. doi: 10.1002/hbm.10105. [DOI] [PMC free article] [PubMed] [Google Scholar]
- 62.Gogtay N, Giedd JN, Lusk L, Hayashi KM, Greenstein D, Vaituzis AC, Nugent TF, III, Herman DH, Clasen LS, Toga AW, Rapoport JL, Thompson PM. Dynamic mapping of human cortical development during childhood through early adulthood. Proc Natl Acad Sci U S A. 2004;101(21):8174–8179. doi: 10.1073/pnas.0402680101. [DOI] [PMC free article] [PubMed] [Google Scholar]
- 63.Lu L, Leonard CM, Thompson PM, Kan E, Jolley J, Welcome SE, Toga AW, Sowell ER. Normal developmental changes in inferior frontal gray matter are associated with improvement in phonological processing: a longitudinal MRI analysis. Cereb Cortex. 2007;17(5):1092–1099. doi: 10.1093/cercor/bhl019. [DOI] [PubMed] [Google Scholar]
- 64.O'Donnell S, Noseworthy MD, Levine B, Dennis M. Cortical thickness of the frontopolar area in typically developing children and adolescents. Neuroimage. 2005;24(4):948–954. doi: 10.1016/j.neuroimage.2004.10.014. [DOI] [PubMed] [Google Scholar]
- 65.Sowell ER, Peterson BS, Thompson PM, Welcome SE, Henkenius AL, Toga AW. Mapping cortical change across the human life span. Nat Neurosci. 2003;6(3):309–315. doi: 10.1038/nn1008. [DOI] [PubMed] [Google Scholar]
- 66.Sowell ER, Thompson PM, Leonard CM, Welcome SE, Kan E, Toga AW. Longitudinal mapping of cortical thickness and brain growth in normal children. J Neurosci. 2004;24(38):8223–8231. doi: 10.1523/JNEUROSCI.1798-04.2004. [DOI] [PMC free article] [PubMed] [Google Scholar]
- 67.Thompson-Schill SL, Bedny M, Goldberg RF. The frontal lobes and the regulation of mental activity. Curr Opin Neurobiol. 2005;15(2):219–224. doi: 10.1016/j.conb.2005.03.006. [DOI] [PubMed] [Google Scholar]
- 68.Rubia K, Smith AB, Taylor E, Brammer M. Linear age-correlated functional development of right inferior fronto-striato-cerebellar networks during response inhibition and anterior cingulate during error-related processes. Hum Brain Mapp. 2007;28(11):1163–1177. doi: 10.1002/hbm.20347. [DOI] [PMC free article] [PubMed] [Google Scholar]
- 69.Aron AR, Robbins TW, Poldrack RA. Inhibition and the right inferior frontal cortex. Trends Cogn Sci. 2004;8(4):170–177. doi: 10.1016/j.tics.2004.02.010. [DOI] [PubMed] [Google Scholar]
- 70.Aron AR, Poldrack RA. The cognitive neuroscience of response inhibition: relevance for genetic research in attention-deficit/hyperactivity disorder. Biol Psychiatry. 2005;57(11):1285–1292. doi: 10.1016/j.biopsych.2004.10.026. [DOI] [PubMed] [Google Scholar]
- 71.Vallortigara G, Rogers LJ. Survival with an asymmetrical brain: advantages and disadvantages of cerebral lateralization. Behav Brain Sci. 2005;28(4):575–589. doi: 10.1017/S0140525X05000105. discussion 589-633. [DOI] [PubMed] [Google Scholar]
- 72.Melsbach G, Wohlschlager A, Spiess M, Gunturkun O. Morphological asymmetries of motoneurons innervating upper extremities: clues to the anatomical foundations of handedness? Int J Neurosci. 1996;86(3-4):217–224. doi: 10.3109/00207459608986712. [DOI] [PubMed] [Google Scholar]
- 73.Amunts K, Jancke L, Mohlberg H, Steinmetz H, Zilles K. Interhemispheric asymmetry of the human motor cortex related to handedness and gender. Neuropsychologia. 2000;38(3):304–312. doi: 10.1016/s0028-3932(99)00075-5. [DOI] [PubMed] [Google Scholar]
- 74.Zilles K, Dabringhaus A, Geyer S, Amunts K, Qu M, Schleicher A, Gilissen E, Schlaug G, Steinmetz H. Structural asymmetries in the human forebrain and the forebrain of non-human primates and rats. Neurosci Biobehav Rev. 1996;20(4):593–605. doi: 10.1016/0149-7634(95)00072-0. [DOI] [PubMed] [Google Scholar]
- 75.McManus IC, Bryden MP. Geschwind's theory of cerebral lateralization: developing a formal, causal model. Psychol Bull. 1991;110(2):237–253. doi: 10.1037/0033-2909.110.2.237. [DOI] [PubMed] [Google Scholar]
- 76.Sun T, Patoine C, Abu-Khalil A, Visvader J, Sum E, Cherry TJ, Orkin SH, Geschwind DH, Walsh CA. Early asymmetry of gene transcription in embryonic human left and right cerebral cortex. Science. 2005;308(5729):1794–1798. doi: 10.1126/science.1110324. [DOI] [PMC free article] [PubMed] [Google Scholar]
- 77.Luders E, Gaser C, Jancke L, Schlaug G. A voxel-based approach to gray matter asymmetries. Neuroimage. 2004;22(2):656–664. doi: 10.1016/j.neuroimage.2004.01.032. [DOI] [PubMed] [Google Scholar]
- 78.Smith AB, Taylor E, Brammer M, Toone B, Rubia K. Task-specific hypoactivation in prefrontal and temporoparietal brain regions during motor inhibition and task switching in medication-naive children and adolescents with attention deficit hyperactivity disorder. Am J Psychiatry. 2006;163(6):1044–1051. doi: 10.1176/ajp.2006.163.6.1044. [DOI] [PubMed] [Google Scholar]
- 79.Garrett A, Penniman L, Epstein J, Casey BJ, Hinshaw SP, Glover GP, Tonev SP, Vitolo AP, Davidson MPD, Spicer JBA, Greenhill LL, Reiss AL. Neuroanatomical abnormalities in adolescents with attention-deficit /hyperactivity disorder. J Am Acad Child Adolesc Psychiatry. 2008;47(11):1321–1328. doi: 10.1097/CHI.0b013e318185d285. [DOI] [PMC free article] [PubMed] [Google Scholar]
- 80.Glicksohn J, Myslobodsky MS. The representation of patterns of structural brain asymmetry in normal individuals. Neuropsychologia. 1993;31(2):145–159. doi: 10.1016/0028-3932(93)90043-y. [DOI] [PubMed] [Google Scholar]
- 81.Shaw P, Sharp WS, Morrison M, Eckstrand K, Greenstein DK, Clasen LS, Evans AC, Rapoport JL. Psychostimulant treatment and the developing cortex in attention deficit hyperactivity disorder. Am J Psychiatry. 2009;166(1):58–63. doi: 10.1176/appi.ajp.2008.08050781. [DOI] [PMC free article] [PubMed] [Google Scholar]
Associated Data
This section collects any data citations, data availability statements, or supplementary materials included in this article.