

Abstract
Bonded multilayer ceramics and composites incorporating low-loss piezoceramics have been applied to arrays for ultrasound imaging to improve acoustic transmit power levels and to reduce internal heating. Commercially available hard PZT from multiple vendors has been characterized for microstructure, ability to be processed, and electroacoustic properties. Multilayers using the best materials demonstrate the tradeoffs compared with the softer PZT5-H typically used for imaging arrays. Three-layer PZT4 composites exhibit an effective dielectric constant that is three times that of single layer PZT5H, a 50% higher mechanical Q, a 30% lower acoustic impedance, and only a 10% lower coupling coefficient. Application of low-loss multilayers to linear phased and large curved arrays results in equivalent or better element performance. A 3-layer PZT4 composite array achieved the same transmit intensity at 40% lower transmit voltage and with a 35% lower face temperature increase than the PZT-5 control. Although B-mode images show similar quality, acoustic radiation force impulse (ARFI) images show increased displacement for a given drive voltage. An increased failure rate for the multilayers following extended operation indicates that further development of the bond process will be necessary. In conclusion, bonded multilayer ceramics and composites allow additional design freedom to optimize arrays and improve the overall performance for increased acoustic output while maintaining image quality.
I. Introduction
AMONG many other requirements, ultrasound imaging system manufacturers are required to ensure patient safety by following established limits for acoustic power output and face temperature [1]. Face temperature is influenced by losses in the acoustic stack, including the piezoelectric material and the front acoustic lens. In some cases, to meet the face temperature limits, conventional imaging modalities use system settings that result in sound transmitted into the body being below the allowed intensity limit. This is particularly true when imaging deeper in the body where the intensity is degraded because of tissue attenuation, or imaging in Doppler mode when the transmit sequence delivers more average power to the transducer.
New imaging modalities such as acoustic radiation force impulse (ARFI) imaging utilize longer pulse durations than those used in Doppler mode [2]-[5] and would benefit from the ability to increase average transmit power levels if transducer heating could be avoided.
Substantially higher transmit power requirements are required in therapeutic applications where high intensities (e.g., HIFU) are used to selectively thermally ablate pathologic tissue. Average power levels for HIFU are significantly higher than for Doppler or ARFI imaging. Multi-element arrays for therapy have been shown to require transformers to improve electrical impedance matching, with the attendant drawbacks of component saturation and electrical losses [6].
Although the gold standard in monitoring HIFU is MRI, some applications utilize ultrasound to also guide the therapy [7]-[10]. In general, the approach employed for dual-use ultrasound guided therapeutic arrays is to make a therapeutic array work adequately for imaging. Therefore the resulting acoustic performance (e.g., sensitivity and bandwidth), though sufficient for differentiation of various tissue types, is usually significantly poorer than current state of the art diagnostic imaging arrays.
The objective of the present work is to achieve equivalent or better diagnostic image quality while simultaneously increasing the transmitted power level for equivalent probe heating. Although the initial objective is aimed at arrays used for conventional and ARFI imaging, the approach described herein may be generally applicable to the higher average power levels necessary for therapeutic ultrasound. In addition, the multilayer approach also has added benefits for electrical impedance matching, which could be particularly beneficial for multi-element arrays operating at lower frequencies, such as those used for many HIFU or image-guided HIFU applications.
A. Loss Mechanisms in Ultrasound Arrays
Losses and overall efficiency in imaging arrays employing piezoceramic as the electromechanical transducer material can be predicted using the KLM model [11], [12] modified to include mechanical and dielectric loss terms for the piezo and mechanical loss terms for all passive materials [13]-[15]. The losses in the piezoceramic materials vary significantly depending on the type of material employed [16]-[20]. In general, materials with higher electromechanical coupling and dielectric constants (e.g., piezoelectrically soft PZT5-H) have higher losses, whereas materials with lower coupling and dielectric constants (e.g., piezoelectrically hard PZT4 and PZT8) have lower losses [Qm and tan(δ)]. In addition, the losses in piezoceramics are dependent on the operating level (e.g., electric field and mechanical displacement) and temperature, and the dependency is different for each piezo material [17].
For arrays whose primary function is to provide diagnostic images, higher coupling and dielectric constant materials are usually employed because they result in higher bandwidth and sensitivity for improved image resolution and contrast. Also, the passive materials employed are generally selected with mechanical losses as a secondary consideration, e.g., relatively dense, stiff, and lossy backings (Zacoustic = 3 to 6 MRayl, ρ = 2 to 3 g/mL) and soft and moderately lossy front acoustic lenses (e.g., silicone rubber, Zacoustic = 1.1 to 1.3 MRayl, ρ = 1.1 to 1.2 g/mL, α = 2 to 10 dB/cm·MHz). The net result is substantial energy dissipation at both sides of the piezo material.
Arrays designed for ultrasound therapy typically employ low-loss piezo materials, low density (or air) backing, and are often focused mechanically (i.e., a concave radiating surface) to increase focusing gain and field intensity [6]. Active cooling is often employed to remove what heat is generated. For arrays that provide an imaging function as well as therapy, the resulting imaging performance is typically far inferior to that of conventional diagnostic imaging arrays [8], [9].
Fig. 1(a) shows KLM-modeled (1-D transmission line) transmit power levels corresponding to each interface in a typical ultrasound imaging array, starting at the electrical input terminals and progressing through the electrical components to the passive front matching layers, lens, and front water load. The piezoelectric loss coefficients were taken directly from [17] for low excitation levels and room temperature, and the passive material coefficients were from through transmission measurements using the technique described in [21]. The backing material is included as a parallel component; the backing material and the front lens represent the dominant loss components. The overall efficiency is less than 40%.
Fig. 1.

Transmit power calculated at the progression of KLM terminals: input electrical terminals, electrical components, backing, two front matching layers, front acoustic lens, and front water load: (a) low-power PZT5-H parameters; (b) high-power PZT5-H parameters; (c) PZT4 parameters, no lens, 0.1 MRayl backing impedance.
For Fig. 1(b), the piezoelectric loss terms were also taken from [17], but for higher drive level and operating temperature. It can be seen that losses in the piezo material now account for a significant fraction of overall power loss, and that the overall efficiency is less than 20%. For Fig. 1(c), the loss terms for PZT8 [17] were employed, the backing impedance was made equal to that of air, and the lens thickness was zero. The modeled efficiency is close to 80%.
B. Multilayers and Composites for Improved Matching
An advantage of the soft piezo materials is that they offer reasonably good electrical impedance matching. Acoustic impedance is not very well matched to biological tissue, and multiple acoustic matching layers must be employed to improve bandwidth and sensitivity. The use of composites [22], [23] with alternating layers of active piezoceramic and passive polymers can improve acoustic impedance matching, but this occurs at the expense of electrical impedance matching.
One way to ameliorate the electrical impedance matching problem is to employ a multilayer structure so individual layers are connected electrically in parallel and acoustically in series. Work in this area has been reported for a variety of array configurations, materials, and processing methods [24]–[34]. Processing methods include cofiring of thick films [25], similar to the processing used for multilayer capacitors. This method can only be used for multilayer ceramics, because the polymers used in composites cannot survive the firing temperatures employed. Also, the performance of co-fired multilayers is generally significantly poorer than that of bulk material. The other processing method is that of bonding layers prepared from bulk material. The advantage of this process is that it can employ composites, because adhesive curing temperatures are relatively low. The properties employed with this method have been found to be closer to those of the bulk material [33]. The disadvantages of this approach are that for good performance the bond layer thickness must be much less than a wavelength, and the alignment of the piezoceramic pillars should be 10% or less of the pillar width. Also, the presence of two additional interfaces creates reliability challenges.
Many of the results reported in the literature have been for a limited number of stacks and arrays with little or no mention of multilayer-to-multilayer and array inter-element uniformity. The work described herein employs the advantages of the bonded multilayer structure to circumvent the poorer properties of hard PZT materials. Specifically, the lower dielectric constant is compensated for in the multilayer structure, and the lower coupling is at least partially offset by the use of a composite structure with improved acoustic impedance matching. The end goal is to achieve improved thermal performance without sacrificing probe sensitivity or bandwidth.
II. Materials and Methods
A. Selection of Piezoceramic Materials
A study was conducted to determine the best available piezoceramic material for achieving low loss, high coupling, and ease of fine-scale processing. The comparison material was a modified PZT5-H type soft piezoceramic CTS 3203HD (CTS Corp., Albuquerque, NM). Materials with lower advertised mechanical and dielectric loss were selected from two vendors. The materials included two modified PZT8-types, namely EDO EC69 (EDO Western Corp., Salt Lake City, UT) and H11 (TFT Corporation, Osaka, Japan), and two modified PZT4-types, EC64 and H13. Materials were characterized to determine 1) microstructure, 2) ability to be processed into fine-scale structures, and 3) piezoelectric performance when formed into individual array elements.
1) Microstructure and Fine-Scale Processing
Microstructure was observed using a scanning electron microscope (SEM) to look for physical characteristics such as porosity, grain size, and fracture characteristics. Fracture surfaces were observed to determine whether the fracture mode was between the grains (inter-granular) or through the grains (trans-granular). Diced surfaces formed using a Disco DAD522 wafer dicing saw (Disco Corp., Tokyo, Japan) were also examined to observe differences in cut quality using a process equivalent to that used to form individual elements of a multi-element array.
To further examine the ability of the different materials to be processed into fine-scale arrays, a dicing test was conducted. Multiple cuts were made on a 1.0 mm thick by 7.0 mm wide plate of each material. The dicing depth was 0.75 mm; the blade width was 0.038 mm, and the feed rate was 2.0 mm/sec. Five cuts were made at each pitch, with pitches of 0.30, 0.26, 0.22, 0.19, 0.16, and 0.14 mm. Observations were made for dicing edge quality, micro-cracking, and any failure to maintain structural integrity.
2) Piezo Property Characterization
Piezoelectric material properties were measured using the resonance method [35]. Electrical impedance measurements were made to determine resonance frequencies and capacitance using an HP4194A Impedance Analyzer (Agilent Technologies, Santa Clara, CA). Resonator dimensions and plate mass were measured using standard calibrated lab instruments. Measurements were made on individual array element resonators cut from plates approximately 0.5 mm thick by 12 mm wide. In all cases, the width of the elements was made to be half the thickness. For each material, from four to eight samples were measured and the average values calculated.
B. Multilayer Ceramic and Composite Design, Fabrication, and Testing
Both ceramic and composite piezoelectric elements were investigated. For both materials, a multilayer structure was employed to increase the effective dielectric constant of the array elements. The configuration of the materials is described, as well as the fabrication process and characterization methods.
1) Multilayer Design
Fig. 2 shows the configuration for a three-layer composite. The individual layers are acoustically in series so that the entire structure resonates at a frequency close to a single layer of the same materials and configuration. The presence of a bond layer between the piezoceramic layers can add a series compliance that can affect resonance as well as coupling and loss, and therefore should be minimized. Each of the layers is electrically in parallel. Because each of the three layers is one-third the thickness of a single-layer device and there are three of them in parallel, the total element capacitance is nine times higher than for a single layer. Note that for a three-layer ceramic, the internal electrodes are the same, and there are no polymer layers.
Fig. 2.
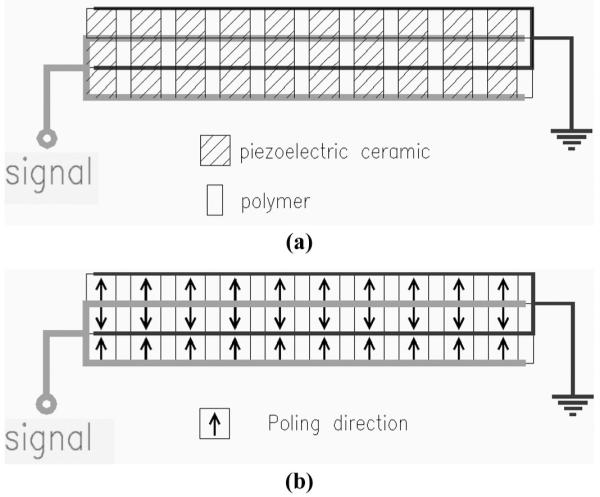
Multilayer composite with three layers showing (a) the arrangement of the active piezoceramic and passive polymer materials, and the internal and external electrodes; (b) poling orientation of the three layers. Note that the signal is usually the bottom and ground the top electrode and that this is representative of a single element of an array that can have from 64 to 256 individual elements, each with an independent signal electrode and typically a common ground electrode.
2) Multilayer Fabrication
Fig. 3 shows the individual plates before bonding. For composites, each of the plates is a 2–2 composite [23] with ceramic and polymer strips running in a direction perpendicular to the direction in which the elements are later diced. Each of the layers is prepared individually from a plate of bulk piezoceramic. For the composites, plates were formed using the dice- and-fill method [25]. The piezoceramic volume fraction was 70%, with a pitch of 0.3 mm. The polymer was loaded with small hollow glass spheres [Sphericel 110P8, ρ = 1.1 g/mL, mean particle size 12 μm, Potters Industries, Malvern, PA] to increase the shear velocity in the passive regions, resulting in more uniform surface velocity across the face of the structure. To minimize the bond layer thickness between the layers, it is necessary for the plates to be very flat with minimal surface roughness. This was accomplished by using a 2-sided planetary lapping machine (Model PR1, PR Hoffman Machine Company, Inc., Carlisle, PA) to both lap and polish the plates. The target thickness of each layer was chosen so that the series resonance frequency, fs, of the completed multilayer was around 3.4 MHz. To accomplish this, each layer was approximately 0.14 mm thick.
Fig. 3.

Multilayer composite with three layers showing: (a) three individual plates before bonding; and (b) multiple three-layer composite elements formed after the bonding operation. For the 3-layer composites, the pitch in the elevation direction is 0.44 mm, and the passive kerf is 0.15 mm, for a 65% volume fraction of active piezo. Total thickness of the 3-layer stack for a 3.4-MHz operating frequency is approximately 0.42 mm.
The individual plates are cut to size so that the location of the active strips relative to the edge of each piece is consistent. This aids the alignment of the separate layers during bonding, resulting in a cleaner resonance and improved performance. One side of each plate had no electrode over it; the other had an electrode over it so that connection to the outer layer could be made after the layers were bonded. The wrap around electrode was formed after bonding of the layers by sputtering metal on the outside, being careful to mask or remove the electrode to prevent the inadvertent connection of signal and ground.
3) Multilayer Characterization
The multilayer ceramics and composites were evaluated for piezoelectric performance using the same testing done on the bulk materials. For each of the multilayers, from four to eight array element resonators were sectioned from the ends of the plates. In this case ε33S is the effective relative clamped dielectric constant of an element, as if it were composed of a single layer of monolithic material. The clamped value is quoted because it determines the electrical operating impedance of the transducer. A comparison is made between the measured ε33S and that calculated theoretically based on three parallel composite layers of material with a dielectric constant as measured for the bulk material. In addition, an SEM was used to determine the bond layer thickness and the degree of misalignment between the ceramic regions in the composite.
C. Array Acoustic Design and Modeling Using Multilayers
The measured properties of the bulk piezoceramic and the ceramic and composite multilayers were used to predict the performance of arrays with a center operating frequency of 3.4 MHz. The KLM model was used to predict the performance of a typical imaging array that includes a backing, piezoceramic element, and two front matching layers. This model was implemented in Mathcad (Parametric Technology Corp., Needham, MA) using custom code. In addition to predicting typical array performance characteristics such as bandwidth and sensitivity, this approach also estimated overall transmit efficiency and power dissipation in every layer of the model.
First, a series of simulations were performed using the same passive layers and changing the dielectric constant, ε33S, from 0.1 to 50 times that of the control material, PZT5-H. All other coefficients were held constant using the values measured for PZT5-H. To determine how ε33S affects arrays with different element sizes, they were applied to two array designs, namely a phased linear and a large-curved array. Table I shows the physical parameters used to model the arrays. For all simulations a 2.3 m long, 42-gauge (42 AWG) cable of 50 Ω characteristic impedance was placed between the system and the element.
TABLE I.
Array Design Parameters Used to Model PA and LCA Response
| 3.2 MHz linear phased array |
3.4 MHz large curved array |
|
|---|---|---|
| Pitch (mm) | 0.23 | 0.45 |
| Pitch (λ) | 0.5 | 1.0 |
| Kerf (mm) | 0.036 | 0.05 |
| Elevation (mm) | 14.0 | 13.0 |
The simulated sensitivity and peak transmit pressure on the face of an array element are reported in terms of their values relative to that measured for the reference material, CTS 3203HD, and are related to ε33S RATIO = ε33S/1250. The value of 1250 is the ε33S measured for CTS 3203HD, thus the ε33S RATIO is the clamped dielectric constant relative to that of a single layer of CTS 3203HD.
D. Array Measurements and Imaging Assessment
Control and low-loss multilayer arrays were built in both the phased-linear ceramic and large-curved composite array forms. These units were characterized for water tank acoustic performance and electrical impedance. Face temperature measurements were made to assess array efficiency. All of the arrays had an acoustic lens, although for some of the face temperature measurements, a portion of the lens was removed to assess its affect on thermal performance. An imaging assessment was also made using B-mode and ARFI imaging modalities on arrays with an acoustic lens.
1) Element Characterization
Measurements were conducted in a water tank using a flat steel target with the elements positioned at the lens focal distance. Elements were excited with a Panametrics 5052PR pulser/receiver (Olympus NDT, Waltham, MA). Received waveforms were amplified by the 5052PR and digitized. All elements were tested individually. For each element, several performance variables were measured, including sensitivity (SENS) and percent fractional bandwidth (BW) with the following equations:
| (1) |
| (2) |
where Vrec is the received voltage, Vin is the input voltage, and fu and fl are the upper and lower –6-dB frequencies.
The acoustic variability of the multilayer arrays was compared with the single layer control arrays to assess whether the multilayers contributed to increased element to element variation. The measurements were also compared with the simulated results. Because the model did not include diffraction effects, the absolute sensitivity of the measurements and simulations could not be compared. However, the relative difference between the control and multilayer arrays should be accurate.
The electrical impedance of the elements was measured using an HP 4194A Impedance Analyzer (Agilent Technologies). For the phased linear and the large-curved arrays, the impedance was measured as close as possible to the array elements, and also at the other end of the system cable. These measurements were also compared with the simulations to validate the model.
2) Array Intensity Measurements
Focal intensity measurements were performed in water with the transducers directly coupled to a 3-D stepper motor-controlled translation stage (Newport, Irvine, CA) using a calibrated membrane hydrophone (PVDF, with a 0.6 mm spot size, Sonic Technologies, Wyndmoor, PA). The manufacturer-quoted precision of the calibration factor for voltage to pressure conversion is ±1.0 dB and was the dominant source of error in these measurements. Automated peaking of the hydrophone was performed using custom LabView (National Instruments, Austin, TX) programs written to control the translation stage and the ultrasound scanner. The pressure waveforms were measured at the focus for both 2.5 and 3.6 MHz, 10-cycle pulses that were created with unapodized apertures, focused at 6 cm using an F/3.5 (lateral) and F/6 (elevation) focal configuration, and 1 to 10% of the maximum system voltage. (This pulse is shorter than the actual heating and pushing pulses employed in the experiments to preserve the integrity of the hydrophone, which is prone to trapping air bubbles on its membrane and is thus prone to cavitation damage when making long-duration, high-pressure measurements.) The spatial-peak pulse-average and temporal-average intensities were calculated from the pressure waveforms and extrapolated to higher system voltages assuming a linear fit between squared-voltage and measured intensity.
3) Face Temperature Measurements
Transducer face heating measurements were performed using a Type-T thermocouple on the center of the active transmit aperture of each transducer array. In these measurements, the transducer was coupled with water to a tissue-mimicking material with the thermocouple sandwiched in between.
For the phased array, drive voltages were adjusted based upon the measured array electrical impedance to achieve equivalent electrical input power. For the large curved array, the system transmit voltage (PZT5-H = 40% and PZT-4 = 24%) was adjusted for each probe to ensure equal transmit intensity at the focus (2.5-MHz = 240 W/cm2, 3.6-MHz = 607 W/cm2 underrated), measured according to section II. Two transmit frequencies were evaluated: 2.5 and 3.6 MHz. The lower frequency results in deeper penetration because there is less attenuative loss and is suitable for ARFI pushing pulses, whereas the higher frequency corresponds to the center frequency of the array. To assess the influence of the lens, measurements were made on a lensed aperture and on an aperture for which the lens had been removed. The error bars associated with these measurements represent the standard deviation over four, re-peaked, independent measurements (with statistical outliers removed).
4) B-Mode Imaging
A single custom probe file was developed to interface the custom transducer arrays with the Siemens Antares scanner (Siemens AG, Munich, Germany). Conventional B-mode transmit and receive apertures and settings were used. B-mode images were obtained using each array imaging a commercially acquired lesion contrast phantom (RMI 404GS, Gammex, Middleton, WI). Quantitative analysis of lesion contrast was performed for each transducer array. Lesion contrast was calculated as
| (3) |
where Ii is the mean intensity inside the lesion and Io is the mean intensity in an equal-sized region outside the lesion at the same axial depth.
5) ARFI Imaging
A Siemens Antares scanner was modified to enable the use of custom transmit sequences, necessary for ARFI imaging, and to allow acquisition of the raw data for offline post-processing and image formation. ARFI image data was acquired in a CIRS (Computerized Imaging Reference Systems, inc., Norfolk, VA) elastography phantom mimicking liver tissue with stiffer spherical inclusions. ARFI imaging sequences and data processing were performed as decribed in [36], with specific details briefly reviewed below. Each ARFI sequence consisted of 50 pushing locations spaced 0.48 degrees apart. Each push pulse was a 2.5-MHz unapodized F/3.5 (lateral focus) 160-μs pulse focused at 6 cm. Each tracking pulse used an F/2 lateral transmit focal configuration, with dynamic receive focal processing (i.e., standard B-mode image pulses). ARFI data sets were acquired using a range of transmit voltages for each transducer. ARFI data processing was identical for all acquired data sets, and included depth–dependent focal gain normalization, motion filtering, and median filtering [37]. Quantitative comparison of the maximum displacement and contrast was performed. The maximum displacement magnitude was calculated by taking the maximum within ±25% of the focal depth after averaging all of the pushing locations outside of the lesion. The mean displacements in circular regions of equivalent size were computed inside and outside of the lesion, then contrast was calculated as in (3), but with intensity replaced by displacement.
III. Results
A. Bulk Piezoceramic Material Characterization
1) Microstructure and Fine Scale Dicing
Fracture surfaces were formed using elements from the dicing study. It was found that the CTS and EDO materials fractured almost completely through the grains (transgranular fracture), whereas the TFT materials fractured between the grains (intergranular fracture). All of the materials remained intact at even the narrowest dicing pitch, indicating sufficient processability for forming fine-scale ultrasound arrays with operating frequencies in the low megahertz range. The diced surfaces were examined for qualitative differences in the diced edges and porosity in the material. Fig. 4 shows diced edges for CTS 3203HD, EDO EC69, and TFT H13. From Fig. 4(a), it can be seen that the diced surface of CTS 3203HD contains a mixture of transgranular and intergranular characteristics, a grain size in the 2 to 4 μm range, reasonably little edge chipping, and a relatively low porosity. In Fig. 4(b) it is shown that EDO EC69 diced predominantly transgranularly, has a similar grain size and diced edge quality as 3203HD, but with considerably higher porosity. The TFT H13 material shown in Fig. 4(c) and Fig. 5 shows a slightly higher weighting of intergranular dicing pullout than transgranular, a finer grain structure in the 1 to 2 μm range, good diced edge quality, and porosity similar to that of 3203HD.
Fig. 4.

Scanning electron micrographs of piezoceramic material microstructure from a diced edge: (a) CTS 3203HD diced edge; (b) EDO EC69 diced edge; (c) TFT H13 diced edge.
Fig. 5.

Scanning electron micrographs of 3-layer composites cross-sectioned into individual element resonators and examined for any misalignment of the individual piezoceramic layers and epoxy bond layers between the layers. A range of misalignments and bond layers was observed, ranging from (a) very good: 5-μm misalignment and no discernable bond layer, to (b) poor: 30-μm misalignment and 6-μm bond layer.
2) Piezoelectric Property Measurements
Table II shows the properties measured for each of the materials. As expected for a modified PZT5-H material, the CTS 3203HD material shows a high electromechanical coupling coefficient and high dielectric constant. Both make it attractive for multi-element ultrasonic imaging arrays where bandwidth and sensitivity are of paramount importance and internal losses are generally a secondary consideration. The other materials exhibit lower losses, achieved at the expense of coupling and dielectric constant. Of the PZT4 types, both EC64 and H13 exhibited similar coupling, k33’, and dielectric loss, tan(δ), but the Qm of the H13 is considerably higher than for the EC64, indicating lower mechanical loss. Of the PZT8 types, the EC69 material had a higher k33’, higher dielectric constant, ε33S, and lower tan(δ). The lower density of the EDO materials is consistent with the higher porosity observed in its microstructure. It is not clear why the Qm for EDO is considerably lower than for TFT, or why the coupling of H11 is so low. It is believed to be material related, as multiple samples were prepared by the same methods for each material.
TABLE II.
Measured Physical Properties for the PZT5-H, PZT4, and PZT8 Piezoceramic Materials
| Manufacturer | CTS | EDO | EDO | TFT | TFT |
|---|---|---|---|---|---|
| Type | 3203HD | EC64 | EC69 | H11 | H13 |
| Composition | PZT5-H | PZT4 | PZT8 | PZT8 | PZT4 |
| ε 33 T | 3600 | 1500 | 1100 | 700 | 1350 |
| ε S | 1250 | 650 | 700 | 460 | 570 |
| tan(δ) | 0.0210 | 0.0018 | 0.0005 | 0.0019 | 0.0018 |
| k33’ | 0.71 | 0.67 | 0.61 | 0.50 | 0.68 |
| Q m | 63 | 280 | 350 | 1000 | 1700 |
| N (MHz mm) | 2.02 | 2.04 | 2.07 | 2.14 | 2.09 |
| Z (MRayl) | 31.6 | 31.0 | 30.9 | 32.4 | 32.6 |
| V (mm/μs) | 4.05 | 4.08 | 4.14 | 4.28 | 4.17 |
| ρ (g/mL) | 7.8 | 7.5 | 7.6 | 7.9 | 7.6 |
B. Multilayer Ceramic and Composite Characterization
1) Bond Quality
Several dozen multilayer ceramic and composite plates were formed and characterized. The TFT H13 material was selected based on the combination of good microstructure, higher k33’, and higher Qm. The results shown focus on multilayer composites, because of their lower acoustic impedance, and hence better acoustic matching to tissue and bandwidth. Fig. 5 shows SEM micrographs of 3-layer composite resonators with (a) very good piezoceramic pillar alignment and minimal bond layer thickness, and (b) poor piezoceramic pillar alignment and significant bond layer thickness.
2) Multilayer Composite Properties
Table III shows the average measured properties for 10 plates of 3-layer H13 ceramic and 34 plates of 3-layer H13 composite. The mean effective ε33S of 3900 for the composites is close to the theoretical value of 3600 predicted based on the measured single-layer dielectric constant, volume fraction, and number of layers. The ε33S of 4700 for the ceramics is slightly below the theoretical value of 5100. For ceramic and composite 3-layer stacks of H13, the mean ε33S is roughly three to four times higher than that of a single layer of CTS 3203HD. Note that ε33S is affected by the coupling coefficient, k33’, in such a way that plates with lower coupling can have a dielectric constant higher than that predicted. The mean k33’ of 0.63 is 93% that of the bulk material.
TABLE III.
Mean Measured Physical Properties for a Series of 34 Composites Fabricated With Three Layers of TFT H13 Ceramic and Composite Material
| ε 33S | k33 ’ | tan(δ) | Qm | Z (MRayl) |
|
|---|---|---|---|---|---|
| 3-layer ceramic array element resonators | |||||
| Mean | 4700 | 0.62 | 0.0029 | 145 | 29.5 |
| SD | 370 | 0.01 | 0.0002 | 55 | 0.7 |
| 3-layer composite array element resonators | |||||
| Mean | 3850 | 0.63 | — | 86 | 20.9 |
| SD | 500 | 0.02 | — | 25 | 0.7 |
The mechanical quality factor, Qm, has been reduced significantly from that measured for the bulk material, from over 1600 to 145 for the 3-layer ceramic and 86 for the 3-layer composite. This indicates that significant mechanical loss has been created by either the composite or the multilayer structure. However, the mechanical loss is still lower than that of CTS 3203HD in monolithic form. Furthermore, the dielectric loss tangent, tan(δ), was 0.003 for the 3-layer ceramic, which is significantly lower than for the piezoelectrically soft CTS 3203HD material.
Fig. 6 shows the measured distributions for the 34 multilayer composite plates. The multilayers show considerably more variation in ε33S, k33’, and Qm than would be typical for bulk PZT. A cross plot of k33’ versus Qm [Fig. 7(a)] shows moderate correlation. This indicates that the physical factors that increase mechanical loss also decrease coupling. Similarly, Fig. 7(b) shows a weaker relationship between ε33S and Qm, indicating that other factors can be affecting the effective dielectric constant.
Fig. 6.

Distribution of measured values for 3-layer composites of H13: (a) ε33S, (b) k33’, and (c) Qm.
Fig. 7.

Relationship between parameters for 3-layer H13 composite plates: (a) plot of k33’ vs. Qm, showing a moderate linear relationship between the two parameters, correlation coefficient = 0.47; (b) plot of ε33S vs. Qm, showing a weak negative linear relationship, correlation coefficient = 0.07.
C. Array Design and Modeling Using Multilayers
Fig. 8 shows the simulated sensitivity and peak transmit pressure on the face of the array element as a function of ε33SRATIO, where the ε33SRATIO is the clamped dielectric constant relative to that of a single layer of CTS 3203HD, as described in section II. In Fig. 8(a), a 3.4-MHz large curved array is modeled. The sensitivity peaks at an ε33SRATIO of 2.5, and the peak transmitted pressure peaks around an ε33SRATIO of 3. Because of the smaller element area, the 3.2-MHz phased array shown in Fig. 8(b) has a peak sensitivity at an ε33SRATIO of 5 and a peak transmit pressure at an ε33SRATIO of 8. For a given array design with a fixed element area and operating frequency, it is possible to choose a dielectric constant to maximize sensitivity or transmit pressure. To achieve this dielectric constant, a multilayer can be designed with the appropriate number of layers and volume fraction of piezoceramic material, as was done here.
Fig. 8.

Plots of modeled sensitivity and peak transmitted pressure as a function of the relative dielectric constant scale factor for (a) 3.4-MHz large curved array, and (b) 3.2-MHz phased array.
D. Array Acoustic Characterization Measurements and Imaging Assessment
1) Individual Element Characterization
Table IV shows the measurements made for two 3.2-MHz phased arrays (PA), one a control incorporating CTS3203HD and the other using all the same passive acoustic materials but incorporating a 3-layer ceramic of TFT H13. The 3-layer ceramic PA shows an improvement in sensitivity of almost 4 dB, and only a slight reduction in bandwidth and pulse response. The sensitivity improvement is consistent with Fig. 8(b), because the control array resides far to the left of the optimum dielectric constant, and the 3-layer ceramic array is closer to the optimum dielectric constant for this design. Fig. 9 shows the pulse-echo waveforms and spectra for the two arrays.
TABLE IV.
Measured Acoustic Tank Performance for Control and Low-Loss 3-Layer Ceramic Phased Arrays
| PZT type | PZT-4 | PZT5-H |
|---|---|---|
| Backing Z (MRayl) | 0.7 | 3.2 |
| Sensitivity (dB re input) | −63.7 | −67.5 |
| Fc (MHz) | 3.3 | 3.4 |
| BW (%) | 60 | 66 |
| t-6 dB (μs) | 0.47 | 0.37 |
| t-20 dB (μs) | 1.34 | 1.24 |
| t-30 dB (μs) | 2.41 | 1.80 |
| t-40 dB (μs) | 3.61 | 3.38 |
Fig. 9.

Pulse-echo measurements for control and low-loss 3-layer ceramic phased arrays: (a) waveform; and (b) spectrum.
Table V shows the measurements made for two 3.4-MHz large curved arrays (LCA), one a control incorporating CTS3203HD and the other using all the same passive acoustic materials but incorporating a 3-layer composite of TFT H13. Fig. 10 shows the pulse-echo waveforms and spectra for the two arrays. The 3-layer composite LCA shows sensitivity roughly equivalent to the control, and slightly better bandwidth and pulse response because of the improved acoustic matching afforded by the composite. The equivalent sensitivity is consistent with the curve of Fig. 8(a), because the control array resides to the left of the optimum dielectric constant, and the 3-layer composite array slightly to the right.
TABLE V.
Measured Acoustic Tank Performance for Control and Low-Loss 3-Layer Composite Large Curved Arrays
| Control | 3-layer PZT4 composite |
|
|---|---|---|
| Sensitivity (dB) | −60.9 | −60.3 |
| Sensitivity (dB SD) | 0.26 | 0.56 |
| fc (MHz) | 3.6 | 3.4 |
| BW (%) | 78.0 | 82.0 |
| t-6 dB (μs) | 0.37 | 0.38 |
| t-20 dB (μs) | 1.24 | 1.02 |
| t-30 dB (μs) | 1.49 | 1.85 |
Fig. 10.

Pulse-echo measurements for control and low-loss 3-layer composite large curved arrays: (a) waveform; and (b) spectrum.
Fig. 11 shows the element response measured for each element of the 192-element LCAs made from a single layer of CTS3203HD and 3-layer composite of H13. The bandwidth uniformity is similar for both arrays, with the multilayer array exhibiting slightly higher bandwidth. The sensitivity uniformity is also similar, with the multilayer array being slightly more variable and higher in average sensitivity level.
Fig. 11.
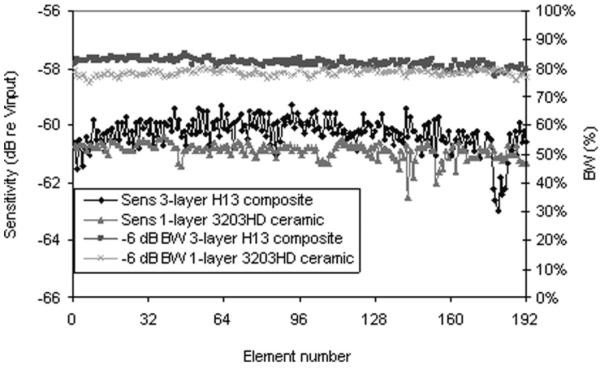
Element response measured for each element of 192-element LCAs made from a single layer of CTS3203HD and 3-layer composite of H13. The bandwidth uniformity is similar for both arrays, with the multilayer array exhibiting slightly higher bandwidth. The sensitivity uniformity is also similar, with the multilayer array being slightly more variable and higher in average sensitivity level.
2) Hydrophone and Thermocouple Measurements
Fig. 12 shows the face temperature measured using a thermocouple placed on the face of both the control and 3-layer ceramic phased arrays. For the measurements, the electrical power delivered to the probes was made equal by adjusting the drive level for the different electrical impedance of the two probes. Note that the face temperature of the control quickly reaches the IEC limit of 43°C, whereas the low-loss 3-layer ceramic array stabilized at less than 43°C, even after 15 min of driving.
Fig. 12.
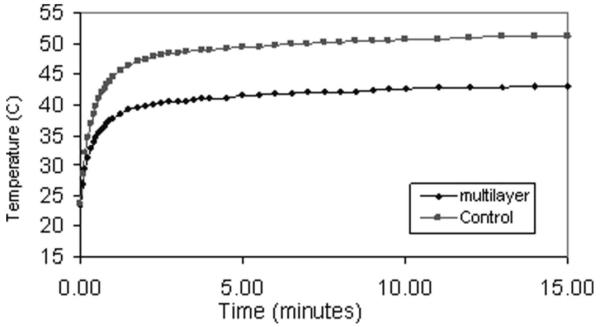
Face temperature measured using equivalent electrical input power to the control and the 3-layer ceramic phased arrays.
Table VI shows a comparison of face heating for the control and 3-layer low-loss composite LCAs, measured at two different transmit frequencies, with and without a lens. For each transmit frequency, the system input voltage was adjusted for each probe to ensure equal transmit intensity at the focus, as listed in the table. To assess the influence of the lens, measurements were made on a lensed aperture and on an aperture for which the lens had been removed. From the table, it can be seen that the low-loss 3-layer composite LCA array exhibited 61% lower heating for equal focal intensity. Also notable is that the heating was significantly higher for the apertures without a lens. Thus, even though the lens material is lossy and dissipates energy, it acts as a thermal insulator to lower the thermal exposure on the face. Fig. 13 shows these face temperature measurements versus time at the two driving frequencies for the control and low-loss 3-layer composite LCAs (with the lens intact) using a 1 cm aperture. Because of better electrical impedance matching, comparable focal intensities (Isppa) were achieved with a lower driving voltage for the 3-layer composite LCA array as compared with the control (see Table VI). Error bars show the standard deviation over four re-peaked measurements with the statistical outliers removed. At both frequencies, the low-loss array exhibited less than half the temperature rise of the control.
TABLE VI.
Comparison of Face Heating Measured for 1-Layer CTS3203HD and 3-Layer H13 Composite LCAs
| Face temperature (°C) |
|||
|---|---|---|---|
| Focal intensity (W/cm2) ±5% |
1 layer, PZT5-H ceramic |
3 layer, PZT-4 composite |
|
| 2.5 MHz lens | 240 | 4.6 ± 0.3 | 1.8 ± 0.3 |
| 3.64 MHz lens | 607 | 7.3 ± 0.7 | 2.9 ± 0.2 |
| 2.4 MHz no lens | 76 | 5.8 ± 0.4 | 2.3 ± 0.3 |
| 3.64 MHz no lens | 166 | 8.7 ± 0.8 | 3.4 ± 0.2 |
Sequences used were M-mode, focused at 6 cm with a 1-cm aperture (33 elements) with a 7.062-kHz PRF and a 2.8% duty cycle. One layer at 40% system voltage. Three layer at 24% system voltage.
Fig. 13.

Face temperature measured for 1-layer CTS3203HD ceramic and 3-layer H13 composite LCA with lens intact: (a) 2.5-MHz driving frequency; and (b) 3.6-MHz driving frequency.
3) B-mode Imaging Assessment
Fig. 14 shows matched phantom (RMI 404GS, Gammex, Middleton, WI) images obtained with the control and 3-layer composite large curved arrays. The images show nearly identical imaging performance, with the control array showing slightly better near-field resolution and the low-loss 3-layer composite array having slightly better contrast at depth.
Fig. 14.

B-mode images of an RMI phantom including cysts and point targets using 192-element LCA probes operating at 3.6 MHz: (a) control 1-layer PZT5-H (contrast: hyperechoic = −0.28, hypoechoic = 0.42) and (b) 3-layer low-loss PZT4 composite (contrast: hyperechoic = −0.25, hypoechoic = 0.41). Note the similar image quality.
4) ARFI Imaging Assessment
Fig. 15 shows ARFI images of a CIRS (Computerized Imaging Reference Systems, Inc., Norfolk, VA) elastography liver tissue mimicking phantom 0.8 ms after radiation force excitation using various system transmit powers with both the control and the 3-layer composite LCA transducers. All of the images have been normalized, motion filtered, and median filtered in the same manner. The top row (a)–(c) used the 3-layer PZT4 piezocomposite LCA, and the bottom row (d)–(f) used the 1-layer PZT5-H piezoceramic LCA. Table VII summarizes the quantitative analysis of the ARFI images. It can be seen that the 3-layer low-loss composite array achieved displacement magnitude and contrast similar to the control with approximately 10% lower system transmit voltage.
Fig. 15.

ARFI images of a lesion in a CIRS elastography phantom mimicking liver tissue 0.8 ms after radiation force excitation using 57% (a), 67% (b and d), 77% (c and e), and 87% (f) of the maximum system voltage for the radiation force excitation. Top row: PZT4, 3-layer composite array, bottom row: PZT5-H, single-layer control array.
TABLE VII.
Comparison of Displacement and Contrast From the Images Shown in Fig. 15
| 1-layer |
3-layer |
||||
|---|---|---|---|---|---|
| System voltage (%) |
Displacement (μm) |
Contrast | System voltage (%) |
Displacement (μm) |
Contrast |
| 67 | 1.9 | 0.6 | 57 | 1.9 | 0.6 |
| 77 | 2.4 | 0.6 | 67 | 2.5 | 0.6 |
| 87 | 3.1 | 0.6 | 77 | 3.2 | 0.6 |
Note that the low-loss 3-layer array shows equivalent displacements at lower voltage transmit levels and equivalent contrast across all reported transmit voltages. The variations in displacement and contrast over 4 trials were negligible (<0.06 μm and < 0.02, respectively).
IV. Discussion and Conclusions
The difference in porosity observed between the EDO and TFT materials did not correlate with any difficulty in dicing. Somewhat surprisingly, all of the materials were able to be diced down to the finest pitch and highest aspect ratio tested without fracturing. The material properties measured for the hard piezoceramics showed some interesting differences between PZT4 and PZT 8 and between the two manufacturers. For the EDO materials, the tan(δ) for the PZT4 was significantly higher than for PZT8, but tan(δ) was nearly identical for the TFT materials. For all the hard materials, the tan(δ) was 10% or less that of the soft CTS3203D material. The Qm for all the hard materials was four or more times higher than for CTS3203HD, with the TFT materials significantly less mechanically lossy than the EDO materials in bulk form. The electromechanical coupling, k33’, was lower for all the hard materials, though both PZT4 materials were only slightly so. The reasons for the relatively modest tradeoff in coupling for the PZT4 materials can only be speculated about without specific knowledge of the dopants and processing used to manufacture the piezoceramic. The same could explain the significantly higher Qm for both TFT materials, and the much lower k33’ for TFT H11. Because of the slightly better electromechanical performance and better microstructure, the TFT H13 material (PZT4-type) was chosen for the multilayer development.
The bond layer and ceramic pillar alignment proved to be rather difficult to control, and were likely responsible for much of the variation seen in the measured properties for the H13 multilayer composites. Better control of the surface preparation and bonding process could reduce the variability significantly, especially for the coupling and mechanical losses that appear to be caused largely by the same factors. This could reduce the element to element variation within an array as well as improve the array-to-array performance repeatability. It should be noted that the Qm measured for the composites is the net result of the materials and structure. Based on the bulk material measurements, the multilayer composite losses are dominated by the structure. For much higher Qm to be achieved, it will be necessary to further optimize the materials and processes employed. Co-fired multilayer ceramics were evaluated initially and found to exhibit lower coupling and increased losses compared with bonded ceramics. Of course, co-fired composites are not possible at all.
The additional design flexibility afforded in selecting different piezo materials, composite volume fractions, and numbers of layers should enable any array configuration to be operated closer to an optimal configuration for whatever performance criteria are most important, e.g., sensitivity, transmit efficiency, bandwidth, etc. Most of the present study was designed to operate around 3.2 MHz, though units have been built successfully to operate at frequencies up to 5 MHz. Extension of the bonded multilayer process to frequencies higher than this will require further process development, because the bond layer and pillar misalignment tolerance is reduced for smaller operating wavelengths.
The arrays were found to perform as expected, with the small area element phased array built with 3-layer ceramic showing a higher sensitivity increase and a slightly lower bandwidth than the control, whereas the larger area large curved array built with 3-layer composite showed comparable sensitivity but higher bandwidth.
The face temperatures of the 3-layer ceramic phased array and 3-layer composite curved array were significantly lower than those of their control counterparts. This finding was expected because of the lower loss tangent of the harder ceramic used in the multilayer arrays. The lens of the array was also shown to provide thermal insulation between the outside environment and the internal heat-producing transducer components.
Image quality was found to be similar between the 3-layer composite curved array and its control. B-mode near-field resolution was slightly better in the control array, whereas the 3-layer composite had slightly better contrast at depth. Similarly, the displacement contrast from a stiff lesion in ARFI images was identical for both arrays. However, the 3-layer composite was able to achieve higher displacements at lower driving voltages, thereby improving the contrast-to-noise ratio at lower voltages. Unfortunately, the multilayers were prone to delamination between the individual composite layers when thermally stressed. Further development of the surface preparation and bonding process will be required to enable a more robust multilayer structure able to maintain performance during and after operation at significantly elevated temperatures.
In conclusion, the use of multi-layer piezocomposite transducer arrays appears to be a promising technology for performing concurrent diagnostic imaging and therapy. In this work this technology successfully generated lower face temperatures than the controls, and achieved comparable B-mode and ARFI image quality, while requiring lower drive voltages than controls. A considerable challenge, however, remains in the delamination of the layers, which may be overcome by modifications in the bonding process. The commercial potential of this technology would be determined by the value of whatever unique product capability is provided (e.g., high quality imaging and therapy) relative to the cost associated with developing workable manufacturing processes. Ultimately over time, performance must be improved while cost is reduced.
Acknowledgments
The authors would like to acknowledge the financial support provided by the National Institutes of Health under grants 2R44 EB00852-02, 1R01 EB-002132, and 1R01 CA-114075, as well as NSF Graduate Research Fellowship 2003014921.
Biography

Michael J. Zipparo (M’02) was born in Pittsburgh, PA, on October 25, 1968. He received the B.Sc. degree in electrical engineering in May 1991, the M.Sc. degree in acoustics in December 1993, and the Ph.D. degree in bioengineering in December 1996, all from The Pennsylvania State University, University Park, PA.
He has been employed as a transducer engineer at Blatek, Inc., Sound Technology, Inc., and Advanced Coronary Intervention, Inc. Starting in 1998, he was employed by Tetrad Corp., until its acquisition by W. L. Gore and Associates in 2005. He is currently an Associate at W. L. Gore in the Medical Products Division in Englewood, CO. His research interests include electromechanical transduction mechanisms and materials, transducer and array acoustic design and modeling, transducer efficiency optimization, and methods for array interconnect, processing, cabling, and manufacturing.
Kristin F. Bing (M’09) received her B.S.E. degree in biomedical engineering from Case Western Reserve University, Cleveland, OH, in 2003. She was a National Defense Science and Engineering Graduate fellow and a National Science Foundation Graduate Research fellow. She received her Ph.D. degree in biomedical engineering from Duke University, Durham, NC, in 2008. She is currently a research engineer at Georgia Tech Research Institute (GTRI), Atlanta, GA. Her research interests include radiation force imaging methods, therapeutic ultrasonic methods, multi-dimensional adaptive filtering, and synthetic aperture imaging.

Kathy Nightingale received her B.S. degree (electrical engineering) in 1989 from Duke University. She served in the United States Air Force as a program engineer from 1989 to 1992. She received her Ph.D. degree in biomedical engineering from Duke University in 1997. Her research interests include the investigation of radiation force based imaging methods, elastography, ultrasonic breast imaging, ultrasonic flow detection, and therapeutic ultrasound.
Contributor Information
Michael J. Zipparo, W. L. Gore and Associates Inc., Englewood, CO (mzipparo@wlgore.com)
Kristin F. Bing, Georgia Tech Research Institute, Sensors and Electromagnetic Applications Lab, Smyrna, GA
Kathy R. Nightingale, Duke University, Department of Biomedical Engineering, Durham, NC
References
- [1].Medical Electrical Equipment—Particular Requirements for the Safety of Ultrasonic Medical Diagnostic and Monitoring Equipment. 2001. IEC 60601–2-37. [Google Scholar]
- [2].Nightingale KR, Soo MS, Nightingale RW, Trahey GE. Acoustic radiation force impulse imaging: In vivo demonstration of clinical feasibility. Ultrasound Med. Biol. 2002;28(2):227–235. doi: 10.1016/s0301-5629(01)00499-9. [DOI] [PubMed] [Google Scholar]
- [3].Nightingale KR, Palmeri ML, Nightingale RW, Trahey GE. On the feasibility of remote palpation using acoustic radiation force. J. Acoust. Soc. Am. 2001;110(1):625–634. doi: 10.1121/1.1378344. [DOI] [PubMed] [Google Scholar]
- [4].Nightingale KR, Bentley R, Trahey GE. Observations of tissue response to acoustic radiation force: Opportunities for imaging. Ultrason. Imaging. 2002;24:100–108. doi: 10.1177/016173460202400301. [DOI] [PubMed] [Google Scholar]
- [5].Palmeri ML, Nightingale KR. On the thermal effects associated with acoustic radiation force impulse imaging. IEEE Trans. Ultrason. Ferroelectr. Freq. Control. 2004 May;51(5):551–565. [PubMed] [Google Scholar]
- [6].Curiel L, Chavrier F, Souchon R, Birer A, Chapelon JY. 1.5-D high intensity focused ultrasound array for non-invasive prostate cancer surgery. IEEE Trans. Ultrason. Ferroelectr. Freq. Control. 2002 Feb.49(2):231–242. doi: 10.1109/58.985707. [DOI] [PubMed] [Google Scholar]
- [7].Barthe PG, Slayton MH. Efficient wideband linear arrays for imaging and therapy; Proc. 1999 IEEE Ultrasonics Symp.pp. 1249–52. [Google Scholar]
- [8].Makin IR, Mast TD, Faidi W, Runk MM, Barthe PG, Slayton MH. Miniaturized ultrasound arrays for interstitial ablation and imaging. Ultras. Med. Biol. 2005;41(11):1539–50. doi: 10.1016/j.ultrasmedbio.2005.07.008. [DOI] [PubMed] [Google Scholar]
- [9].Ebbini ES, Yao H, Shrestha A. Dual-mode ultrasound phased arrays for image-guided surgery. Ultrason. Imaging. 2006 Apr.28(2):65–82. doi: 10.1177/016173460602800201. [DOI] [PubMed] [Google Scholar]
- [10].Barthe PG, Slayton MH, Jaeger PM, Makin IRS, Gallagher LA, Mast TD, Runk MN, Faidi W. Ultrasound therapy system and ablation results utilizing miniature imaging/therapy arrays; Proc. 2004 IEEE Ultrasonics Symp.pp. 1792–1795. [Google Scholar]
- [11].Krimholtz R, Leedom DA, Matthei GL. New equivalent circuits for elementary piezoelectric transducers. Electron. Lett. 1970;6(13):398–399. [Google Scholar]
- [12].Selfridge AR, Gehlbach S. KLM transducer model implementation using transfer matrices; Proc. 1985 IEEE Ultrasonics Symp..pp. 875–877. [Google Scholar]
- [13].Oakley CG. Calculation of ultrasonic transducer signal-to-noise ratios using the KLM model. IEEE Trans. Ultrason. Ferroelectr. Freq. Control. 1997 Sep.44(5):1018–1026. [Google Scholar]
- [14].Zipparo MJ, Shung KK, Shrout TR. Piezoceramics for high frequency (20–80 MHz) single-element imaging transducers. IEEE Trans. Ultrason. Ferroelectr. Freq. Control. 1997 Sep.44(5):1038–1048. [Google Scholar]
- [15].Ih J-H, Lee B-H. Attenuation coefficient of a piezoelectric resonator operating in a thickness mode. Electron. Lett. 1986 Mar.22:357–358. [Google Scholar]
- [16].Jaffe B, Cook WR, Jr., Jaffe H. Piezoelectric Ceramics. Academic; New York: 1971. [Google Scholar]
- [17].Berlincourt D. Piezoelectric crystals and ceramics. In: Mattiat OE, editor. Ultrasonic Transducer Materials. Plenum Press; New York, NY: 1971. pp. 100–107. ch. 2. [Google Scholar]
- [18].Uchino K, Zheng JH, Chen YH, Du XH, Ryu J, Gao Y, Ural S, Priya S. Loss mechanisms and high power piezoelectrics. J. Mater. Sci. 2006;41:217–228. [Google Scholar]
- [19].Uchino K, Hirose S. Loss mechanisms in piezoelectrics: How to measure different losses separately. IEEE Trans. Ultrason. Ferroelectr. Freq. Control. 2001 Jan.48(1):307–321. doi: 10.1109/58.896144. [DOI] [PubMed] [Google Scholar]
- [20].Zhang S, Lim JB, Lee HJ, Shrout TR. Characterization of hard piezoelectric lead-free ceramics. IEEE Trans. Ultrason. Ferroelectr. Freq. Control. 2009 Aug.5(8):1523–1527. doi: 10.1109/TUFFC.2009.1215. [DOI] [PMC free article] [PubMed] [Google Scholar]
- [21].Wu J. Determination of velocity and attenuation of shear waves using ultrasonic spectroscopy. J. Acoust. Soc. Am. 1996 May;99(5):2871–2875. [Google Scholar]
- [22].Smith WA, Auld B. Modeling 1–3 composite piezoelectrics: Thickness-mode oscillations. IEEE Trans. Ultrason. Ferroelectr. Freq. Control. 1991;38(1):40–47. doi: 10.1109/58.67833. [DOI] [PubMed] [Google Scholar]
- [23].Newnham RE, Skinner DP, Cross LE. Connectivity and piezoelectric-pyroelectric composites. Mater. Res. Bull. 1978;13(5):525–536. [Google Scholar]
- [24].Gururaja TR, Schulze WA, Cross LE, Newnham RE, Auld BA, Wang YJ. Piezoelectric composite materials for ultrasonic transducer applications. Part I: Resonant modes of vibration for PZT rod-polymer composites. IEEE Trans. Sonics Ultrason. 1985;SU-32(4):481–498. [Google Scholar]
- [25].Smith WA. The role of piezocomposites in ultrasonics transducers; Proc. 1989 IEEE Ultrasonics Symp..pp. 755–766. [Google Scholar]
- [26].Goldberg RL, Smith SW. Multilayer piezoelectric ceramics for two-dimensional array transducers. IEEE Trans. Ultrason. Ferroelectr. Freq. Control. 1994 Sep.41(5):761–771. doi: 10.1109/58.308512. [DOI] [PubMed] [Google Scholar]
- [27].Greenstein M, Kumar U. Multilayer piezoelectric resonators for medical ultrasound transducers. IEEE Trans. Ultrason. Ferroelectr. Freq. Control. 1996 Jul.43(4):620–622. [Google Scholar]
- [28].Mills DM, Smith SW. Multi-layered PZT/polymer composites to increase signal-to-noise ratio and resolution for medical ultrasound transducers, Part II: Thick film technology. IEEE Trans. Ultrason. Ferroelectr. Freq. Control. 1997 Jul.49(7):1005–1013. doi: 10.1109/tuffc.2002.1020171. [DOI] [PubMed] [Google Scholar]
- [29].Mills DM, Smith SW. Finite element comparison of single crystal vs multi-layer composite arrays for medical ultrasound. IEEE Trans. Ultrason. Ferroelectr. Freq. Control. 1997 Jul.49(7):1015–1020. doi: 10.1109/tuffc.2002.1020172. [DOI] [PubMed] [Google Scholar]
- [30].Goldberg RL, Emery CD, Smith SW. Hybrid multi/single layer array transducers for increased signal-to-noise ratio. IEEE Trans. Ultrason. Ferroelectr. Freq. Control. 1997 Mar.44(2):315–325. doi: 10.1109/58.585116. [DOI] [PubMed] [Google Scholar]
- [31].Mills DM, Smith SW. Multi-layered PZT/polymer composites to increase signal-to-noise ratio and resolution for medical ultrasound transducers. IEEE Trans. Ultrason. Ferroelectr. Freq. Control. 1999 Jul.46(4):961–971. doi: 10.1109/58.775663. [DOI] [PubMed] [Google Scholar]
- [32].Oakley CG, Pazol BG, Powell DJ, LaBree MR, Gabriel KM, Koornneef LM, Calahan MS, Wojcik G. Stacked composite piezoelectric materials for 1.5-D arrays; Proc. 1997 IEEE Ultrasonics Symp.; Toronto, Ontario, Canada. pp. 923–926. [Google Scholar]
- [33].Zipparo MJ, Oakley CG, He M. Multilayer ceramics and composites for ultrasonic imaging arrays; Proc. 1999 IEEE Ultras. Symp.pp. 947–952. [Google Scholar]
- [34].Emery CD, Smith SW. Ultrasonic imaging using a 5-MHz multilayer single-layer hybrid array for increased signal-to-noise ratio. IEEE Trans. Ultrason. Ferroelectr. Freq. Control. 1999 Sep.46(5):1101–1119. doi: 10.1109/58.796116. [DOI] [PubMed] [Google Scholar]
- [35].ANSI/IEEE Standard on Piezoelectricity. 1987. Std. 176–1987. [Google Scholar]
- [36].Nightingale KR, Palmeri ML, Trahey GE. Analysis of contrast in images generated with transient acoustic radiation force. Ultrasound Med. Biol. 2006;32(1):61–72. doi: 10.1016/j.ultrasmedbio.2005.08.008. [DOI] [PubMed] [Google Scholar]
- [37].Fahey BJ, Palmeri ML, Trahey GE. The impact of physiological motion on tissue tracking during radiation force imaging. Ultrasound Med. Biol. 2007;33(7):1149–1166. doi: 10.1016/j.ultrasmedbio.2007.01.007. [DOI] [PMC free article] [PubMed] [Google Scholar]