

Abstract
We report an investigation of gene dosage at 9p21.3 and mutations in BRAF and NRAS, as predictors of relapse and histological markers of poor melanoma prognosis. Formalin-fixed primary melanomas from 74 relapsed and 42 nonrelapsed patients were sequenced for common BRAF and NRAS mutations (N = 71 results) and gene dosage at 9p21.3 including the genes CDKN2A (which encodes CDKN2A and P14ARF), CDKN2B (CDKN2B), and MTAP was measured using multiplexed ligation-dependant probe amplification (MLPA), (N = 75 results). BRAF/NRAS mutations were detected in 77% of relapsers and 58% of nonrelapsers (Fisher's exact P = 0.17), and did not predict ulceration or mitotic rate. There was no relationship between BRAF/NRAS mutations and gene dosage at 9p21.3. Reduced gene dosage at MTAP showed a borderline association with BRAF mutation (P = 0.04) and reduced gene dosage at the interferon gene cluster was borderline associated with wild type NRAS (P = 0.05). Reduced gene dosage in the CDKN2A regions coding for CDKN2A was associated with an increased risk of relapse (P = 0.03). Reduced gene dosage across 9p21.3 was associated with increased tumor thickness, mitotic rate, and ulceration (P = 0.02, 0.02, and 0.002, respectively), specifically in coding regions impacting on CDKN2B and P14ARF and CDKN2A. Loss at MTAP (P = 0.05) and the interferon gene cluster (P = 0.03) on 9p21 was also associated with tumor ulceration. There was no association between reduced gene dosage at 9p21.3 and subtype or site of tumor. This study presents supportive evidence that CDKN2B, P14ARF, and CDKN2A may all play a tumor suppressor role in melanoma progression. © 2010 Wiley-Liss, Inc.
INTRODUCTION
The AJCC staging system for melanoma utilizes the Breslow thickness of primary melanoma, the presence of ulceration, and staging by sentinel node biopsy to give the best estimate of prognosis (Balch et al.,2001). Use of the staging system is associated with a range of estimates of outcome (Balch et al.,2001; Gimotty et al.,2005), so that a significant proportion of the variance in survival remains unexplained. Therefore, it is important to seek molecular markers of metastatic potential for use in clinical practice. In recent years, progress has taken place in understanding the somatic events that occur in melanoma primary tumors. However, there is comparatively little known of the correlation between these events and outcome, and it is therefore important to increase our understanding of the carcinogenetic process so that logical approaches to treatment can be developed.
A number of signal transduction and cell cycle regulatory pathways have been implicated in the etiology and progression of melanoma, including the retinoblastoma (RB1) and p44/42 mitogen-activated protein kinase (MAPK) pathways. A key region is 9p21.3, which contains the CDKN2A and CDKN2B genes. These genes encode three separate tumor suppressor proteins. CDKN2A encodes both CDKN2A and, using a separate first exon and alternate reading frame, P14ARF. Although both transcripts use exons 2 and 3 of CDKN2A, the CDKN2A and P14ARF proteins share no homology at the amino acid level and have distinct tumor suppressor functions in the RB1 and TP53 pathways; CDKN2B encodes CDKN2B, which has its own open reading frame (Sharpless and DePinho,1999; Weber et al.,1999). The CDKN2A protein controls passage through the G1 checkpoint of the cell cycle by inhibiting the phosphorylation of the RB1 protein (Roussel,1999) and of the three tumor suppressors at this locus is the one longest recognized to have a significant role in melanoma. It is known to play a key role in normal melanocyte senescence (Ha et al.,2008). The P14ARF protein acts on the TP53 cell cycle control pathway by interaction with the human double minute (HDM2) protein to stabilize TP53 and allow cell cycle arrest at the G1/G2 phase (Weber et al.,1999). CDKN2A was identified first as a tumor suppressor gene commonly deleted/mutated in tumor cell lines (Kamb et al.,1994a) and subsequently its role as a high-risk susceptibility gene in melanoma families was elucidated (Kamb et al.,1994b). Germline mutations have been identified in ∼20% of tested melanoma families (Goldstein and Tucker,2001; Bishop et al.,2002). Some mutations impact on CDKN2A protein alone, some on P14ARF, and some on both proteins.
Most melanoma cell lines show deletion/mutation of CDKN2A (Flores et al.,1996; Walker et al.,1998). The majority of primary tumors have allelic loss at microsatellite markers mapping to the CDKN2A locus, indicating that deletions are the principal genetic event in vivo (Flores et al.,1996; Rodolfo et al.,2004). More recent reports showed biallelic deletion in ∼45% of melanoma metastases, supporting the role of this locus in melanoma progression (Grafstrom et al.,2005) and we have shown that epigenetic silencing of P14ARF is also common in metastatic disease (Freedberg et al.,2008). There are few data from primary tumors on the role of deletion at the locus on outcome (Koynova et al.,2007) and none on the effect of deletion across the larger region, which we have addressed using Multiplex ligation-dependent probe amplification (MLPA) (Nygren et al.,2005) rather than by studying the small intragenic regions previously reported.
More recently there has been some suggestion that CDKN2B may also have tumor suppressor functions in melanoma. Krimpenfort et al. (2007) showed that mice null for CDKN2B, CDKN2A, and P14ARF were more tumor prone than CDKN2A/P14ARF null mice and developed a predominance of skin tumors (Krimpenfort et al.,2007). The authors suggested that CDKN2B might act as critical “back up” tumor suppressor in cells null for CDKN2A.
Activating mutations of the NRAS and BRAF genes occur in ∼20 and 50% of malignant melanomas respectively, and are almost always mutually exclusive (Omholt et al.,2003; Garnett and Marais,2004). BRAF and NRAS mutations have also been found in benign nevi (Poynter et al.,2006) and are therefore thought to be involved early in melanoma carcinogenesis. In cultured human melanocytes, mutant BRAF protein has been shown to induce cell senescence by increasing the expression of CDKN2A (Michaloglou et al.,2005). It is postulated, therefore, that to become an invasive melanoma, arrest of the cell cycle caused by normal CDKN2A must subsequently be overcome by mutation or deletion of CDKN2A or by alterations to other cell cycle regulators. Moreover, a recent in vitro study showed that simultaneous knockdown of BRAF and expression of CDKN2A in melanoma cells led to potent growth inhibition and apoptosis, whereas knockdown of BRAF or expression of CDKN2A alone did not (Zhao et al.,2008). Studies of BRAF mutated nevi using the senescence marker SA-β-gal, however, revealed a marked mosaic induction of CDKN2A, which the authors suggested was indicative of a role for multiple tumor suppressors in the prevention of BRAF oncogenesis (Michaloglou et al.,2005).
In this study, we have investigated the gene dosage of multiple tumor suppressors at 9p21 in formalin-fixed, paraffin-embedded (FFPE) primary melanoma tumors. Furthermore, we have investigated the relationship between reduced gene dosage at the CDKN2A locus and BRAF/NRAS mutations using tumors from patients who have relapsed and from patients with similar tumors who have not relapsed, to determine the prognostic value of these events. The presence of ulceration is an important prognostic factor for melanoma even in stage III or metastatic disease (Balch et al.,2001) and, therefore, we also assessed the associations between CDKN2A deletion and BRAF/NRAS mutation and ulceration. In other series, mitotic rate has important prognostic significance (Elder and Murphy,2008), and therefore, we also examined genetic markers in relation to mitotic rate. CDKN2A is a cyclin D kinase (CDK) inhibitor and therefore loss of CDKN2A would likely be related to increased mitotic rate.
The methylthioadenosine phosphorylase (MTAP) gene is also located at 9p. It has been suggested that loss of expression of the gene has prognostic implications for melanoma (Behrmann et al.,2003) and codeletion of MTAP with CDKN2A has been investigated in a number of cancers (Chen et al.,1996). There is evidence that loss of MTAP results in an inhibition of STAT signalling pathways regulated by interferon, so it is of interest that response of melanoma patients to interferon used as an adjuvant therapy for this cancer has been reported to be related to MTAP status (Wild et al.,2007). We were able in this study to look at deletion of MTAP in primary melanomas.
MATERIALS AND METHODS
Patients
Ethical approval for this study was obtained from the Multi-Regional Ethical Committee (MREC) and from the patient information advisory group (PIAG) and all living patients gave informed written consent to the use of their stored tissues for research. Melanoma cases had all been diagnosed at least 3 years previously. Recruitment was irrespective of family history. Cases were then eligible as “relapsers” if relapse occurred after 3 years or as “nonrelapsers” if they were free of relapse. Participants had a tumor thickness greater than 0.75 mm and were recruited between May 2000 and January 2005. Full details of the study were reported previously (Beswick et al.,2008). There were 424 patients eligible for the study, of which 66% (278) participated. The median Breslow thickness was 1.6 mm (range 0.8-20). From the 278 participating patients, 116 (74 relapsers and 42 nonrelapsers) had FFPE primary tumor samples that were available for further sampling and DNA extraction. There was no selection of these blocks, other than that we used blocks which could be traced.
Histology
Sections from the primary tumors were examined (blind to relapse status) by one pathologist according to protocol (AB). The following were recorded: Breslow thickness, site of the primary tumor, histological sub-type, presence of ulceration, and mitotic rate in three categories (0, 1 to 6 and more than 6 per mm2).
DNA Extraction
DNA was extracted from 116 FFPE primary melanoma tumors, sampled horizontally at the advancing edge of the tumor, in the vertical growth phase, using a 0.8 mm × 2 mm core biopsy needle and haematoxylin and eosin stained slides as a guide. The intent was to choose tissue representative of the deepest part of the tumor but which was sufficiently surrounded by tumor that the sample contained minimal normal stroma and inflammatory cell infiltrate. Horizontal sections of cores were taken during development of the methodology to ensure the technique allowed minimal sampling of normal tissue as described previously (Conway et al.,2009). DNA extraction from cores was carried out using the QIAamp DNA Mini kit (Qiagen, Sussex, UK) (Conway et al.,2009).
Copy Number Analysis of Chromosome 9p21
Gene dosage ratios for 12 CDKN2A/CDKN2B locus sites and 11 other 9p gene sites were determined using the 9p21 MLPA kit (P024 MRC-Holland, Amsterdam, the Netherlands) (Schouten et al.,2002). The genes included in this screen were TEK, ELAV2, CDKN2B, CDKN2A, MTAP, KIAA1354, INFW1, INFB1, MLLT3, and DOCK8 (Fig. 1A). The kit was used in accordance with instructions for all experiments but in 1/4 volumes of those recommended by the supplier, based on previous optimization in our laboratory: 30–100 ng of extracted tumor DNA was denatured and target gene probes were hybridized to the target DNA prior to probe ligation in the presence of ligase-65. The ligation products were subject to polymerase chain reaction (PCR) amplification performed on a GeneAmp PCR System 9700 Thermal Cycler (Applied Biosystems, Warrington, UK) with a hot-start PCR program. MLPA fragments were visualized on an ABI 3130XL Automated DNA Sequencer with a 36 cm capillary array, ABI POP-7 polymer, and GeneScan-ROX 500 size standards (Applied Biosystems). Peak detection analysis has been automated using ABI PRISM Genescan® Analysis software version 3.1 (Applied Biosystems) and GeneMarker software (Softgenetics, State College, Pennsylvania, USA). In each set of experiments, one negative control (no DNA) sample and four normal control samples (human genomic DNA with normal gene dosage at 9p from four different individuals) were included.
Figure 1.
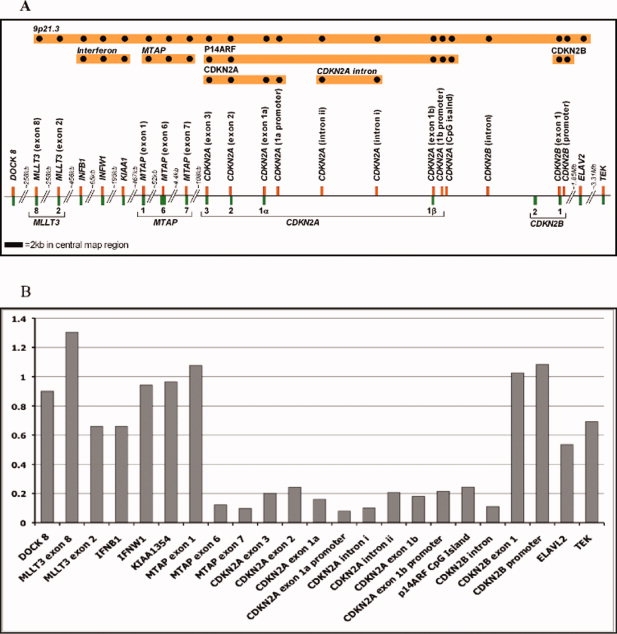
MLPA for analysis of gene dosage at chromosome 9p21. A, a diagrammatical representation of the 9p21 region covered by the P024A MLPA kit. Locations of probed genes are shown in green and MLPA probes in orange with probe names outlined in bold. Probe groupings used in data analysis are represented by orange bars with black dots at top of the picture. B, gene dosage ratios for a representative primary melanoma sample showing an almost total loss of gene dosage (representing ≥80% loss) from MTAP exon 6 to CDKN2B intron.
MLPA Data Analysis
Gene dosage analysis was automated using the MLPA analysis program included with GeneMarker software version 1.6 (Softgenetics, Pennsylvania, USA) according to the manufacturer's instructions. Data were normalized using the “population normalization” mode (as recommended by the MLPA kit manufacturers for analysis of tumor DNA). Peak heights were normalized according to the median height of all test and control peak heights of similar fragment size. Normalized peak heights were then compared to a synthetic control sample (average of peak heights from four human genomic DNA samples with normal gene dosage at 9p) with default analysis parameters to determine gene dosage ratios where the median point within the data set is considered to be 1, and a gene dosage ratio for each probe region was calculated with reference to the synthetic control (Fig. 1B). In previous publications using MLPA on FFPE-derived DNA, gene dosage cut-offs of 0.7 for loss and 1.3 for gain have been used according to manufacturer's instructions (van Dijk et al.,2005; Takata,2008; Buffart et al.,2009) (and author correspondence with MRC-Holland). In our analysis, gene dosage was treated as a continuous variable to account for the effect of any possible contaminating normal DNA.
Mutation Analyses
Gene fragments of hotspot mutation regions in BRAF (exon 15) and NRAS (exon 2) were amplified by PCR in separate reactions to screen for common mutations found in melanomas. Standard PCR reactions were carried out using Amplitaq Gold DNA polymerase in 1× PCR buffer (Applied Biosystems) according to manufacturer's instructions. Primers: BRAF exon 15 Forward: 5′-TCA TAATGCTTGCTCTGATAGGA and Reverse: 5′-GGCCAAAAATTTAATCAGTGGA (annealing temperature 59°C); and NRAS exon 2 Forward: 5′-GGTGAAACCTGTTTGTTGGA and Reverse: 5′-TTCAGAACACAAAGATCATC (55°C).
BRAF and NRAS PCR products were sequenced in both directions using an ABI3100 Automated DNA Sequencer with a 36 cm capillary array, ABI POP-7 polymer and ABI Prism BigDye Terminator Cycle Sequencing Kit version 1.1 (Applied Biosystems) according to the manufacturer's instructions. Sequence analysis was carried out using CodonCode Aligner sequencing software (CodonCode Corporation, Dedham, MA, USA) and mutation detection was based on BRAF and NRAS cDNA sequences (Genbank accession nos. NM_004333 and NM_00254, respectively).
CDKN2A Immunohistochemistry
A representative set of 17 tumors from the MLPA data set were selected for immunohistochemistry using antibodies to CDKN2A to evidence the validity of the MLPA results. The samples chosen consisted of four samples with gene dosage ratios of ≤0.2 (80% gene dosage loss) at the CDKN2A promoter, or coding regions for CDKN2A; seven samples with gene dosage ratios ∼0.5 (50% gene dosage loss) at the CDKN2A promoter, coding regions for CDKN2A or intronic regions upstream of the promoter; and six samples with gene dosage ratios between 0.7 and 1.3 (normal gene dosage). Positive and negative controls for kit and antibody performance were included. The positive control was a paraffin-embedded section of bladder carcinoma with high CDKN2A expression determined by Western blot analysis. The negative control was a section from the same bladder tumor without the addition of primary antibody.
Sections (5 μm) were cut and fixed on Superfrost plus glass slides before dewaxing and rehydration. Expression of CDKN2A was examined using a CDKN2A monoclonal antibody (1:1500 for 1 hr; Ab-7; Labvision, Freemont, CA, USA) and the catalyzed signal amplification system (CSA system; DakoCytomation, Cambridgeshire, UK) according to the manufacturer's instructions. Endogenous biotin or biotin-binding proteins were blocked using the Avidin Biotin blocking kit (Vector Laboratories, Peterborough, UK) according to manufacturer's instructions and endogenous peroxidase activity was blocked using 3% hydrogen peroxide in water for 5 min (CSA system). Sections were counterstained with hematoxylin, dehydrated and mounted in Depex mounting medium (VWR International, Leicestershire, UK). Expression of CDKN2A was examined by light microscopy and scored in tumors as absent (0), expressed (1) or highly expressed (2).
Statistical Methods
Gene dosage was treated as a continuous variable in the analysis (Fig. 1). To investigate the effect of dosage in relation to each of the transcripts at 9p21, five separate probe groups were created. Probe groups contained all probes located within the coding exons and promoter for each transcript. The probe groups were: (1) CDKN2B (probes: CDKN2B promoter and exon 1), (2) regions coding for P14ARF (probes: CDKN2A CpG island, CDKN2A 1β promoter and exons 1β, 2, and 3), (3) CDKN2A (probes: CDKN2A 1α promoter and exons 1α, 2, and 3), (4) MTAP (probes: MTAP exons 1, 6, and 7), and (5) the interferon gene cluster (probes: KIAA1354 [between IFNA5 and IFNA6], INFW1, and INFB1). A “CDKN2A” group containing all CDKN2A probes was created to investigate the effect of overall loss at the CDKN2A locus (probes: CDKN2A CpG island, CDKN2A 1β promoter, exon 1β, CDKN2A introns 1 and 2, CDKN2A 1α promoter plus exons 1α, 2 and 3). To investigate the effect of loss across the whole 9p21.3 region, an overall 9p21.3 group defined by all of the probes in the region was also considered. Median gene dosage ratio was used to represent the overall gene dosage ratio of the region where there was more than one probe within the region.
A rolling average heatmap was used to represent graphically the overall gene loss. The rolling average of the gene dosage was calculated as the average gene dosage ratio of the probe itself and adjacent probes. The Wilcoxon two-sample rank test using normal approximation was performed to assess the difference between gene dosage ratio by relapse status (relapse versus no relapse), ulceration status (yes versus no), tumor site (head/neck/foot/hand versus others) and BRAF and NRAS mutation status. The Kruskal Wallis test was applied to assess the difference between tumor histological sub-type (superficial spreading versus nodular) and mitotic rate per mm2 (grouped as 0, 1–6, >6). Spearman correlations (r) were used to assess association between gene dosage ratio and Breslow thickness. Fisher's exact test was used to assess the association between BRAF/NRAS mutation and relapse status, mitotic rate and ulceration. These analyses were carried out using the SAS/STAT statistical software version 9.1 for PC (Copyright, SAS Institute Inc. Cary, NC, USA). The rolling average heatmap was illustrated using heatmap.2<gplots> function in R version 2.9.0 (Vienna, Austria).
RESULTS
Samples
In total, 116 primary tumor blocks from 116 patients (74 relapsers and 42 non-relapsers) were sampled for DNA extraction and molecular analysis. The median DNA concentration was 28 ng/μl (range 4–493 ng/μl) with elution volumes of 25 μl resulting in a median total yield of 0.7 μg/tumor. The median tumor block age was 11 years (range 5-36 years). From the 116 tumor blocks sampled, 50 produced DNA of sufficient quality for both MLPA and BRAF/NRAS analysis, 25 produced results for MLPA only, 21 produced results for BRAF/NRAS only and 20 did not produce any results. Therefore, the success rate for MLPA was 65% (75/116) and that for BRAF/NRAS was 61% (71/116). There was no significant difference in the distribution of block age between samples with a MLPA result (median 10 years, range 5–36) and those that failed (median 12 years, range 5–24), P = 0.3 (Wilcoxon rank test). The strongest predictor of assay success was DNA quantity. Failure was much more likely to occur in assays with <100 ng DNA input (44% fail rate at <100 ng DNA compared to 17% fail rate at >100 ng DNA), according to the DNA quantity control peaks within each MLPA assay.
Gene Dosage at 9p21
Gene dosage at 9p21 was successfully measured in 75 vertical growth phase primary melanomas (48 relapsers and 27 non-relapsers) using MLPA. Gene dosage ratios for 12 CDKN2A/CDKN2B locus sites and 11 other 9p gene sites were determined. Reduced gene dosage was more frequent in relapsers (Fig. 2). It can be seen that although loss of gene dosage occurred across 9p (especially in relapsers) the most common region of loss was between CDKN2A exon 1α (coding for CDKN2A) and MTAP. The median gene dosage at eight key regions across 9p, and their association with relapse or histological indicators of poor prognosis are presented in Table 1. Relapse was associated with loss at 9p21.3 overall (P = 0.04) and loss in regions coding for CDKN2A (one sided P = 0.03, two sided P = 0.05), and (borderline) associated with loss anywhere in the CDKN2A region (from CDKN2A CpG island probe to CDKN2A exon 3 probe) (one-sided P = 0.05, two-sided P = 0.1) but not elsewhere across 9p.
Figure 2.
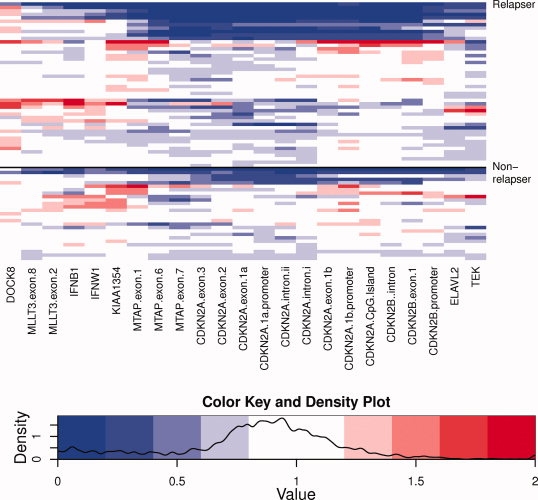
Heatmap of gene dosage at chromosome region 9p21 by relapse status. Gene dosage ratios are shown for tumors from 45 relapsed patients (above) compared with tumors from 27 patients who had not relapsed. Blue coloration indicates reduced gene dosage, red coloration indicates increased gene dosage.
TABLE 1.
Median Gene Dosage by Probe Categories and Indicators of Relapse
| Y = yes N = no | Total numbers | CDKN2B | CDKN2B (Intron) | CDKN2A p14ARF | CDKN2A p16 Intron | CDKN2A p16 | All probes within CDKN2A | MTAP | Interferon | 9p21.3 | |
|---|---|---|---|---|---|---|---|---|---|---|---|
| Relapse | Y | 48 | 0.92 | 0.74 | 0.94 | 0.67 | 0.76 | 0.82 | 0.71 | 0.86 | 0.85 |
| N | 27 | 0.88 | 0.78 | 0.98 | 0.77 | 0.84 | 0.91 | 0.77 | 0.90 | 0.90 | |
| P-value (one-sided) | 0.47 | 0.47 | 0.10 | 0.06 | 0.03 | 0.05 | 0.26 | 0.13 | 0.04 | ||
| Ulceration | Y | 29 | 0.77 | 0.67 | 0.82 | 0.67 | 0.70 | 0.77 | 0.67 | 0.84 | 0.81 |
| N | 46 | 0.96 | 0.78 | 0.98 | 0.73 | 0.82 | 0.91 | 0.77 | 0.90 | 0.92 | |
| P-value (one-sided) | 0.006 | 0.04 | 0.002 | 0.11 | 0.02 | 0.02 | 0.05 | 0.03 | 0.002 | ||
| Breslow thickness | <2 mm | 18 | 1.04 | 0.86 | 0.97 | 0.75 | 0.84 | 0.91 | 0.8 | 0.89 | 0.92 |
| >2<4 mm | 30 | 0.90 | 0.74 | 0.97 | 0.70 | 0.84 | 0.86 | 0.77 | 0.90 | 0.88 | |
| >4mm | 27 | 0.79 | 0.67 | 0.84 | 0.70 | 0.76 | 0.77 | 0.67 | 0.83 | 0.81 | |
| rs (P-value)* | −0.31 (0.007) | −0.14 (0.22) | −0.29 (0.01) | −0.06 (0.58) | −0.28 (0.01) | −0.24 (0.04) | −0.19 (0.11) | −0.11 (0.34) | −0.27 (0.02) | ||
| Mitotic rate | 0/ mm2 | 3 | 1.11 | 0.92 | 1.01 | 0.92 | 0.99 | 0.99 | 0.82 | 0.59 | 0.96 |
| 1–6/ mm2 | 52 | 0.93 | 0.77 | 0.97 | 0.72 | 0.81 | 0.91 | 0.75 | 0.89 | 0.89 | |
| >6/ mm2 | 20 | 0.59 | 0.64 | 0.67 | 0.57 | 0.55 | 0.64 | 0.69 | 0.84 | 0.80 | |
| P-value** | 0.02 | 0.28 | 0.0006 | 0.28 | 0.004 | 0.005 | 0.37 | 0.12 | 0.02 | ||
| Tumour site | Head/neck/ hand/foot | 15 | 1.06 | 0.74 | 1.00 | 0.85 | 0.80 | 0.84 | 0.69 | 0.88 | 0.88 |
| Other | 60 | 0.90 | 0.76 | 0.93 | 0.69 | 0.78 | 0.85 | 0.76 | 0.88 | 0.87 | |
| P-value (one-sided) | 0.12 | 0.21 | 0.26 | 0.30 | 0.49 | 0.42 | 0.24 | 0.08 | 0.47 | ||
| Melanoma type (Wilcoxon two-sample tests were made between nodular and superficial spreading melanomas) | Acral Lentiginous | 2 | 0.44 | 0.37 | 0.76 | 0.53 | 0.61 | 0.62 | 0.44 | 0.67 | 0.58 |
| Desmoplastic | 1 | 1.10 | 0.73 | 0.82 | 1.02 | 0.80 | 0.83 | 0.69 | 0.97 | 0.97 | |
| Indeterminate | 3 | 1.06 | 0.11 | 0.22 | 0.10 | 0.18 | 0.20 | 0.12 | 0.97 | 0.23 | |
| Nodular | 28 | 0.88 | 0.78 | 0.93 | 0.72 | 0.77 | 0.81 | 0.67 | 0.88 | 0.83 | |
| Superficial- Spreading | 41 | 0.96 | 0.77 | 0.96 | 0.70 | 0.82 | 0.91 | 0.77 | 0.87 | 0.90 | |
| P-value (one-sided) | 0.09 | 0.31 | 0.15 | 0.28 | 0.17 | 0.59 | 0.32 | 0.81 | 0.09 | ||
| BRAF mutation | Y | 25 | 0.93 | 0.75 | 0.93 | 0.65 | 0.82 | 0.85 | 0.77 | 0.87 | 0.89 |
| N | 33 | 0.90 | 0.70 | 0.93 | 0.72 | 0.70 | 0.82 | 0.68 | 0.9 | 0.82 | |
| P-value (one-sided) | 0.13 | 0.45 | 0.36 | 0.44 | 0.06 | 0.16 | 0.04 | 0.49 | 0.13 | ||
| NRAS mutation | Y | 6 | 0.94 | 0.78 | 1.01 | 0.66 | 0.67 | 0.91 | 0.72 | 1.02 | 0.85 |
| N | 45 | 0.94 | 0.75 | 0.95 | 0.75 | 0.79 | 0.85 | 0.71 | 0.87 | 0.88 | |
| P-value (one-sided) | 0.28 | 0.40 | 0.41 | 0.31 | 0.38 | 0.37 | 0.40 | 0.05 | 0.39 | ||
| BRAF or NRAS mutation | Y | 31 | 0.93 | 0.75 | 0.94 | 0.65 | 0.82 | 0.89 | 0.77 | 0.90 | 0.89 |
| N | 19 | 0.90 | 0.73 | 0.93 | 0.73 | 0.73 | 0.82 | 0.68 | 0.84 | 0.83 | |
| P-value (one-sided) | 0.37 | 0.46 | 0.37 | 0.49 | 0.16 | 0.12 | 0.02 | 0.29 | 0.14 |
The statistical test used was the Wilcoxon two-sample test, unless otherwise stated (*Spearman correlation, **Kruskal-Wallis test).
Loss anywhere in the CDKN2A region was associated with ulceration (P = 0.002). However, ulceration of the tumor was most significantly associated with reduced gene dosage at CDKN2B (one sided test P = 0.006, two sided P = 0.01) and regions coding for P14ARF (one sided P = 0.002, two sided P = 0.004). There was some evidence of an association between ulceration and reduced gene dosage at CDKN2A coding for CDKN2A, MTAP, and the interferon gene cluster (Table 1).
Relative loss across the region was associated with increasing tumor thickness (Fig. 3). Spearman correlation coefficients are given for thickness and reduced gene dosage across the CDKN2A region (Table 1). The most significant correlation was with reduced gene dosage at CDKN2B (P = 0.007 one-sided test) but there was some association across 9p21.3 (P = 0.02). To summarize, at 9p increasing thickness correlated with loss impacting on the coding regions of CDKN2B, CDKN2A, but not with loss in intronic regions of CDKN2A, MTAP or the interferon gene cluster. Increased mitotic rate was associated with reduced gene dosage across CDKN2A and especially in regions coding for P14ARF and CDKN2A (one sided P = 0.0006 and 0.004, respectively). There was no association between reduced gene dosage at 9p and tumor site or melanoma subtype (Table 1).
Figure 3.
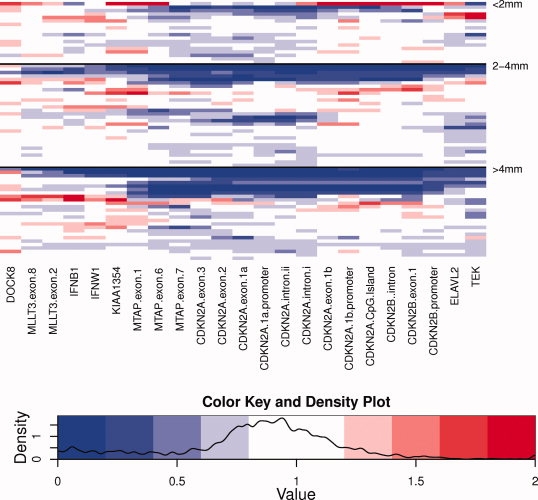
Heatmap of gene dosage at chromosome region 9p21 by Breslow thickness. Gene dosage ratios are shown for 18 tumors with Breslow thickness <2 mm (above), 30 tumors with Breslow thickness 2–4 mm (middle) and 27 tumors of thickness >4 mm. Blue coloration indicates reduced gene dosage, red coloration indicates increased gene dosage.
There was no significant association between BRAF and NRAS mutation status and reduced gene dosage in the CDKN2A/CDKN2B regions with the Wilcoxon Two-Sample test, but there was a trend toward an association between the presence of BRAF mutations and loss at regions coding for CDKN2A (one sided P = 0.06, two sided P = 0.12). The absence of BRAF mutation was associated with reduced gene dosage at MTAP (one sided P = 0.04, two sided P = 0.09) and the absence of an NRAS mutation was (borderline) associated with reduced gene dosage at the interferon gene cluster (one sided P = 0.05, two sided P = 0.10).
BRAF and NRAS Mutations
Seventy-one tumors were successfully assayed for common mutations activating the MAPK pathway in melanoma, i.e., BRAF exon 15 and NRAS exon 2 mutations. Seventy-seven percent of relapsers had NRAS/BRAF mutation compared with 58% of nonrelapsers (Fisher's exact P = 0.17). There was no association between NRAS/BRAF mutation and mitotic rate or presence of ulceration (Fisher's exact P = 0.42), nor with thickness (P = 0.97). 71% of non-acral tumors had a mutation compared with 50% of acral tumors (P = 0.25). There were a slightly higher proportion of superficial spreading tumors than nodular tumors with a mutation (78 and 60%, respectively).
Expression of CDKN2A in Primary Melanomas
High specificity of staining was achieved in the control sections, where in the absence of primary antibody only haematoxylin staining is observed (Fig. 4A). In the presence of primary antibody, intense nuclear and cytoplasmic staining was observed for CDKN2A in some samples (Fig. 4B). In the 17 melanomas tested, the staining pattern varied from absent to strong cytoplasmic and nuclear staining. The level of positive expression of CDKN2A was associated with MLPA results of gene dosage in CDKN2A coding regions for CDKN2A in the majority of tumors (13/17) (Table 2). In the four samples with 80% gene dosage loss, there was a complete absence of CDKN2A expression in the region sampled for DNA extraction (Fig. 4C). In the seven samples with 50% gene dosage loss of the intronic, promoter or coding regions of CDKN2A, there was moderate or absent CDKN2A expression in four samples, while the remaining three showed strong CDKN2A expression. In the six samples that showed normal gene dosage at CDKN2A 5/6 showed strong to moderate CDKN2A expression (Fig. 4D) and one showed no expression of CDKN2A.
Figure 4.
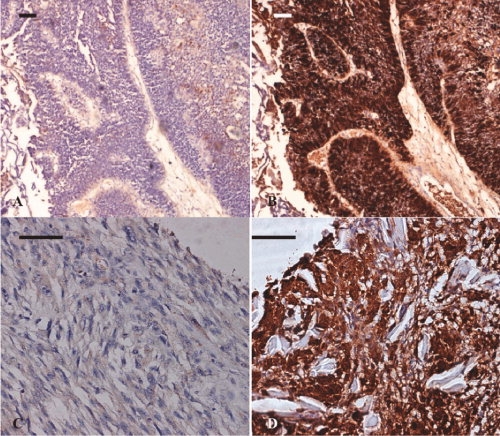
Immunohistochemistry of CDKN2A in primary tumors. (A) Bladder tumor control minus primary antibody. Some nonspecific stromal staining is visible in the stroma. (B) Strong specific cytoplasmic and nuclear staining in a bladder positive control in presence of primary antibody. (C) Results from representative tumors show very low cytoplasmic staining of CDKN2A from a tumor with a large homozygous deletion of CDKN2A. (D) Strong nuclear and cytoplasmic staining of CDKN2A and unstained normal stromal cells from a tumor which retained 2 copies of CDKN2A. Scale bar = 25 μm.
TABLE 2.
Summary of CDKN2A Protein Expression Results Determined by Immunohistochemistry
| Sample | Relapse | CDKN2A gene dosage | CDKN2A expression |
|---|---|---|---|
| 1 | N | ≥ 80% loss intron/promoter | 0 |
| 2 | Y | ≥ 80% loss whole gene | 0 |
| 3 | Y | ≥ 80% loss whole gene | 0 |
| 4 | Y | ≥ 80% loss whole gene | 0 |
| 5 | Y | 50% loss promoter | 2 |
| 6 | N | 50% loss intron | 0 |
| 7 | N | 50% loss intron/gene | 1 |
| 8 | N | 50% loss gene | 2 |
| 9 | N | 50% loss intron | 2 |
| 10 | Y | 50% loss intron | 0 |
| 11 | Y | 50% loss intron/promoter | 0 |
| 12 | Y | Normal | 2 |
| 13 | N | Normal | 2 |
| 14 | N | Normal | 0 |
| 15 | N | Normal | 2 |
| 16 | Y | Normal | 2 |
| 17 | Y | Normal | 1 |
Intensity of staining was scored as absent (0), expressed (1), or highly expressed (2). CDKN2A gene dosage determined by MLPA analysis is shown for each tumor sample.
DISCUSSION
We have examined the role of BRAF and NRAS mutations and reduced gene dosage at 9p in melanoma relapse. The study was carried out using formalin-fixed paraffin-embedded (FFPE) tumors because of the difficulties in accessing cryopreserved primary tumors; melanomas are generally too small to allow cryopreservation. In the study, 65% of tumors sampled yielded enough DNA for MLPA screening and 61% were successfully sequenced for BRAF/NRAS mutations.
The observation that the MLPA and sequencing failure rate was higher in samples with lower DNA quantity indicates a potential for bias toward successful sampling of thicker, poorer prognosis tumors. However, failure rate was comparable in both relapse and nonrelapse groups, and over 40% low DNA input samples gave reliable results.
We found deletion (reduced gene dosage) at the CDKN2A locus to be common in primary melanoma. This is consistent with previous studies which have shown that deletion at CDKN2A appears to be the major mechanism of CDKN2A inactivation in primary melanomas (Funk et al.,1998; Fujimoto et al.,1999; Rizos et al.,1999; Cachia et al.,2000; Straume et al.,2002; Zhang and Rosdahl,2004). We did not screen for mutations as previous studies have consistently shown small sequence alterations to be uncommon (Ruiz et al.,1998; Cachia et al.,2000). Epigenetic silencing of CDKN2A by methylation (Gonzalgo et al.,1997; von Eggeling et al.,1999; Straume et al.,2002) could not be investigated in this study due to constraints on DNA availability from small tumors. However, protein expression of CDKN2A by immunohistochemistry correlated well with gene dosage ratios as determined by MLPA in the majority of tumors investigated, and is consistent with the view that deletion remains the dominant method of CDKN2A silencing in primary melanoma.
Reduced gene dosage impacting on CDKN2A was predictive of relapse. Loss impacting on P14ARF was, however, more strongly associated with poor prognostic factors such as increased Breslow thickness but particularly with mitotic rate and ulceration, than was loss impacting on CDKN2A. This suggests that loss of P14ARF has a key role in the progression of melanoma. This is consistent with our recent work in metastases, which demonstrated the loss of P14ARF by methylation or deletion to be common in metastases (Freedberg et al.,2008). This is the first study to report on loss across the critical region of 9p in primary melanoma, although loss of CDKN2A coding for CDKN2A has been suggested by others to be associated with poorer prognosis (Cachia et al.,2000; Grafstrom et al.,2005) and loss of CDKN2A expression immunohistochemically correlates with histological invasion (Talve et al.,1997; Pavey et al.,2002). Furthermore, the study suggests that within vertical growth phase melanoma, although loss impacting on CDKN2A was most frequent, wider deletions involving P14ARF and even CDKN2B were associated with poorer histological prognostic factors. Loss of CDKN2A is a common occurrence even in early melanoma (Tran et al.,2002). It is perhaps not surprising then, that further loss of the second melanoma tumor suppressor gene at 9p (P14ARF) impacts on outcome. There is in vitro evidence for a tumor suppressive role for CDKN2B in melanoma (Ha et al.,2008; Peters,2008; Schlegel et al.,2009). That reduced gene dosage impacting on CDKN2B also correlates with poor histological characteristics is supportive of the view that it too may play a role in tumor suppression in melanocytes.
One previous study has suggested that BRAF and NRAS mutations are less common in primary tumors with allelic loss on 9p (Kumar et al.,2003), and other studies using microsatellite markers located in the CDKN2A locus showed both BRAF/NRAS mutation and LOH at CDKN2A (Rodolfo et al.,2004). We showed no significant association between the presence of either BRAF or NRAS mutations and reduced gene dosage at 9p. Mutations in the BRAF/NRAS genes were not significantly associated with ulceration or Breslow thickness in these tumors. These observations are consistent with the view that these mutations are an early event in melanoma, required for initiation but not involved in progression (Platz et al.,2008), although there is one study which suggested that BRAF and NRAS mutations are more frequent in cells of the vertical growth phase of a melanoma than in the radial growth phase suggesting a selection for cells containing the mutations (Greene et al.,2009). Certainly, BRAF or NRAS mutations present in the primary tumor were found in the majority of associated metastases in another study (Edlundh-Rose et al.,2006). It is likely that secondary events are necessary for metastatic progression in addition to mutations in either BRAF or NRAS, but this could occur through alteration of other tumor suppressor genes or oncogenes not investigated here, such as CDK4, PTEN, and TP53, as well as CDKN2A. As only melanomas with wild-type BRAF have amplified CDK4 and cyclin D1 genes, the CDKN2A-CDK4/6-cyclin D pathway is viewed as linearly downstream of BRAF (Zhao et al.,2008). Inhibition of mutated BRAF using new specific BRAF inhibitors is reported in 2009 (ASCO) to be effective so that whether BRAF is a prognostic marker or not, BRAF driven MAPK pathway activation clearly drives tumor growth in melanoma tumors.
ANRIL, an antisense noncoding RNA, has recently been identified at 9p21.3 (Pasmant et al.,2007). The first exon of ANRIL is located in the CDKN2A P14ARF promoter, and the gene overlaps CDKN2B. There is evidence that ANRIL may influence transcription of the CDKN2A and CDKN2B genes (Jarinova et al.,2009; Liu et al.,2009). The frequency of deletion of ANRIL in primary melanoma tumors could not be investigated in this study as the MLPA assay used does not include probes specific for the ANRIL gene.
Deletion of MTAP is of interest as evidence for reduced expression in poor prognostic tumors has been reported before (Behrmann et al.,2003) and there is some evidence that loss may moderate response to interferon therapy (Wild et al.,2007). In this study, however, we showed no evidence for a role for MTAP in melanoma prognosis. We did see an association between reduced gene dosage at MTAP and the absence of a BRAF mutation, although the significance of this observation remains to be established.
In conclusion, we have identified a high frequency of deletion in the CDKN2A gene in primary melanoma tumors, which supports previous evidence that gene deletion is the major mode of inactivation of CDKN2A and bypass of cell cycle control required for proliferation and progression to metastatic disease in malignant melanoma. Reduced gene dosage at 9p (but not BRAF or NRAS mutation) was associated with histological features predictive of a poorer prognosis. The study also suggests that loss of P14ARF has an additional role in melanoma relapse and possibly also a role for CDKN2B coded by CDKN2B.
Acknowledgments
The authors are grateful to the patients who agreed to take part in these studies. The following clinicians recruited patients to the studies: Dr. W. Tucker—Alexandra Hospital; Prof. D.T. Sharpe—Bradford Royal Infirmary; Mr. I. Foo—BUPA Hospital Elland; Dr. H. Galvin—Calderdale Royal Hospital; Dr. P.C. Lorrigan—Christie Hospital; Dr. M. Middleton—Churchill Hospital; Dr. N. Cox—Cumberland Infirmary; Dr. G. Ford, Dr. G. Taylor—Dewsbury and District Hospital; Mr. A.R. Groves, Mr. R. Matthews—George Eliot Hospital; Dr. A. Layton—Harrogate District Hospital; Dr. M.J. Cheesbrough—Huddersfield Royal Infirmary; Dr. A. Carmichael, Mr. H. Siddiqui, Mr. M. Coady—James Cook University Hospital; Dr. M. Goodfield, Dr. R. Sheehan-Dare, Dr. S.M. Wilkinson, Mr. Browning—Leeds General Infirmary; Dr. J.M. Eremin, Dr. T. Watts—Lincoln County Hospital; Dr. Brunt—Mid Staffordshire General; Mr. P. Baguley—Middlesborough General Hospital; Dr. M. Brunt, Mr. J. Roberts, Mr. P. Davison—North Staffordshire City General; Dr. D. Fyfe—Nottingham City Hospital; Mr. L. Le Roux Fourie, Mr. O.M. Fenton—Pinderfields General Hospital; Dr. S. McDonald-Hull—Pontefract General Infirmary; Dr. Maraveyas—Princess Royal Hospital and Castle Hill Hospital; Dr. N. Steven, Dr. Peake—Queen Elizabeth; Mr. T.E.E. Goodacre—Radcliffe Infirmary; Dr. M.L. Wood—Rotherham District General Hospital; Mr. A. Batchelor, Dr. P. Patel, Mr. H. Peach, Mr. M. Liggington, Mr. S.L. Knight, Mr. S. Kay—St James's University Hospital; Dr. J.A.A. Langtry—Sunderland Royal Hospital; Mr. Sugden—University Hospital Hartlepool; Mr. R.B. Berry, Mr. S. Rao—University Hospital North Durham; Dr. Stewart—Walsall Manor Hospital; Dr. Ilchyshyn—Walsgrave; Mr. P.W. Griffiths; Dr. M. Marples—Weston Park Hospital; Dr. E. Marshall—Whiston Hospital; Dr. Lewis—Worcester Royal Infirmary; Mr. D. Murray—Wordsley Hospital and Selly Oak Hospital; Dr. A.S. Highet—York District Hospital and Scarborough Hospital.
REFERENCES
- Balch CM, Buzaid AC, Soong SJ, Atkins MB, Cascinelli N, Coit DG, Fleming ID, Gershenwald JE, Houghton A, Jr, Kirkwood JM, McMasters KM, Mihm MF, Morton DL, Reintgen DS, Ross MI, Sober A, Thompson JA, Thompson JF. Final version of the american joint committee on cancer staging system for cutaneous melanoma. J Clin Oncol. 2001;19:3635–3648. doi: 10.1200/JCO.2001.19.16.3635. [DOI] [PubMed] [Google Scholar]
- Behrmann I, Wallner S, Komyod W, Heinrich PC, Schuierer M, Buettner R, Bosserhoff AK. Characterization of methylthioadenosin phosphorylase (MTAP) expression in malignant melanoma. Am J Pathol. 2003;163:683–690. doi: 10.1016/S0002-9440(10)63695-4. [DOI] [PMC free article] [PubMed] [Google Scholar]
- Beswick S, Affleck P, Elliott F, Gerry E, Boon A, Bale L, Nolan C, Barrett JH, Bertram C, Marsden J, Bishop DT, Newton-Bishop JA. Environmental risk factors for relapse of melanoma. Eur J. Cancer. 2008;44:1717–1725. doi: 10.1016/j.ejca.2008.05.007. [DOI] [PMC free article] [PubMed] [Google Scholar]
- Bishop DT, Demenais F, Goldstein AM, Bergman W, Bishop JN, Bressac-de Paillerets B, Chompret A, Ghiorzo P, Gruis N, Hansson J, Harland M, Hayward N, Holland EA, Mann GJ, Mantelli M, Nancarrow D, Platz A, Tucker MA. Geographical variation in the penetrance of CDKN2A mutations for melanoma. J Natl Cancer Inst. 2002;94:894–903. doi: 10.1093/jnci/94.12.894. [DOI] [PubMed] [Google Scholar]
- Buffart TE, van Grieken NC, Tijssen M, Coffa J, Ylstra B, Grabsch HI, van de Velde CJ, Carvalho B, Meijer GA. High resolution analysis of DNA copy-number aberrations of chromosomes 8, 13, and 20 in gastric cancers. Virchows Arch. 2009;455:213–223. doi: 10.1007/s00428-009-0814-y. [DOI] [PMC free article] [PubMed] [Google Scholar]
- Cachia AR, Indsto JO, McLaren KM, Mann GJ, Arends MJ. CDKN2A mutation and deletion status in thin and thick primary melanoma. Clin Cancer Res. 2000;6:3511–3515. [PubMed] [Google Scholar]
- Chen ZH, Zhang H, Savarese TM. Gene deletion chemoselectivity: codeletion of the genes for p16(INK4), methylthioadenosine phosphorylase, and the alpha- and beta-interferons in human pancreatic cell carcinoma lines and its implications for chemotherapy. Cancer Res. 1996;56:1083–1090. [PubMed] [Google Scholar]
- Conway C, Mitra A, Jewell R, Randerson-Moor J, Lobo S, Nsengimana J, Edward S, Sanders DS, Cook M, Powell B, Boon A, Elliott F, de Kort F, Knowles MA, Bishop DT, Newton-Bishop J. Gene expression profiling of paraffin-embedded primary melanoma using the DASL assay identifies increased osteopontin expression as predictive of reduced relapse-free survival. Clin Cancer Res. 2009;15:6939–6946. doi: 10.1158/1078-0432.CCR-09-1631. [DOI] [PMC free article] [PubMed] [Google Scholar]
- Edlundh-Rose E, Egyhazi S, Omholt K, Mansson-Brahme E, Platz A, Hansson J, Lundeberg J. NRAS and BRAF mutations in melanoma tumours in relation to clinical characteristics: a study based on mutation screening by pyrosequencing. Melanoma Res. 2006;16:471–478. doi: 10.1097/01.cmr.0000232300.22032.86. [DOI] [PubMed] [Google Scholar]
- Elder DE, Murphy GF. Washington, DC: American Registry of Pathology; 2010. Melanocytic tumors of the skin. in press. [Google Scholar]
- Flores JF, Walker GJ, Glendening JM, Haluska FG, Castresana JS, Rubio MP, Pastorfide GC, Boyer LA, Kao WH, Bulyk ML, Barnhill RL, Hayward NK, Housman DE, Fountain JW. Loss of the p16INK4a and p15INK4b genes, as well as neighboring 9p21 markers, in sporadic melanoma. Cancer Res. 1996;56:5023–5032. [PubMed] [Google Scholar]
- Freedberg DE, Mistry S, Russak J, Gai W, Kaplow M, Osman I, Turner F, Houghton A, Busam K, Bishop T, Bastian B, Bishop J-N, Polsky D. Genetic and epigenetic alteration of p14ARF is frequent in human melanoma metastases. J Natl Cancer Inst. 2008;100:784–795. doi: 10.1093/jnci/djn157. [DOI] [PMC free article] [PubMed] [Google Scholar]
- Fujimoto A, Morita R, Hatta N, Takehara K, Takata M. p16INK4a inactivation is not frequent in uncultured sporadic primary cutaneous melanoma. Oncogene. 1999;18:2527–2532. doi: 10.1038/sj.onc.1202803. [DOI] [PubMed] [Google Scholar]
- Funk JO, Schiller PI, Barrett MT, Wong DJ, Kind P, Sander CA. p16INK4a expression is frequently decreased and associated with 9p21 loss of heterozygosity in sporadic melanoma. J Cutan Pathol. 1998;25:291–296. doi: 10.1111/j.1600-0560.1998.tb01748.x. [DOI] [PubMed] [Google Scholar]
- Garnett MJ, Marais R. Guilty as charged: B-RAF is a human oncogene. Cancer Cell. 2004;6:313–319. doi: 10.1016/j.ccr.2004.09.022. [DOI] [PubMed] [Google Scholar]
- Gimotty PA, Botbyl J, Soong SJ, Guerry D. A population-based validation of the American Joint Committee on Cancer melanoma staging system. J Clin Oncol. 2005;23:8065–8075. doi: 10.1200/JCO.2005.02.4976. [DOI] [PubMed] [Google Scholar]
- Goldstein AM, Tucker MA. Genetic epidemiology of cutaneous melanoma: A global perspective. Arch Dermatol. 2001;137:1493–1496. doi: 10.1001/archderm.137.11.1493. [DOI] [PubMed] [Google Scholar]
- Gonzalgo ML, Bender CM, You EH, Glendening JM, Flores JF, Walker GJ, Hayward NK, Jones PA, Fountain JW. Low frequency of p16/CDKN2A methylation in sporadic melanoma: Comparative approaches for methylation analysis of primary tumors. Cancer Res. 1997;57:5336–5347. [PubMed] [Google Scholar]
- Grafstrom E, Egyhazi S, Ringborg U, Hansson J, Platz A. Biallelic deletions in INK4 in cutaneous melanoma are common and associated with decreased survival. Clin Cancer Res. 2005;11:2991–2997. doi: 10.1158/1078-0432.CCR-04-1731. [DOI] [PubMed] [Google Scholar]
- Greene VR, Johnson MM, Grimm EA, Ellerhorst JA. Frequencies of NRAS and BRAF mutations increase from the radial to the vertical growth phase in cutaneous melanoma. J Invest Dermatol. 2009;129:1483–1488. doi: 10.1038/jid.2008.374. [DOI] [PMC free article] [PubMed] [Google Scholar]
- Ha L, Merlino G, Sviderskaya EV. Melanomagenesis: Overcoming the barrier of melanocyte senescence. Cell Cycle. 2008;7:1944–1948. doi: 10.4161/cc.7.13.6230. [DOI] [PMC free article] [PubMed] [Google Scholar]
- Jarinova O, Stewart AF, Roberts R, Wells G, Lau P, Naing T, Buerki C, McLean BW, Cook RC, Parker JS, McPherson R. Functional analysis of the chromosome 9p21.3 coronary artery disease risk locus. Arterioscler Thromb Vasc Biol. 2009;29:1671–1677. doi: 10.1161/ATVBAHA.109.189522. [DOI] [PubMed] [Google Scholar]
- Kamb A, Gruis NA, Weaver-Feldhaus J, Liu Q, Harshman K, Tavtigian SV, Stockert E, Day RS, III, Johnson BE, Skolnick MH. A cell cycle regulator potentially involved in genesis of many tumor types. Science. 1994a;264:436–440. doi: 10.1126/science.8153634. [DOI] [PubMed] [Google Scholar]
- Kamb A, Shattuck-Eidens D, Eeles R, Liu Q, Gruis NA, Ding W, Hussey C, Tran T, Miki Y, Weaver-Feldhaus J, McClure M, Aitken JF, Anderson DE, Bergman W, Frants R, Goldgar DE, Green A, MacLennan R, Martin NG, Meyer LJ, Youl P, Zone JJ, Skolnick MH, Cannon-Albright L. Analysis of the p16 gene (CDKN2) as a candidate for the chromosome 9p melanoma susceptibility locus. Nat Genet. 1994b;8:23–26. doi: 10.1038/ng0994-22. [DOI] [PubMed] [Google Scholar]
- Koynova D, Jordanova E, Kukutsch N, van der Velden P, Toncheva D, Gruis N. Increased C-MYC copy numbers on the background of CDKN2A loss is associated with improved survival in nodular melanoma. J Cancer Res Clin Oncol. 2007;133:117–123. doi: 10.1007/s00432-006-0150-4. [DOI] [PMC free article] [PubMed] [Google Scholar]
- Krimpenfort P, Ijpenberg A, Song JY, van der Valk M, Nawijn M, Zevenhoven J, Berns A. p15Ink4b is a critical tumour suppressor in the absence of p16Ink4a. Nature. 2007;448:943–946. doi: 10.1038/nature06084. [DOI] [PubMed] [Google Scholar]
- Kumar R, Angelini S, Hemminki K. Activating BRAF and N-Ras mutations in sporadic primary melanomas: An inverse association with allelic loss on chromosome 9. Oncogene. 2003;22:9217–9224. doi: 10.1038/sj.onc.1206909. [DOI] [PubMed] [Google Scholar]
- Liu Y, Sanoff HK, Cho H, Burd CE, Torrice C, Mohlke KL, Ibrahim JG, Thomas NE, Sharpless NE. INK4/ARF transcript expression is associated with chromosome 9p21 variants linked to atherosclerosis. PLoS ONE. 2009;4:e5027. doi: 10.1371/journal.pone.0005027. [DOI] [PMC free article] [PubMed] [Google Scholar]
- Michaloglou C, Vredeveld LC, Soengas MS, Denoyelle C, Kuilman T, van der Horst CM, Majoor DM, Shay JW, Mooi WJ, Peeper DS. BRAFE600-associated senescence-like cell cycle arrest of human naevi. Nature. 2005;436:720–724. doi: 10.1038/nature03890. [DOI] [PubMed] [Google Scholar]
- Nygren AO, Ameziane N, Duarte HM, Vijzelaar RN, Waisfisz Q, Hess CJ, Schouten JP, Errami A. Methylation-specific MLPA (MS-MLPA): Simultaneous detection of CpG methylation and copy number changes of up to 40 sequences. Nucleic Acids Res. 2005;33:e128. doi: 10.1093/nar/gni127. [DOI] [PMC free article] [PubMed] [Google Scholar]
- Omholt K, Platz A, Kanter L, Ringborg U, Hansson J. NRAS and BRAF mutations arise early during melanoma pathogenesis and are preserved throughout tumor progression. Clin Cancer Res. 2003;9:6483–6488. [PubMed] [Google Scholar]
- Pasmant E, Laurendeau I, Heron D, Vidaud M, Vidaud D, Bieche I. Characterization of a germ-line deletion, including the entire INK4/ARF locus, in a melanoma-neural system tumor family: Identification of ANRIL, an antisense noncoding RNA whose expression coclusters with ARF. Cancer Res. 2007;67:3963–3969. doi: 10.1158/0008-5472.CAN-06-2004. [DOI] [PubMed] [Google Scholar]
- Pavey SJ, Cummings MC, Whiteman DC, Castellano M, Walsh MD, Gabrielli BG, Green A, Hayward NK. Loss of p16 expression is associated with histological features of melanoma invasion. Melanoma Res. 2002;12:539–547. doi: 10.1097/00008390-200212000-00003. [DOI] [PubMed] [Google Scholar]
- Peters G. Tumor suppression for ARFicionados: The relative contributions of p16INK4a and p14ARF in melanoma. J Natl Cancer Inst. 2008;100:757–759. doi: 10.1093/jnci/djn156. [DOI] [PubMed] [Google Scholar]
- Platz A, Egyhazi S, Ringborg U, Hansson J. Human cutaneous melanoma: A review of NRAS and BRAF mutation frequencies in relation to histogenetic subclass and body site. Mol Oncol. 2008;1:395–405. doi: 10.1016/j.molonc.2007.12.003. [DOI] [PMC free article] [PubMed] [Google Scholar]
- Poynter JN, Elder JT, Fullen DR, Nair RP, Soengas MS, Johnson TM, Redman B, Thomas NE, Gruber SB. BRAF and NRAS mutations in melanoma and melanocytic nevi. Melanoma Res. 2006;16:267–273. doi: 10.1097/01.cmr.0000222600.73179.f3. [DOI] [PubMed] [Google Scholar]
- Rizos H, Darmanian AP, Indsto JO, Shannon JA, Kefford RF, Mann GJ. Multiple abnormalities of the p16INK4a-pRb regulatory pathway in cultured melanoma cells. Melanoma Res. 1999;9:10–19. doi: 10.1097/00008390-199902000-00003. [DOI] [PubMed] [Google Scholar]
- Rodolfo M, Daniotti M, Vallacchi V. Genetic progression of metastatic melanoma. Cancer Lett. 2004;214:133–147. doi: 10.1016/j.canlet.2004.06.049. [DOI] [PubMed] [Google Scholar]
- Roussel MF. The INK4 family of cell cycle inhibitors in cancer. Oncogene. 1999;18:5311–5317. doi: 10.1038/sj.onc.1202998. [DOI] [PubMed] [Google Scholar]
- Ruiz A, Puig S, Lynch M, Castel T, Estivill X. Retention of the CDKN2A locus and low frequency of point mutations in primary and metastatic cutaneous malignant melanoma. Int J Cancer. 1998;76:312–316. doi: 10.1002/(sici)1097-0215(19980504)76:3<312::aid-ijc4>3.0.co;2-y. [DOI] [PubMed] [Google Scholar]
- Schlegel NC, Eichhoff OM, Hemmi S, Werner S, Dummer R, Hoek KS. Id2 suppression of p15 counters TGF-beta-mediated growth inhibition of melanoma cells. Pigment Cell Melanoma Res. 2009;22:445–453. doi: 10.1111/j.1755-148X.2009.00571.x. [DOI] [PubMed] [Google Scholar]
- Schouten JP, McElgunn CJ, Waaijer R, Zwijnenburg D, Diepvens F, Pals G. Relative quantification of 40 nucleic acid sequences by multiplex ligation-dependent probe amplification. Nucleic Acids Res. 2002;30:e57. doi: 10.1093/nar/gnf056. [DOI] [PMC free article] [PubMed] [Google Scholar]
- Sharpless NE, DePinho RA. The INK4A/ARF locus and its two gene products. Curr Opin Genet Dev. 1999;9:22–30. doi: 10.1016/s0959-437x(99)80004-5. [DOI] [PubMed] [Google Scholar]
- Straume O, Smeds J, Kumar R, Hemminki K, Akslen LA. Significant impact of promoter hypermethylation and the 540 C>T polymorphism of CDKN2A in cutaneous melanoma of the vertical growth phase. Am J Pathol. 2002;161:229–237. doi: 10.1016/S0002-9440(10)64174-0. [DOI] [PMC free article] [PubMed] [Google Scholar]
- Takata M. Detection of copy number changes at multiple loci in DNA prepared from formalin-fixed, paraffin-embedded tissue by multiplex ligation-dependent probe amplification. Methods Mol Biol. 2008;439:101–108. doi: 10.1007/978-1-59745-188-8_7. [DOI] [PubMed] [Google Scholar]
- Talve L, Sauroja I, Collan Y, Punnonen K, Ekfors T. Loss of expression of the p16 (INK4)/cdkn2 gene in cutaneous malignant melanoma correlates with tumor cell proliferation and invasive stage. Int J Cancer. 1997;74:255–259. doi: 10.1002/(sici)1097-0215(19970620)74:3<255::aid-ijc4>3.0.co;2-y. [DOI] [PubMed] [Google Scholar]
- Tran TP, Titus-Ernstoff L, Perry AE, Ernstoff MS, Newsham IF. Alteration of chromosome 9p21 and/or p16 in benign and dysplastic nevi suggests a role in early melanoma progression (United States) Cancer Causes Control. 2002;13:675–682. doi: 10.1023/a:1019599629895. [DOI] [PubMed] [Google Scholar]
- van Dijk MC, Rombout PD, Boots-Sprenger SH, Straatman H, Bernsen MR, Ruiter DJ, Jeuken JW. Multiplex ligation-dependent probe amplification for the detection of chromosomal gains and losses in formalin-fixed tissue. Diagn Mol Pathol. 2005;14:9–16. doi: 10.1097/01.pas.0000146701.98954.47. [DOI] [PubMed] [Google Scholar]
- von Eggeling F, Werner G, Theuer C, Riese U, Dahse R, Fiedler W, Schimmel B, Ernst G, Karte K, Claussen U, Wollina U. Analysis of the tumor suppressor gene p16(INK4A) in microdissected melanoma metastases by sequencing, and microsatellite and methylation screening. Arch Dermatol Res. 1999;291:474–477. doi: 10.1007/s004030050440. [DOI] [PubMed] [Google Scholar]
- Walker GJ, Flores JF, Glendening JM, Lin AH, Markl ID, Fountain JW. Virtually 100% of melanoma cell lines harbor alterations at the DNA level within CDKN2A, CDKN2B, or one of their downstream targets. Genes Chromosomes Cancer. 1998;22:157–163. doi: 10.1002/(sici)1098-2264(199806)22:2<157::aid-gcc11>3.0.co;2-n. [DOI] [PubMed] [Google Scholar]
- Weber JD, Taylor LJ, Roussel MF, Sherr CJ, Bar-Sagi D. Nucleolar Arf sequesters Mdm2 and activates p53. Nat Cell Biol. 1999;1:20–26. doi: 10.1038/8991. [DOI] [PubMed] [Google Scholar]
- Wild PJ, Meyer S, Landthaler M, Hofstaedter F, Bosserhoff AK. A potential predictive marker for response to interferon in malignant melanoma. J Dtsch Dermatol Ges. 2007;5:456–459. doi: 10.1111/j.1610-0387.2007.06303.x. [DOI] [PubMed] [Google Scholar]
- Zhang H, Rosdahl I. Deletion in p16INK4a and loss of p16 expression in human skin primary and metastatic melanoma cells. Int J Oncol. 2004;24:331–335. [PubMed] [Google Scholar]
- Zhao Y, Zhang Y, Yang Z, Li A, Dong J. Simultaneous knockdown of BRAF and expression of INK4A in melanoma cells leads to potent growth inhibition and apoptosis. Biochem Biophys Res Commun. 2008;370:509–513. doi: 10.1016/j.bbrc.2008.03.148. [DOI] [PubMed] [Google Scholar]