Abstract
Objectives
This study aimed to describe national trends in presentation, management, and outcomes for men with high risk prostate cancer.
Methods
Data were abstracted from CaPSURE. 10,808 men were diagnosed between 1990 and 2007 and had complete clinical data. High-risk was defined according to the D'Amico criteria; a more restrictive definition assigned clinical stage T2c to intermediate rather than high risk. Temporal trends were assessed for patient distribution among risk groups, and within the high-risk group for individual risk factors, Kattan nomogram score, Cancer of the Prostate Risk Assessment (CAPRA) score, and primary treatment. Survival analysis stratified by CAPRA score was performed.
Results
31.2% of the men were diagnosed with high-risk disease under the standard definition, and 16.9% under the restrictive definition. This proportion has fallen over time but has been stable since 2000. Patients who would be stratified to high risk under the standard definition and to intermediate risk under the restrictive definition have better outcomes than those stratified to either intermediate or high risk under both definitions. There has been no consistent risk migration within the high risk group over time. Treatment varies substantially with CAPRA score within the high risk group, with higher risk men less likely to receive local therapy. Use of androgen deprivation therapy has increased over time, both as primary therapy and in conjunction with both external beam radiation and brachytherapy. Biochemical outcomes vary according to CAPRA score within the high risk group.
Conclusions
Clinical stage T2c should not define high risk, and the high risk group should be substratified using a multivariable instrument. There is no evidence for meaningful downward risk migration among high-risk patients over the past 15 years. At least some men in the high risk group may be under-treated.
Keywords: Prostatic neoplasms, Risk stratification, CAPRA, CaPSURE
Introduction
27,050 men in the United States are expected to die from the prostate cancer this year, a mortality figure which is surpassed by only lung cancer, yet represents a relatively small fraction of the number of men who are diagnosed [1]. Clinician-patient decision making with respect to initial management must therefore consider disease risk—that is, the likelihood of progression to clinically significance and/or mortality—in order that timing and intensity of treatment be appropriately tailored for each patient in the clinic setting, and that patients may be appropriately identified for clinical trials [2]. There exist multiple criteria for defining high risk prostate cancer [3, 4]. One of the most widely used risk classification systems, originally published by D'Amico et al, stratifies patients to low, intermediate, or high risk based on prostate specific antigen (PSA), biopsy Gleason grade, and clinical T stage [5].
Under this classification, which is endorsed by the American Urological Association 2007 clinical practice guideline for localized prostate cancer [6], a patient is assigned to the high risk group if he has a PSA level >20 ng/ml, Gleason score 8 to 10, and/or clinical stage ≥T2c. This classification is based on the 1992 TNM staging system, which stages tumors as T2a for a tumor palpable in less than half of one prostate lobe, T2b for a tumor palpable in more than half of one lobe, and T2c for a tumor palpable bilaterally. Under the 1997 TNM system, which included only T2a and T2b for unilateral and bilateral disease, respectively, we and others considered T2b to stratify patients to intermediate risk, and T3a to stratify them to high risk disease [7]. The 2002 TNM system returned to the 1992 T2a/b/c system, but it is not clear whether stage T2c should stratify patients to intermediate or high risk.
In this study, we aimed 1) to determine whether patients with T2c are more appropriately stratified to intermediate or high risk, 2) to document time trends in risk characteristics and primary treatment strategies, and 3) to assess our ability to substratify patients within the high risk group using the recently validated University of California–San Francisco Cancer of the Prostate Risk Assessment (CAPRA) score [8].
Methods
Patients were drawn from the Cancer of the Prostate Strategic Urologic Research Endeavor (CaPSURE™) registry, a longitudinal, observational database of men with biopsy-proven prostate adenocarcinoma managed at 31 academic- and community-based urology practices across the United States. All prostate cancer patients are recruited consecutively by participating urologists, who report complete workup and treatment data. Data for patients diagnosed before 1995 but still followed by a urologist were initially entered into the database retrospectively; for those whose cancers were diagnosed since 1995, all data entry has been prospective. Completeness and accuracy of the data are ensured by random sample medical record review every 6 months. Additional details of the project methods and a description of the cohort's sociodemographic characteristics have been reported previously [9].
As of May 2007, 13,740 men had registered and consented in the CaPSURE database. 452 men whose cancers were diagnosed before 1990 were excluded, as were 503 with metastatic and/or locally advanced (clinical stage ≥T3bN0M0) disease. 1977 men with localized disease were missing PSA, clinical T stage, and/or biopsy Gleason score data and were also excluded, leaving 10,808 for analysis. As defined in the AUA guideline, low risk patients were defined as those with clinical stage T1 or T2a, PSA ≤10 ng/ml, and Gleason score 6. High-risk patients were defined as those with a PSA level >20 ng/mL, a Gleason score of ≥8, and/or a clinical stage of T2c-3a. Others were classified as intermediate risk [6]. Additional analyses were performed using a more restrictive modification of the high-risk definition, which assigned patients with clinical stage T3a only to high risk, classifying T2c tumors as intermediate rather than high risk.
We analyzed temporal trends in patient distribution among the three risk groups, with time periods defined to produce relatively even numbers of patients in each group and to focus attention on the current decade; patients who would be stratified to high risk under the standard definition and intermediate risk under the more restrictive definition were evaluated as a separate “intermediate/high” group. Biochemical recurrence-free survival by risk group was assessed using Kaplan-Meier and log-rank analysis. Within the high-risk group (standard definition) we further analyzed trends in individual risk factors (PSA, Gleason score, T stage, PPB).
Risk was further analyzed using two well-validated multivariable instruments; the first is the original Kattan preoperative nomogram [10], which predicts percent likelihood of biochemical recurrence-free survival at 5 years after surgery based on Gleason score, clinical T stage, and a cubic spline transformation of PSA. The calculation of the score—which is relatively complex— for large numbers of patients in CaPSURE was facilitated by prior collaboration with the nomogram's author [11]. The second instrument, the UCSF Cancer of the Prostate Risk Assessment (CAPRA) score, assigns up to 3 points for Gleason score, up to 4 points for categorized PSA level, and 1 point each for age >50 years old, clinical stage T3a, and >33% positive of biopsy cores positive. The CAPRA score is thus calculated from 0 to 10, with every 2 point increase in CAPRA score representing roughly a doubling of risk of biochemical recurrence after prostatectomy [3, 8, 12].
We analyzed trends over time in primary treatment among low-risk patients. 103 high risk patients in the analytic dataset (3.1%) were missing data on primary treatment. An additional 43 (1.3%) had primary treatment recorded as “other” or “none” (as opposed to active surveillance, coded in CaPSURE as “watchful waiting”) and were also excluded from treatment analyses. Use of neoadjuvant or adjuvant androgen deprivation therapy (ADT) and adjuvant radiation therapy over time was also examined among patients electing radical prostatectomy (RP), brachytherapy, or external-beam radiation therapy (EBRT). Because patients were unevenly distributed across the time periods, statistical significance of temporal trends in risk factors and diagnosis and in primary treatment patterns was assessed using the Cuzick nonparametric test for trend. Variation in primary treatment selection by risk level as measured by the CAPRA score was also assessed.
Finally, we performed survival analysis on high-risk radical prostatectomy patients to predict risk of recurrence (PSA level >0.2 on two occasions or any second treatment at least 6 months after surgery) stratified by CAPRA score. For this analysis, patients receiving any neoadjuvant (before surgery) or adjuvant (treatment within 6 months of surgery) treatment were excluded, as were those with <6 months of follow-up or fewer than two postoperative PSA values available. For this subset (N=1131), Kaplan-Meier plots were produced, and the log-rank test and Cox proportional hazards regression were used to identify significance of the CAPRA score—as both a continuous and categorized variable—as a predictor of biochemical recurrence. All analyses were performed using Stata for Macintosh, version 9.2 (Stata Corporation, College Station, TX).
Results
Using the standard risk stratification, 4553 men (42.1%) diagnosed between 1990 and 2007 were low-risk, 2883 (26.7%) were intermediate risk, and 3372 (31.2%) were high risk. Using the more restrictive definition which considers clinical stage T2c to define intermediate rather than high risk, 4425 men (40.9%) were assigned to intermediate risk and 1830 (16.9%) were high risk.
Figure 1 illustrates the change over time in distribution of patients across risk groups. The proportion of patients assigned to high risk by the standard definition declined from 43.9% in 1990-94 to 29.0% in 2000-01, and has been relatively constant since that time, falling relatively little to 24.0% in 2004-07. The proportion of patients assigned to high risk who would be assigned to intermediate risk under the more restrictive definition—who were assigned to high risk solely on the basis of clinical stage T2c disease—has increased over time from 37.5% of high risk patients in 1990-94 to 42.9% in 2004-07. Figure 2 illustrates biochemical recurrence-free survival curves for patients stratified by risk groups, illustrating that patients stratified to high risk by the standard but not the restrictive definition actually have better outcomes than those stratified to intermediate risk by either definition. The difference between these two curves is statistically significant by the log-rank test (p=0.012).
Figure 1. Trends in patient clinical risk stratification at time of diagnosis.
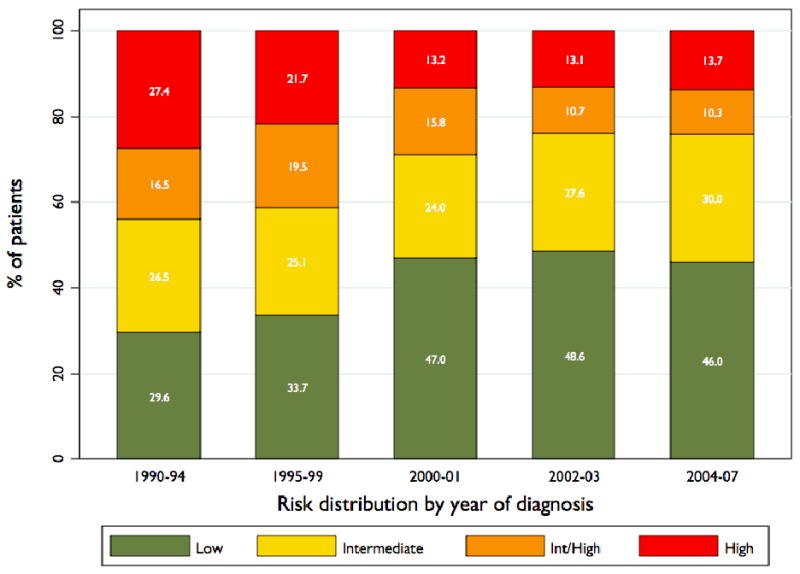
Percentage of men stratified to low-, intermediate-, and high-risk groups in each year group. Patients designated as “Int/High” are those stratified to high risk using the standard definition (including T2c) and intermediate using the more restrictive definition (T3a only) of high risk. Numbers indicate aggregate totals for each group in each time period: 1990-1994, 1995-1999, 2000-2001, 2002-2003, and 2004-2007. The trend toward more low- and less high-risk disease at diagnosis was significant (P<0.001).
Figure 2. Biochemical recurrence by risk group.
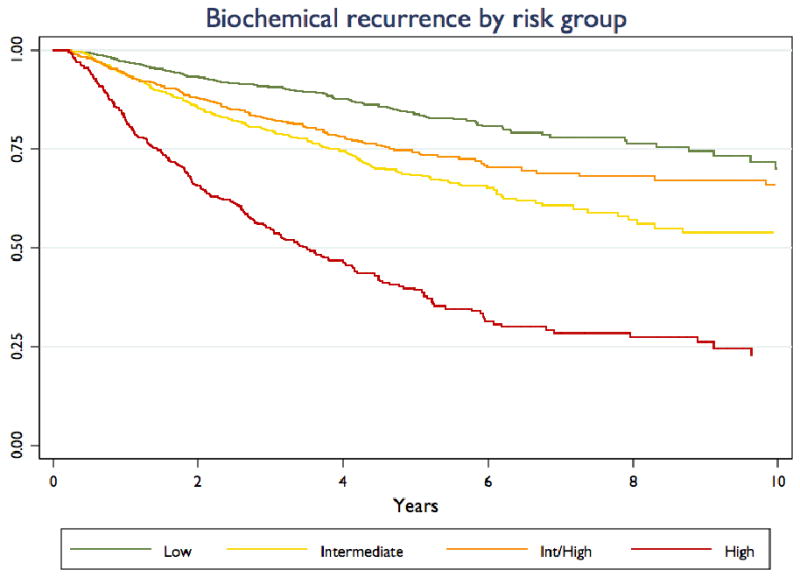
Kaplan-Meier curves are presented for patients stratified to low-risk, intermediate-risk, and high-risk, and for those (“Int/High”) stratified to high risk using the standard definition and intermediate risk using the more restrictive definition of high risk.
Table 1 presents trends over time in the distribution of clinical risk features (Gleason score, PSA, clinical T stage, and PPB). Each of these trends is statistically significant at the p<0.001 level by the Cuzick test for trend. Overall, compared to patients diagnosed in the early 1990s, those diagnosed in recent years are more likely to be stratified to the high risk group with a higher Gleason score, a lower PSA, a lower clinical stage, and a lower PPB. The proportion of high risk patients with more than one high-risk clinical feature (PSA, Gleason score, and/or clinical T stage) has been essentially constant over time, falling from 27.7% of high patients in 1990-94 to 19.3% in 2000-01, then rising again to 23.5% in 2004-07.
Table 1. Trends in risk characteristics and multivariable scores among high-risk patients over time.
| 1990-94 | 1995-99 | 2000-01 | 2002-03 | 2004-07 | Total | ||
|---|---|---|---|---|---|---|---|
| Gleason | 2-6 | 380 (60.1) | 439 (48.5) | 297 (43.2) | 193 (33.9) | 151 (26.1) | 1460 (43.3) |
| 3+4 | 83 (13.1) | 169 (18.7) | 120 (17.4) | 112 (19.7) | 121 (20.9) | 605 (17.9) | |
| 4+3 | 27 (4.3) | 83 (9.2) | 80 (11.6) | 67 (11.8) | 70 (12.1) | 327 (9.7) | |
| 8-10 | 142 (22.5) | 214 (23.7) | 191 (27.8) | 197 (34.6) | 236 (40.8) | 980 (29.1) | |
| PSA | 0-10 | 217 (34.3) | 469 (51.8) | 404 (58.7) | 333 (58.5) | 350 (60.6) | 1773 (52.6) |
| 10.01-20 | 147 (23.3) | 166 (18.3) | 130 (18.9) | 84 (14.8) | 86 (14.9) | 613 (18.2) | |
| 20.01-30 | 106 (16.8) | 119 (13.2) | 72 (10.5) | 62 (10.9) | 62 (10.7) | 421 (12.5) | |
| >30 | 162 (25.6) | 151 (16.7) | 82 (11.9) | 90 (15.8) | 80 (13.8) | 565 (16.8) | |
| T stage | T1 | 80 (12.7) | 84 (9.3) | 122 (17.7) | 133 (23.4) | 151 (26.1) | 570 (16.9) |
| T2a/b | 131 (20.7) | 132 (14.6) | 60 (8.7) | 62 (10.9) | 60 (10.4) | 445 (13.2) | |
| T2c | 358 (56.7) | 586 (64.8) | 469 (68.2) | 348 (61.2) | 351 (60.7) | 2112 (62.6) | |
| T3a | 63 (10.0) | 103 (11.4) | 37 (5.4) | 26 (4.6) | 16 (2.8) | 245 (7.3) | |
| PPB | ≤10% | 3 (0.6) | 7 (0.9) | 29 (4.4) | 22 (4.0) | 22 (4.0) | 83 (2.7) |
| 11-33% | 67 (13.7) | 166 (20.4) | 197 (29.7) | 150 (27.4) | 128 (23.3) | 708 (23.1) | |
| 34-50% | 138 (28.2) | 266 (32.6) | 225 (33.9) | 191 (34.9) | 167 (30.4) | 987 (32.2) | |
| 51-75% | 87 (17.8) | 159 (19.5) | 105 (15.8) | 97 (17.7) | 111 (20.2) | 559 (18.2) | |
| >75% | 195 (39.8) | 217 (26.6) | 107 (16.1) | 88 (16.1) | 121 (22.0) | 728 (23.8) | |
| Kattan | 54.3 ± 24.7 | 58.0 ± 23.9 | 63.2 ± 21.9 | 62.3 ± 21.6 | 61.7 ± 21.1 | 60.0 ± 22.9 | |
| CAPRA | 4.78 ± 2.02 | 4.52 ± 2.22 | 4.39 ± 2.34 | 4.71 ± 2.29 | 4.86 ± 2.22 | 4.63 ± 2.22 | |
| Total | 632 | 905 | 688 | 569 | 578 | 3,372 |
Data are number (percentage) of patients unless otherwise indicated. Kattan and CAPRA scores are given as mean ± standard deviation. PSA = prostate specific antigen, PPB = percent positive biopsy cores, CAPRA = Cancer of the Prostate Risk Assessment.
Table 1 also gives mean Kattan and CAPRA scores among high risk patients over time. The rise in Kattan scores over time within the high risk group is statistically significant (p<0.001), but are explained wholly by trends before 2000; scores have fallen slightly since that time (p-vale for trend since 2000 = 0.07). The trend over time in CAPRA scores was not significant (p=0.17). Moreover, as illustrated in figure 3, there has actually been a trend toward higher CAPRA scores among high risk patients since 2000 as assessed by distribution of scores rather than by mean score. This trend is statistically significant (p<0.001).
Figure 3. CAPRA distribution over time among high risk patients.
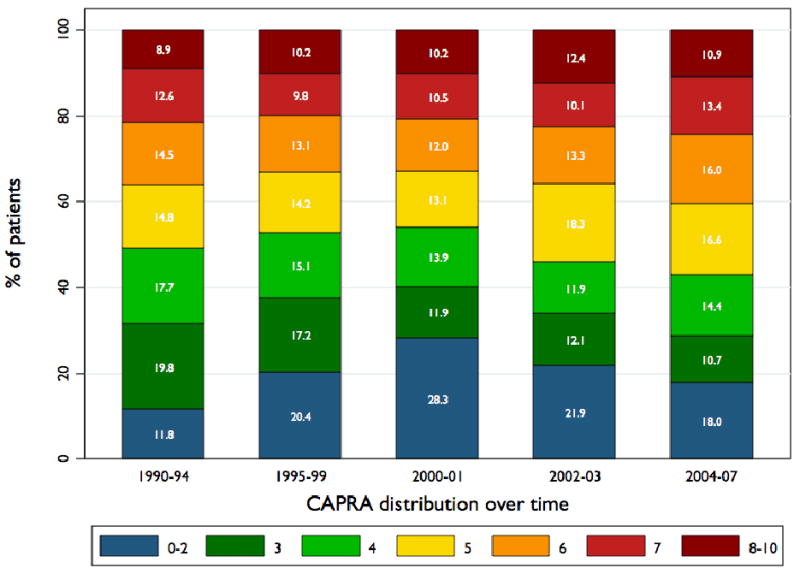
Change in distribution of high-risk patients (standard definition) across CAPRA scores over time.
The CAPRA score can be categorized such that scores 0-2 indicated low risk, scores 3-5 indicate intermediate risk, and scores 6-10 indicated high risk [3, 12]. Over the whole study period, 20.6% of the patients assigned to the high risk group by the standard definition had CAPRA scores 0-2, 43.5% had scores 3-5, and 35.9% had scores 6-10. Using the more restrictive definition of high risk, the corresponding proportions were 1.0% CAPRA 0-2, 38.4% CAPRA 3-5, and 60.1% CAPRA 6-10. The mean ± SD Kattan score among the low risk group was 90 ± 3; among the intermediate and high risk groups, the means were 76 ± 11 and 60 ± 23 using the standard definition, and 75 ± 12 and 49 ± 24 using the restrictive definition.
Figure 4, panel a shows treatment primary distribution among high risk patients (standard definition) over time. Just over 40% of high-risk patients undergo RP as primary treatment. Use of brachytherapy in this group initially rose markedly and since has fallen nearly to early-1990s levels. Use of EBRT has also fallen somewhat over time, while use of primary ADT has risen fairly consistently. Panel b of figure 4 illustrates that treatment selection varies considerably within the standard high risk group: with increasing risk as assessed by the CAPRA score, patients are less likely to receive RP or brachytherapy and more likely to receive EBRT and especially primary ADT. Use of WW falls with increasing risk. Table 2 gives the rates of use of neoadjuvant and adjuvant ADT and radiation therapy. Major findings are that use of adjuvant radiation after RP is relatively uncommon among high risk men and has declined over time, and that a growing proportion of high risk men receiving either EBRT or brachytherapy receive neoadjuvant and/or adjuvant ADT.
Figure 4. Treatment trends among high risk patients.
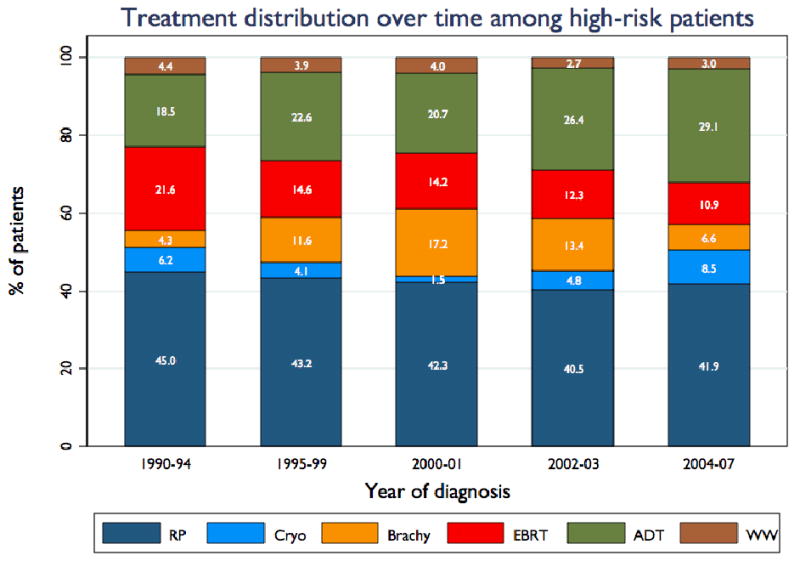
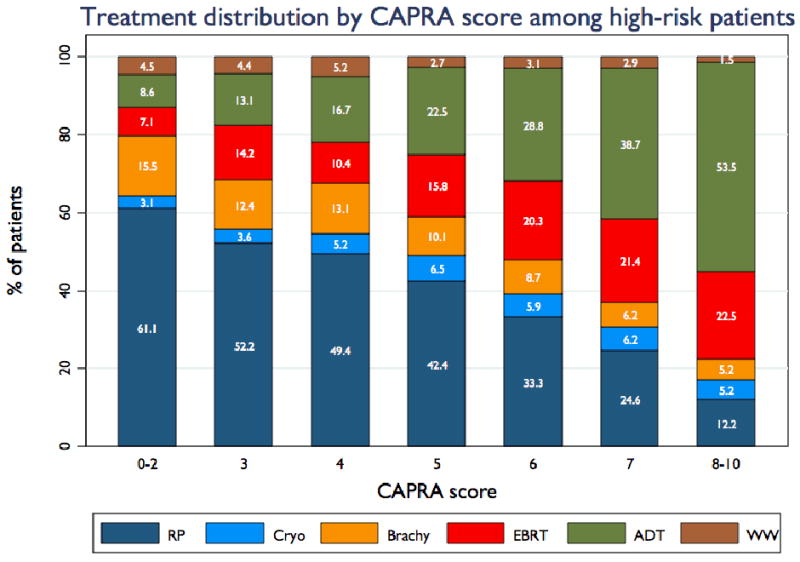
Panel A illustrates trends over time in distribution of high risk patients (standard definition) across radical prostatectomy (RP), cryotherapy (Cryo), brachytherapy (Brachy), external-beam radiation therapy (EBRT), primary androgen deprivation therapy (ADT), and watchful waiting / active surveillance (WW). Panel B shows treatment distribution among all study patients stratified by CAPRA score.
Table 2. Trends in adjuvant and neoadjuvant treatment among high-risk patients*.
| Primary treatment | 1990-94 | 1995-99 | 2000-01 | 2002-03 | 2004-07 | Total | |
|---|---|---|---|---|---|---|---|
| RP | NADT | 6.18% | 18.30% | 9.22% | 6.79% | 10.36% | 10.89% |
| AADT | 8.36% | 18.57% | 13.83% | 9.95% | 16.67% | 13.87% | |
| AXRT | 7.27% | 4.77% | 3.55% | 3.17% | 2.25% | 4.36% | |
| Brachy | NADT | 38.46% | 43.56% | 39.13% | 39.73% | 54.29% | 42.00% |
| AADT | 11.54% | 29.70% | 26.09% | 19.18% | 34.29% | 25.43% | |
| AXRT | 15.38% | 8.91% | 22.61% | 26.03% | 11.43% | 17.71% | |
| EBRT | NADT | 17.42% | 61.42% | 86.32% | 86.57% | 84.48% | 60.54% |
| AADT | 14.39% | 49.61% | 61.05% | 64.18% | 75.86% | 47.39% |
Percent of patients in each year group receiving neoadjuvant androgen deprivation therapy (NADT), adjuvant androgen deprivation therapy (AADT), or adjuvant external-beam radiation therapy (AXRT) in association with radical prostatectomy (RP), brachytherapy (Brachy), or external-beam radiation therapy (EBRT)
Figure 5 illustrates the Kaplan-Meier curves for biochemical recurrence-free survival among high risk patients (standard definition) stratified by CAPRA score, and table 3 presents the results of Cox proportional hazards analysis of the ability of the CAPRA score to predict biochemical recurrence as a continuous and categorized variable. The HR of 1.4 for each point increase in CAPRA score corresponds to roughly a doubling of risk of recurrence with each two-point increase in score. Overall, risk of recurrence increases consistently with increasing CAPRA score within the high risk group; the 5-year recurrence-free survival estimates within the high risk group range from 83.7% to 25.6% by CAPRA score.
Figure 5. Biochemical recurrence by CAPRA score.
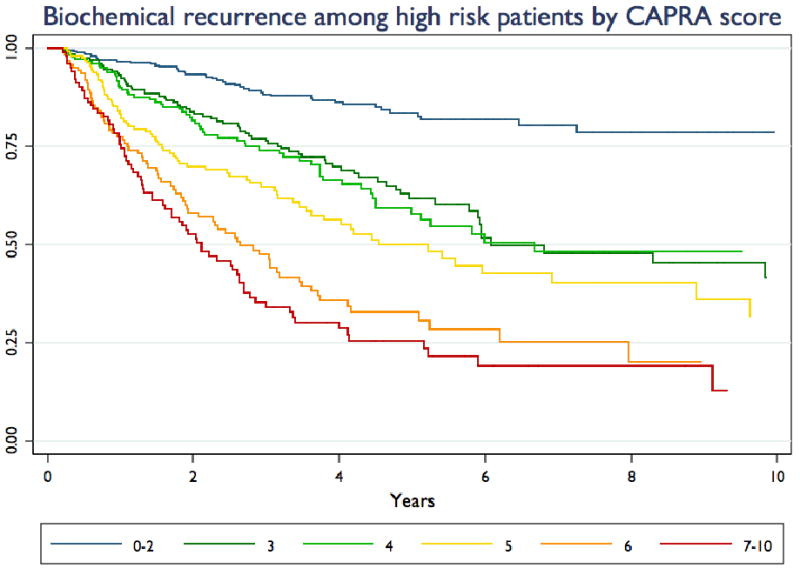
Kaplan-Meier curves are presented for patients in the high risk group (standard definition), stratified by CAPRA score.
Table 3. Survival analysis among high-risk prostatectomy patients by CAPRA score*.
| CAPRA score | N | HR (95% CI) | P value | 5-Year recurrence-free survival (95% CI) |
|---|---|---|---|---|
| Continuous | 1131 | 1.4 (1.3-1.4) | <0.001 | |
| 0-2 | 340 | Referent | 83.7 (78.1-88.0) | |
| 3 | 208 | 2.9 (2.0-4.2) | <0.001 | 61.8 (53.1-69.4) |
| 4 | 187 | 3.0 (2.0-4.4) | <0.001 | 57.9 (48.1-66.4) |
| 5 | 166 | 4.3 (3.0-6.3) | <0.001 | 50.0 (40.4-58.9) |
| 6 | 126 | 7.1 (4.9-10.3) | <0.001 | 33.0 (23.7-42.6) |
| 7-10 | 104 | 8.8 (6.0-12.8) | <0.001 | 25.6 (16.8-35.4) |
Hazard ratios (HRs) with 95% confidence intervals (CIs) given for Cancer of the Prostate Risk Assessment (CAPRA) as a continuous variable (4-6 treated as equal to 4) and at each level compared with a CAPRA score of 0 as a referent. Five-year actuarial biochemical recurrence-free survival calculated via Kaplan-Meier analysis.
Discussion
Several findings merit further comment. First, it seems clear that clinical stage T2c should not be a sufficient finding to classify a patient to a high risk group. Patients stratified to high risk based solely on the basis of stage T2c (those labeled “intermediate/high” in figure 2) in fact had a significantly lower risk of recurrence not only compared to those stratified to high risk using the more restrictive definition, but also compared to those stratified to intermediate risk. Clinical stage in CaPSURE is reported directly by clinicians; one possible explanation is that many patients with unilaterally palpable tumors may be incorrectly reported as stage T2c based on the finding of bilateral positive biopsies. It should also be noted that in both the original [10] and revised [13] Kattan preoperative nomograms—based on academic patient cohorts—T2b disease confers higher risk than T2c disease; in the CAPRA analyses, clinical stage conferred no independent information beyond PSA, Gleason score, and PPB until stage T3a [8]. Moreover, under the standard definition, over 20% of the high risk group had CAPRA scores in the 0-2 range, indicating low risk disease, and had biochemical recurrence rates similar to D'Amico low risk patients with similar CAPRA scores [14]. Using the more restrictive definition, these patients fell to just over 1% of the high risk group.
We [14] and others [15] have previously found that the downward stage- and risk-migration which was well-recognized in the 1990s has slowed considerably in the current decade, with an essentially constant proportion of patients found to have high risk disease since 2000 despite ongoing trends toward lower PSA thresholds for biopsy and higher numbers of cores taken on biopsy. Our prior analysis focusing on low risk patients did find downward risk migration within the low risk group as assessed by the CAPRA score [14], with ongoing migration in the current decade. The present analysis, conversely, does not confirm downward migration within the high-risk group; indeed, since 2000 there are trends toward higher risk within the high risk group as assessed by the Kattan and CAPRA scores. One caveat is that pathologists' practices have changed over the past decade, such that a tumor read in contemporary years are more likely to receive a high grade than the same tumor read in the early 1990s [16]. Table 1 demonstrates that Gleason grade, rather than PSA or clinical stage, is more likely to explain assignment to the high risk group in the latter years of the analysis—so a portion of the rising risk within the high risk group may be an artifact of this change in pathology practice. On the other hand, the proportion of patients presenting with PSA >20 and/or >75% PPB has changed little in the current decade, indicative of a consistent pool of men at high true risk.
We found that the CAPRA score, as a multivariable instrument, was able to substratify the high risk group effectively in terms of biochemical recurrence following surgery. Other recent analyses have likewise demonstrated heterogeneity in outcomes among high risk patients [4]. This increased heterogeneity compared to the low risk group is explainable by the fact that the D'Amico definition of high risk does not account for multiple adverse variables. Intuitively, a man with Gleason 4+4, PSA 4.2, clinical stage T1c is at much lower risk than a man with Gleason 4+5, PSA 28.8, clinical stage T2b; both of these men would be in the same high risk group in the 3-level classification, but would be appropriately substratified using a multivariable instrument such as the Kattan nomogram or CAPRA score.
It is evident from figure 4b that whether or not they are routinely using a multivariable risk prediction instrument, urologists in the community already recognize the additive impact of multiple adverse risk factors. Within the high risk group, treatment patterns vary substantially with multivariable risk as measured by the CAPRA score: utilization of RP and brachytherapy falls markedly with increasing CAPRA score, while utilization of EBRT and primary androgen therapy rises. Evidence from multiple large randomized trials supports the addition of ADT to EBRT [17, 18]. Conversely, ADT does not improve outcomes following RP [19] or brachytherapy [20], and may adversely impact quality of life outcomes after the latter treatment [21].
Use of primary androgen deprivation monotherapy in CaPSURE has increased consistently among high risk men. Moreover, utilization of neoadjuvant ADT in association with EBRT for high risk disease has been over 80% since 2000, but has changed little since that time, whereas utilization in combination with brachytherapy has continued to rise. While concern has been raised regarding possible overtreatment of low risk prostate cancer [14], these figures raise concern regarding possible undertreatment of high risk disease. High volume centers have reported favorable outcomes after RP monotherapy even among patients with advanced disease [22], and results may be improved further by addition of adjuvant EBRT for appropriately selected patients. Many patients at the higher end of the risk spectrum with clinically localized disease do not appear to be offered potentially curative local therapy, and rates of adjuvant EBRT are lower than would be expected after RP for high risk disease.
A few caveats to these analyses should be considered. Data are submitted only by patients and urologists; therefore, any treatments by other practitioners that are not reported by patients may not be captured. Quality assurance mechanisms, including medical record review of all hospital admissions, help to minimize this problem. The CaPSURE practice sites have not been chosen at random and thus do not constitute a statistically valid sample of the United States patient population. However, they represent a broad range of geographic locales and a mix of academic and community sites, which we believe to be the best available sample for the analysis of temporal trends in “real-world” practice. It is possible that the results would have been different with different grouping of the years of diagnosis, but given the consistently strong trends and low p-values realized, this seems unlikely. The CAPRA score has to date been validated only for RP patients, and results of our survival analysis should not yet be extrapolated to patients undergoing other treatments.
In summary, men stratified to the D'Amico high risk category represent a heterogeneous group whose outcomes may be better predicted by a multivariable instrument. Clinical stage T2c alone should not warrant high risk classification. There is little if any ongoing downward risk migration among high risk patients, suggesting that new strategies are needed to identify these patients more effectively and earlier in the disease course. Treatment strategies vary with multivariable risk within the high risk group, and treatment trends suggest that at least some men with high risk, localized disease treated with ADT monotherapy may be under-treated. Standardization of better definitions of risk are needed both for patient counseling in clinical practice and for clinical trial recruitment.
References
- 1.Jemal A, Siegel R, Ward E, Murray T, Xu J, Thun MJ. Cancer statistics, 2007. CA Cancer J Clin. 2007;57:43–66. doi: 10.3322/canjclin.57.1.43. [DOI] [PubMed] [Google Scholar]
- 2.Thompson IM. Defining high risk prostate cancer--where do we set the bar? A translational science approach to risk stratification. J Urol. 2006;176:S21–4. doi: 10.1016/j.juro.2006.06.078. discussion S5-6. [DOI] [PubMed] [Google Scholar]
- 3.Cooperberg MR, Freedland SJ, Pasta DJ, et al. Multiinstitutional validation of the UCSF cancer of the prostate risk assessment for prediction of recurrence after radical prostatectomy. Cancer. 2006;107:2384–91. doi: 10.1002/cncr.22262. [DOI] [PubMed] [Google Scholar]
- 4.Yossepowitch O, Eggener SE, Serio AM, et al. Secondary Therapy, Metastatic Progression, and Cancer-Specific Mortality in Men with Clinically High-Risk Prostate Cancer Treated with Radical Prostatectomy. Eur Urol. 2007 doi: 10.1016/j.eururo.2007.10.008. in press. [DOI] [PMC free article] [PubMed] [Google Scholar]
- 5.D'Amico AV, Whittington R, Malkowicz SB, et al. Biochemical outcome after radical prostatectomy, external beam radiation therapy, or interstitial radiation therapy for clinically localized prostate cancer. JAMA. 1998;280:969–74. doi: 10.1001/jama.280.11.969. [DOI] [PubMed] [Google Scholar]
- 6.American Urological Association Prostate Cancer Clinical Guidelines Panel. Guideline for the management of clinically localized prostate cancer: 2007 update. American Urological Association Education and Research, Inc.; 2007. [Google Scholar]
- 7.Mitchell JA, Cooperberg MR, Elkin EP, et al. Ability of two pretreatment risk assessment methods to predict prostate cancer recurrence after radical prostatectomy: data from CaPSURE. J Urol. 2005;173:1126–31. doi: 10.1097/01.ju.0000155535.25971.de. [DOI] [PubMed] [Google Scholar]
- 8.Cooperberg MR, Pasta DJ, Elkin EP, et al. The University of California, San Francisco Cancer of the Prostate Risk Assessment score: a straightforward and reliable preoperative predictor of disease recurrence after radical prostatectomy. J Urol. 2005;173:1938–42. doi: 10.1097/01.ju.0000158155.33890.e7. [DOI] [PMC free article] [PubMed] [Google Scholar]
- 9.Cooperberg MR, Broering JM, Litwin MS, et al. The contemporary management of prostate cancer in the United States: lessons from the cancer of the prostate strategic urologic research endeavor (CaPSURE), a national disease registry. J Urol. 2004;171:1393–401. doi: 10.1097/01.ju.0000107247.81471.06. [DOI] [PubMed] [Google Scholar]
- 10.Kattan MW, Eastham JA, Stapleton AM, Wheeler TM, Scardino PT. A preoperative nomogram for disease recurrence following radical prostatectomy for prostate cancer. J Natl Cancer Inst. 1998;90:766–71. doi: 10.1093/jnci/90.10.766. [DOI] [PubMed] [Google Scholar]
- 11.Greene KL, Meng MV, Elkin EP, et al. Validation of the Kattan preoperative nomogram for prostate cancer recurrence using a community based cohort: results from Cancer of the Prostate Strategic Urological Research Endeavor (CaPSURE) J Urol. 2004;171:2255–9. doi: 10.1097/01.ju.0000127733.01845.57. [DOI] [PubMed] [Google Scholar]
- 12.May M, Knoll N, Siegsmund M, et al. Validity of the CAPRA score to predict biochemical recurrence-free survival after radical prostatectomy. Results from a European multicenter survey of 1,296 patients. J Urol. 2007;178:1957–62. doi: 10.1016/j.juro.2007.07.043. [DOI] [PubMed] [Google Scholar]
- 13.Stephenson AJ, Scardino PT, Eastham JA, et al. Preoperative nomogram predicting the 10-year probability of prostate cancer recurrence after radical prostatectomy. J Natl Cancer Inst. 2006;98:715–7. doi: 10.1093/jnci/djj190. [DOI] [PMC free article] [PubMed] [Google Scholar]
- 14.Cooperberg MR, Broering JM, Kantoff PW, Carroll PR. Contemporary trends in low risk prostate cancer: risk assessment and treatment. J Urol. 2007;178:S14–9. doi: 10.1016/j.juro.2007.03.135. [DOI] [PMC free article] [PubMed] [Google Scholar]
- 15.Dong F, Reuther AM, Magi-Galluzzi C, Zhou M, Kupelian PA, Klein EA. Pathologic stage migration has slowed in the late PSA era. Urology. 2007;70:839–42. doi: 10.1016/j.urology.2007.09.001. [DOI] [PubMed] [Google Scholar]
- 16.Smith EB, Frierson HF, Jr, Mills SE, Boyd JC, Theodorescu D. Gleason scores of prostate biopsy and radical prostatectomy specimens over the past 10 years: is there evidence for systematic upgrading? Cancer. 2002;94:2282–7. doi: 10.1002/cncr.10457. [DOI] [PubMed] [Google Scholar]
- 17.Hanks GE, Pajak TF, Porter A, et al. Phase III trial of long-term adjuvant androgen deprivation after neoadjuvant hormonal cytoreduction and radiotherapy in locally advanced carcinoma of the prostate: the Radiation Therapy Oncology Group Protocol 92-02. J Clin Oncol. 2003;21:3972–8. doi: 10.1200/JCO.2003.11.023. [DOI] [PubMed] [Google Scholar]
- 18.D'Amico AV, Manola J, Loffredo M, Renshaw AA, DellaCroce A, Kantoff PW. 6-month androgen suppression plus radiation therapy vs radiation therapy alone for patients with clinically localized prostate cancer: a randomized controlled trial. JAMA. 2004;292:821–7. doi: 10.1001/jama.292.7.821. [DOI] [PubMed] [Google Scholar]
- 19.Soloway MS, Pareek K, Sharifi R, et al. Neoadjuvant androgen ablation before radical prostatectomy in cT2bNxM0 prostate cancer: 5-year results. J Urol. 2002;167:112–6. [PubMed] [Google Scholar]
- 20.Potters L, Torre T, Ashley R, Leibel S. Examining the role of neoadjuvant androgen deprivation in patients undergoing prostate brachytherapy. J Clin Oncol. 2000;18:1187–92. doi: 10.1200/JCO.2000.18.6.1187. [DOI] [PubMed] [Google Scholar]
- 21.Potters L, Torre T, Fearn PA, Leibel SA, Kattan MW. Potency after permanent prostate brachytherapy for localized prostate cancer. Int J Radiat Oncol Biol Phys. 2001;50:1235–42. doi: 10.1016/s0360-3016(01)01578-4. [DOI] [PubMed] [Google Scholar]
- 22.Visakorpi T, Hyytinen E, Koivisto P, et al. In vivo amplification of the androgen receptor gene and progression of human prostate cancer. Nat Genet. 1995;9:401–6. doi: 10.1038/ng0495-401. [DOI] [PubMed] [Google Scholar]


