Abstract
Traditional Normarski differential interference contrast (DIC) microscopy is a very powerful method for imaging non-stained biological samples. However, one of its major limitations is the non-quantitative nature of the imaging. To overcome this problem, we developed a quantitative DIC microscopy method based on off-axis sample self-interference. The digital holography algorithm is applied to obtain quantitative phase gradients in orthogonal directions, which leads to quantitative phase image through a spiral integration of the phase gradients. This method is practically simple to implement on any standard microscope without stringent requirement on polarization optics. Optical sectioning can be obtained through enlarged illumination numerical aperture (NA).
Differential interference contrast (DIC) microscope has long enjoyed widespread use in imaging transparent phase objects by the biological community. It directly converts changes of phase gradients in the sample to intensity changes. The advantages of DIC over other phase imaging techniques such as phase contrast microscopy include outstanding contrast, high spatial resolution and optical sectioning capability. However, one of the major limitations of DIC microscopy is that it is qualitative in nature due to the nonlinear relationship between intensity and phase gradient. Moreover, the amplitude information of the sample is convolved with the phase information which sometimes makes data interpretation difficult.
Digital holography microscopy (DHM) or quantitative phase microscopy (QPM) has been developed over the last decade to overcome these problems (1–4). Two different approaches have generally been employed: one is phase-shifting interferometry (4), which uses several precisely phase-shifted interferograms to recover the amplitude and phase of the sample; the other approach is off-axis interferometry, where the sample wavefront interferes with a tilted reference wave in off-axis geometry enabling one-shot phase image retrieval(3). Once the quantitative phase image is obtained, pseudo-DIC images can be simulated along any gradient direction by simply taking the derivative (5). However, most of the reported works utilized highly coherent optical sources with pseudo-plane wave illumination such that the phase images were prone to fixed pattern speckle noise and sectioning capability was very poor.
On a different note, many researchers are pushing traditional Normaski DIC to obtain quantitative imaging through the use of phase-shifting technique (6–8). Similar to phase-shifting interferometry, this approach requires precise change of one sample arm (in this case by adjusting the DIC bias) in three or four steps to convert DIC intensities to linear phase gradient in one shear direction. Orthogonal directions of shear are necessary for reconstruction of object phase function. The whole process requires multiple adjustments of a phase compensation waveplate and rotation of the sample or Wollaston prisms and therefore is unsuitable for real-time imaging.
Here we presented a unique approach for quantitative DIC microscopy that yields single-shot linear phase gradient images at two orthogonal directions using off-axis sample self-interference. By placing a Ronchi grating slightly out-of-focus at the image plane of a conventional microscope and relaying the images directed onto the CCD camera, the lateral shearing effect will give rise to interference fringes similar to off-axis interferometry (9). Applying the digital holography algorithm enables single-shot phase gradient imaging. Quantitative DIC images along two orthogonal shear directions are obtained simultaneously using a checker board grating. This allows direct calculation of quantitative phase image through integration. We demonstrate quantitative DIC and phase imaging of living cells using this approach.
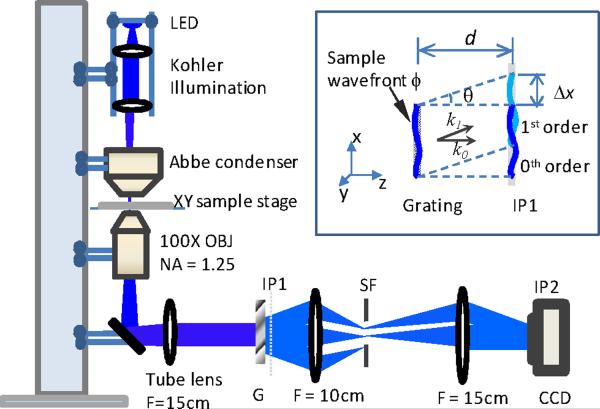
Our DIC microscopy setup consists of an Olympus Abbe Condenser, a sample stage, a 100× oil-immersion objective and a 15 cm achromatic lens as the tube lens (shown in Fig. 1). The sample was illuminated by a blue LED (λ = 470 nm) with Kohler illumination configuration. A Ronchi grating or checker board grating is placed close to the image plane (IP1) of the microscope, which is further relayed onto a CCD camera (Photometrics Coolsnap) located at the second image plane IP2 using a 4-f imaging lens pair. As shown in insert of Fig. 1, the grating splits the sample wavefront into multiple orders and only the 1st and 0th orders are allowed to pass through a spatial filter mask. These two orders will interfere at IP2, where the CCD camera is located. Eq. (1) describes the interferogram on the CCD under plane wave illumination (when the condenser iris is almost closed):
| (1) |
with A0(x,y), A1(x,y) being the amplitude of the 0th and 1st order sample wave at sample position (x,y), respectively; k0 and k1 are the corresponding wave vectors and ϕ(x,y) is the optical phase of the wave after traversing the sample. The first term inside the cosine function forms the sinusoidal interference fringes, whereas the second term distorts the sinusoidal pattern and embeds the sample phase gradient information. Obviously the phase contrast depends linearly on the amount of lateral shift Δx, which can be calculated using the following equation:
| (2) |
where θ is the angle between the two diffraction orders, Mag the magnification of the microscope and L the period of the grating. For a grating of 80 lines/mm and total magnification of 150, a separation distance d of 500 μm gives a shearing distance of 125 nm, about half of the resolution, which is typically used for our experiments.
Figure 1.
Schematic diagram of our off-axis DIC microscope setup. Insert shows the lateral shearing of the wavefront caused by the displacement of the grating from the image plane. IP1, IP2: image plane 1 and 2; G: grating; SF: spatial filter.
We use Hilbert transform, similar to that used in diffraction phase microscope, to retrieve the phase gradient (3). Fig. 1 and Eq. (1) only shows lateral shearing in the x-direction. When a checkerboard grating is used instead of a Ronchi-grating, shearing along two orthogonal directions are obtained simultaneously (10). In combination with a spiral phase integration algorithm, the sample phase ϕ (x,y) can be obtained (7). This approach is more resistant to vibration noise compared to diffraction phase microscopy because no spatial filtering is involved and the use of low coherence source also significantly reduces speckle problem.
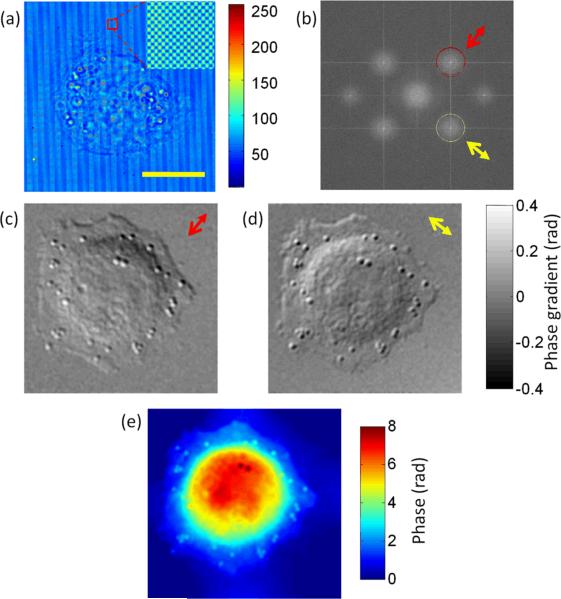
To demonstrate live cell imaging, we acquired two-dimensional interferogram of a live HeLa cell (see Fig. 2a) sandwiched between two coverslips using a checkerboard grating with a pitch of 9 μm and an illumination NA of 0.05. Through Hilbert transform of the two well separated frequency components in Fig. 2b (indicated by circles), the amplitude and gradient phase images of the cell along both diagonal and anti-diagonal directions were obtained simultaneously. The two amplitude images show exact same features (now shown) while the phase images show the phase gradient along two orthogonal directions (Fig. 2c–2d). Individual granules inside the cell are clearly visualized in the phase gradient images, although they are not observable in the amplitude images. We note that the phase gradient images are a special case of DIC. The illumination NA is kept very low so that plane wave projection approximation can be used here, which facilitates direct integration to obtain the absolute phase of the entire cell. Fig. 2e shows the integrated phase image. The features observed in DIC images are well preserved in the quantitative phase image. The quality of the phase image is much improved compared to laser based quantitative phase imaging due to removal of speckle. Some residual phase variation in the background is likely due to the aberration present in the 4f imaging system.
Figure 2.
(a) Interferogram measured on the CCD (insert shows magnified fringes of the red box area); (b) two-dimensional Fourier transform of the interferogram: red and yellow circles show the frequency component used for obtaining phase gradient images while the arrows show the respective gradient direction; (c),(d) phase gradient images of the cell; (e) phase image of the cell obtained through spiral integration. Scale bar: 15μm
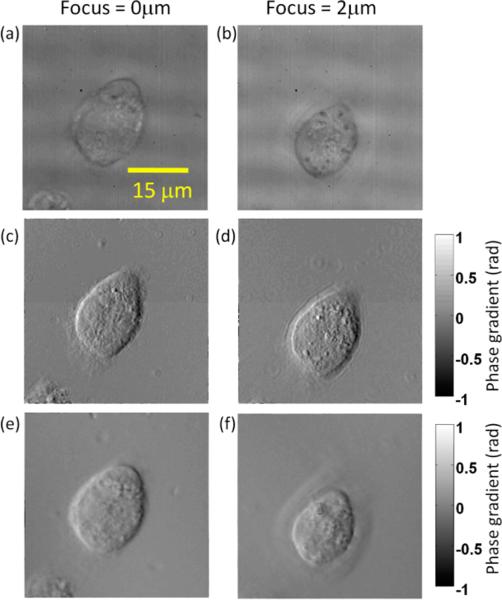
Narrow optical sectioning, one of the most useful features in conventional DIC microscopy, can also be obtained in our system by increasing the illumination NA. In our setup, it is easily achieved by opening the iris diaphragm of the condenser. In this case, the intensity S in Eq. (1) will be an integration of the entire illumination NA. Because of the destructive interference of light arriving from out-of-focus plane, the phase image obtained will have optical sectioning effect, similar to bright field microscopy or conventional DIC microscopy. Fig. 3 shows the difference between low NA and high NA illumination for another HeLa cell at different focal positions 2 μm apart. For comparison, bright field images (Fig. 3a–3b) are acquired using the same setup by blocking the 1st order beam. At low illumination NA of 0.05, diffraction ring pattern around small dust particles can be clearly observed in Fig. 3c–d. However, at high NA of 0.8, the sample is illuminated by a superposition of plane waves of many different angles; the corresponding phase gradients add up incoherently, suppressing the diffraction effect as well as providing optical sectioning. Due to the angular average effect, the phase gradient under high NA illumination is smaller than that for the low NA illumination case. Unlike conventional DIC microscopy, increasing illumination NA for DIC based on lateral shearing beyond a certain point will decrease signal to noise quickly due to decreasing interferogram contrast (10). This will limit the resolution obtainable with the off-axis DIC method. Nonetheless, we have shown that up to the illumination NA of 0.8, the image contrast is still well maintained.
Figure 3.
(a),(b) Brightfield images of a HeLa cell at different focal positions; (c),(d) phase gradient images of the cell under illumination NA of 0.05; (e),(f) phase gradient images of the cell under illumination NA of 0.8.
In conclusion, we have demonstrated a new approach to obtain quantitative DIC images of living cells. It has the advantage of simple and straightforward implementation on conventional microscopes at low-cost, yet providing high quality quantitative phase information to interrogate the structure and function of unstained living cells. Other modes of imaging such as brightfield and fluorescence can be easily integrated without changing optical components. Toggling between optical sectioning and phase integration is easily controlled by adjusting the iris of the condenser lens. Quantitative phase can be obtained through spiral integration of the linear phase gradient images along orthogonal directions under low NA illumination.
Acknowledgements
This work was funded by the National Center for Research Resources of the National Institutes of Health (P41-RR02594-24), the National Science Foundation (DBI-0754339), and Hamamatsu Corporation.
Footnotes
OCIS codes: (120.3180) Interferometry; (180.0180) Microscopy; (170.3880) Medical and biological imaging.
References
- 1.Barty A, Nugent KA, Paganin D, Roberts A. Quantitative optical phase microscopy. Opt. Lett. 1998;23(11):817–819. doi: 10.1364/ol.23.000817. [DOI] [PubMed] [Google Scholar]
- 2.Rappaz B, Marquet P, Cuche E, Emery Y, Depeursinge C, Magistretti P. Measurement of the integral refractive index and dynamic cell morphometry of living cells with digital holographic microscopy. Opt. Express. 2005;13(23):9361–9373. doi: 10.1364/opex.13.009361. [DOI] [PubMed] [Google Scholar]
- 3.Popescu G, Ikeda T, Dasari RR, Feld MS. Diffraction phase microscopy for quantifying cell structure and dynamics. Opt. Lett. 2006;31(6):775–777. doi: 10.1364/ol.31.000775. [DOI] [PubMed] [Google Scholar]
- 4.Zhang T, Yamaguchi I. Three-dimensional microscopy with phase-shifting digital holography. Opt. Lett. 1998;23(15):1221–1223. doi: 10.1364/ol.23.001221. [DOI] [PubMed] [Google Scholar]
- 5.Lue N, Choi W, Popescu G, Ikeda T, Dasari RR, Badizadegan K, Feld MS. Quantitative phase imaging of live cells using fast Fourier phase microscopy. Appl. Opt. 2007;46(10):1836–1842. doi: 10.1364/ao.46.001836. [DOI] [PubMed] [Google Scholar]
- 6.Arnison MR, Larkin KG, Sheppard CJR, Smith NI, Cogswell CJ. Linear phase imaging using differential interference contrast microscopy. Journal of Microscopy. 2004;214(1):7–12. doi: 10.1111/j.0022-2720.2004.01293.x. [DOI] [PubMed] [Google Scholar]
- 7.King SV, Libertun A, Piestun R, Cogswell CJ, Preza C. Quantitative phase microscopy through differential interference imaging. J. Biomed. Opt. 2008;13(2):024020. doi: 10.1117/1.2907328. [DOI] [PubMed] [Google Scholar]
- 8.Shribak M, LaFountain J, Biggs D, Inoue S. Orientation-independent differential interference contrast microscopy and its combination with an orientation-independent polarization system. J. Biomed. Opt. 2008;13(1):014011. doi: 10.1117/1.2837406. [DOI] [PMC free article] [PubMed] [Google Scholar]
- 9.Wyant JC. Double Frequency Grating Lateral Shear Interferometer. Appl. Opt. 1973;12(9):2057–2060. doi: 10.1364/AO.12.002057. [DOI] [PubMed] [Google Scholar]
- 10.Bon P, Maucort G, Wattellier B, Monneret S. Quadriwave lateral shearing interferometry for quantitative phase microscopy of living cells. Opt. Express. 2009;17(15):13080–13094. doi: 10.1364/oe.17.013080. [DOI] [PubMed] [Google Scholar]


