

Abstract
The discovery of biomarkers for neurodegenerative diseases will have a major impact on the efficiency of therapeutic clinical trials, and may be important for understanding basic pathogenic mechanisms. We have approached the discovery of protein biomarkers for amyotrophic lateral sclerosis (ALS) by profiling affected tissues in a relevant animal model, and then validating the findings in human tissues. Ventral roots from SOD1G93A “ALS” mice were analyzed by label-free quantitative mass spectrometry, and the resulting data were compared with matched samples from non-transgenic littermates and transgenic mice carrying wild-type human SOD1 (SOD1WT). Out of 1299 proteins, statistical inference of the data in the three groups identified 14 proteins that were dramatically altered in the ALS mice compared with the two control groups. The protein galectin-3 emerged as a lead biomarker candidate based on its differential expression as assessed by immunoblot and immunocytochemistry in SOD1G93A mice as compared to controls, and because it is a secreted protein that could potentially be measured in human biofluids. Spinal cord tissue from ALS patients also showed increased levels of galectin-3 when compared to controls. Further measurement of galectin-3 in cerebrospinal fluid samples showed that ALS patients had approximately twice as much galectin-3 as normal and disease controls. These results provide the proof of principle that biomarker identification in relevant and well-controlled animal models can be translated to human disease. The challenge is to validate our biomarker candidate proteins as true biomarkers for ALS that will be useful for diagnosis and/or monitoring disease activity in future clinical trials.
Keywords: Motor neuron disease, Galectin-3, human, biomarkers
Introduction
Amyotrophic lateral sclerosis (ALS) is a progressive and fatal neurodegenerative disease characterized by degeneration of motor neurons in the motor cortex, brain stem and spinal cord that leads to muscular weakness, paralysis and death. Hypotheses regarding disease pathogenesis are many and varied, and include aberrant axonal transport, protein aggregation, excitotoxicity, oxidative stress, apoptosis, mitochondrial dysfunction and the more recent concept of abnormal RNA processing 1. Realistically, however, the cause or causes of ALS are unknown, making it difficult to design rational measurements of disease activity that can be used for evaluating the efficacy of proposed therapeutic interventions – i.e. ALS biomarkers.
The discovery of ALS biomarkers, defined as biological indicators of disease presence, activity, and/or progression, will have a major impact on the efficiency of therapeutic clinical trials for this universally fatal motor neuron disease. There are currently no diagnostic tests for ALS. The only validated markers for disease progression in ALS are measures of strength, breathing, and time to death. Discovery of surrogate biomarkers that distinguish ALS from other diseases (diagnostic biomarkers) will facilitate rapid diagnosis and intervention. Additionally, biomarkers that reflect disease progression and response to therapy (prognostic biomarkers) will improve the analysis of clinical trials and allow for more rapid screening of potential new treatments with fewer patients than required for standard placebo-controlled trials 2.
Recent developments in mass spectrometry provide a powerful tool to screen for protein biomarkers. Proteomics studies in ALS mice have been reported 3-5 but none of the studies used ventral root tissue that is enriched in motor neuron fibers, and the results were not validated in human samples. In this study, we employed a proteomics approach in a well-characterized and relevant animal model of ALS – the SOD1G93A mouse 6. Affected tissues (i.e. ventral roots) from these mice were compared directly with the same tissues from age and sex matched littermates as well as mice that overexpress the wild-type SOD1 protein (SOD1WT). Statistical analysis of the raw data identified proteins that were different among the 3 groups, and these proteins were studied further in mouse and then human tissues. One protein, galectin-3 (Gal3) emerged as a protein that was highly enriched SOD1G93A tissues as well as in human ALS spinal cords and spinal fluids. We propose that Gal3 may be a biomarker of ALS that should be further investigated for its potential as a marker for differentiating ALS from disease mimics and for monitoring disease progression and response to therapies.
Materials and Methods
Tissue and cerebrospinal fluid samples
All animal procedures were approved by Emory University's IACUC committee. Human studies were approved by the IRB committees at Emory University and Massachusetts General Hospital. Transgenic C57BL/6J mice overexpressing human wild type or G93A SOD1 were maintained as hemizygotes. Transgenic animals were identified by PCR analysis on tail snip DNA. All mice were anesthetized with intraperitoneal injection of 4% chloral hydrate and perfused systemically with 0.9% saline (37°C) to remove blood from tissues. Tissue samples (ventral root and lumbar spinal cord) were dissected from the transgenic animals and non-transgenic littermates at different ages (approximately 45, 90, and 120 days). Human spinal cord tissues were collected at autopsy from normal controls and from patients dying with neurodegenerative diseases. Spinal fluid (CSF) samples were obtained from Dr. Merit Cudkowicz (Massachusetts General Hospital, Boston). Lumbar puncture (commonly called a spinal tap) is a routine and safe procedure performed in the clinic by the neurologist. CSF samples were centrifuged to remove any cellular elements and frozen within 2 hours after collection at -80°C until use.
Protein profiling by LC-MS/MS approach
Proteins in tissues were extracted by homogenization and sonication in an ice-cold buffer (1 V tissue in 10 V buffer, 50mM HEPES, pH 7.4, 150mM NaCl, 1mM MgCl2, 0.5mM CaCl2, and 1mM DTT) with addition of protease inhibitors (0.1mM PMSF, 1mg/ml leupeptin, and 1mg/ml pepstatin). Protein concentration was determined by Bradford protein assay (Bio Rad) using bovine serum albumin as standard, and further verified by Coomassie staining on SDS gel 7. Protein lysates of ventral roots (∼60μg protein/sample) were reduced with 10mM DTT at 95°C for 5 min, alkylated with 50mM iodoacetamide at 21°C for 30 min, resolved on a 9% SDS gel and stained with Coomassie G250. Each gel lane was cut into twenty bands followed by in-gel trypsin digestion 8. Extracted peptides were dried by Speed Vac. The spinal cord samples from control and ALS animal model at 120 days were analyzed similarly but with fewer fractions (four per sample).
Peptide samples were analyzed by nanoscale LC-MS/MS on an LTQ mass spectrometer (Thermo Finnigan). Peptides were dissolved in buffer A (0.4% acetic acid, 0.005% heptafluorobutyric acid and 5% acetonitrile), loaded onto a 75μm i.d. × 10cm C18 column (5 μm magic C18AQ; pore size, 200 Å; Michrom Bioresources, Auburn, CA)., and then eluted during an 80-min gradient of 10-30% buffer B (0.4% acetic acid, 0.005% heptafluorobutyric acid, 95% acetonitrile; flow rate, ∼250 nl/min). Eluted peptides were analyzed by MS (400–1600 m/z, normal scan rate, 1 μscan, target value of 30,000 for automatic gain control), followed by eight data-dependent MS/MS scans (isolation width of 2 m/z, 35% normalized collision energy, 1 μscan, target value of 5,000 for automatic gain control, 60 sec dynamic exclusion).
Protein identification by tandem mass spectrometry
MS/MS spectra were searched against a mouse reference database from the National Center for Biotechnology Information using the SEQUEST Sorcerer algorithm (version 2.0, SAGE-N) 9 as previously described 7. Searching parameters included mass tolerance of precursor ions (±1.5 Da) and product ion (±0.5 Da), tryptic restriction, fixed mass shift for modification of carboxyamidomethylated Cys (+57.0215 Da), dynamic mass shifts for oxidized Met (+15.9949), three maximal modification sites and three maximal missed cleavages. Only b and y ions were considered during the database match. To evaluate false discovery rate during spectrum-peptide matching, all original protein sequences were reversed to generate a decoy database that was concatenated to the original database 10, 11. The false discovery rate (FDR) was estimated by the number of decoy matches (nd) and total number of assigned matches (nt). FDR = 2*nd/nt, assuming mismatches in the original database were the same as in the decoy database. To remove false positive matches, assigned peptides were grouped by charge state and then filtered by matching scores (XCorr and deltaCn) to values to reduce protein FDR to approximately 0.5%. Furthermore, we removed all proteins identified by a single peptide, which eliminated all decoy matches. If peptides were shared by multiple members of a protein family, the matched members were clustered into a single group. Based on the principle of parsimony, the group was represented by the protein with highest number of assigned peptides, and by other proteins if they were matched by unique peptide(s).
Label-free protein quantification by spectral counts and statistical analysis
To identify differences between the ALS mice and control animals we quantified the proteins in multiple samples based on spectral counts (SC). The spectral counts were first normalized to ensure that the average SC per protein was the same in all datasets 12. G-test was used to judge statistical significance of protein abundance difference 13. Briefly, the G-value of each protein was calculated as shown in equation (1).
| (1) |
where S1 and S2 are the detected spectral counts of a given protein in any of two samples for comparison, respectively, and “ln” is the natural logarithm. Although theoretical distribution of the G values is complex, these values approximately fit to the χ2 distribution (one degree of freedom), allowing the calculation of related p-values 13.
Immunoblotting and Immunocytochemistry
Standard protocols for SDS-PAGE immunoblotting and for immunocytochemistry on paraffin-embedded mouse and human tissues were described previously 14, 15. Antibodies included APOE (Calbiochem # 178468), Gal3 (Santa Cruz, sc-32790 mouse monoclonal Ab for immunocytochemistry, sc-20157 rabbit polyclonal Ab for immunoblotting), SOD1 (Calbiochem), β-tubulin (Developmental Studies Hybridoma Bank), GAPDH (Abcam ab9485-100). Appropriate secondary antibodies were used, and visualization of signals was by ECL for immunoblots (Amersham), and by DAB for immunocytochemistry. Quantitation of immunoblot bands was done on digitized images using Image-J software (http://rsbweb.nih.gov/ij/).
Galectin-3 ELISA
Measurement of Gal3 in spinal fluid samples was performed based on manufacturer's protocol (R and D Systems). Briefly, a standard curve was generated using 0.15 to 10 ng/ml of pure Gal3 provided in the kit. 50μl of CSF from each patient was added to 50μl of biotin conjugate containing a proprietary ELISA buffer. After 2 hours of incubation at room temperature, a colorometric signal was generated by addition of streptavadin-HRP followed by TMB. Relative intensity of the TMB signal was measured at 450nm on a microplate reader, and the amount of Gal3 in the sample was calculated from fitting to the standard curve. After subtracting for background we found the sensitivity in CSF to be about 1 ng/ml. ELISA signals that were below background were calculated as “zero”, which translated to < 1 ng/ml. Group data were compared by non-parametric ANOVA, comparing all motor neuron diseases, other neurological diseases, and healthy controls. Post-test correction for multiple comparisons was done using Mann-Whitney analysis.
Results
Identification of novel proteins altered in ALS mouse model
The experiments were performed in two phases (Fig 1A): (i) discovery phase for large-scale mass spectrometry (MS) analysis of ALS mice and statistical inference, and (ii) validation phase for confirming potential biomarker proteins by traditional approaches in ALS mice and human patients. As ventral roots are composed primarily of axons emanating from motor neurons, we dissected ventral roots from two diseased animals (SOD1G93A), two non-transgenic littermates and another control mouse overexpressing wild type SOD1. The extracted proteins were first compared by SDS PAGE and silver staining. The overall pattern of major bands looked highly similar (Fig 1B), indicating the vast majority of proteins are not altered in ALS mice, whereas the difference in SOD1 level was affirmed by immunoblotting (Fig 1C). To identify differentially expressed proteins, the protein samples resolved on the SDS gel were subjected to in-gel digestion and the resulting peptides were analyzed by extensive LC-MS/MS. Tens of thousands of MS/MS spectra were acquired and analyzed by database searching and stringent data filtering. Finally we accepted 1,299 proteins that were identified by at least two peptides (supplemental Table S1), and these proteins were matched by a total of 9,197 peptides (supplemental Table S2).
Figure 1.
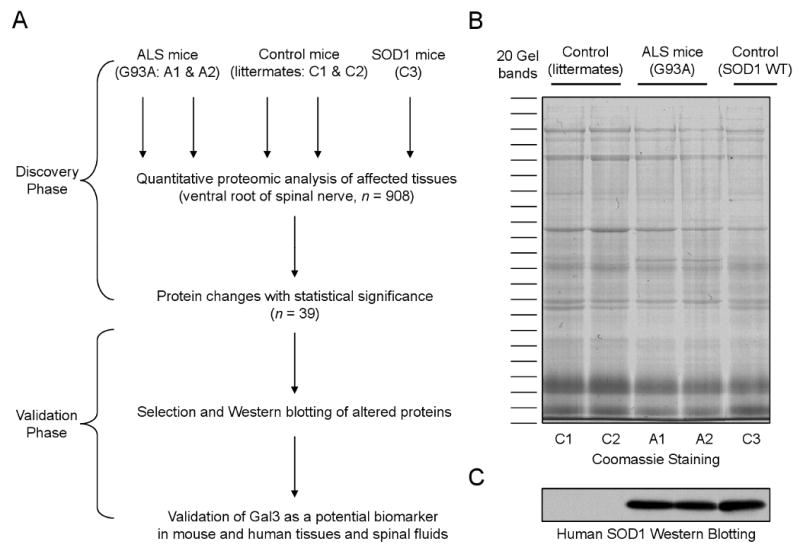
Proteomics analysis of ALS mice.
(A) The scheme for profiling proteins that are changed in ALS mouse model in which SOD1G93A protein (A1 and A2) was overexpressed. The non-transgenic littermates (C1 and C2) as well as SOD1WT overexpressing mice (C3) were used as negative controls.
(B) Total protein lysates of affected tissue (i.e. ventral root from 90 days old animals) were compared on a SDS gel followed by Coomassie staining. Every gel lane was excised into 20 bands for in-gel digestion and LC-MS/MS analysis.
(C) Immunoblotting confirmed genotypes of the mice with or without expression of human SOD1. The samples were loaded in the same order as in panel B.
To compare protein levels in ventral roots of ALS and control mice, we used a label-free quantitative method based on spectral counts 16. The spectral count of a given protein is the summed number of its matching MS/MS spectra. Since the peptide ions are chosen for MS/MS analysis according to the rank of ion intensity, the spectral count of an identified protein is a reasonable index that reflects its abundance in the samples. The label-free method requires reproducibility of the LC-MS/MS runs, and we thus tested run-to-run variation in a series of five runs (Fig 2A). Base peak profiles for the five comparative runs were almost identical, indicating of high consistency of our LC-MS/MS system.
Figure 2.

Evaluation of experimental variations in the proteomics analysis.
(A) Comparable elution profiles of five digested peptide samples indicate consistent LC-MS/MS runs. The five samples were produced from one set of five gel bands, representing the five sample lysates, respectively.
(B) Comparison of the spectral count results of two biological replicates (ALS mouse samples: A1 and A2).
Statistical analyses of the datasets were carried out in multiple steps. (i) The effect of spectral counts on the precision of quantitative analysis was tested by plotting the distribution of spectral counts in two identical samples. For example, the two ALS animals have no theoretical difference in protein composition, and their comparison represents a null experiment and should lead to no change in any protein (Fig 2B). When spectral counts were decreased from a few thousands to the minimal number of 1, the variations of measurement were gradually increased. To account for this effect, we used G-test to derive p values for each protein comparison (see Methods), which indicates the probability of protein change between ALS and control mice. (ii) We defined a p value cutoff to select proteins with significant changes (Table 1). Ideally, the cutoff should accept a very small number of proteins (i.e. false discoveries) in null experiments (e.g. comparison of control 1 versus control 2; or comparison of ALS 1 versus ALS 2). When the same cutoff was applied to ALS-to-control comparison, the list is deemed acceptable with a low false discovery rate. To determine the appropriate cutoff for excluding false discoveries, we dynamically adjusted the p value cutoff from 0.2 to 0.001, and identified that p value of 0.05 was a reasonable threshold with almost zero false discovery rate. (iii) Based on this cutoff, we identified a list of 38 proteins after comparing two ALS mice with two non-transgenic littermates. After further comparison of ALS mice with the third control overexpressing wild type SOD1, the list was reduced to 14 proteins (Table 2). We were able to classify the proteins that were elevated in ALS mice into several functional groups, including ER stress, secretory pathways, cellular structure, metabolism, and proteolysis, suggesting that cellular events involved in ALS pathogenesis are complex and diverse.
Table 1. Evaluation of different thresolds based on spectral-count-derived p values1.
| Threshold | # proteins passing the threshold | ||||||
|---|---|---|---|---|---|---|---|
| Null experiments | Control-ALS comparisons | ||||||
| C1 vs C2 | A1 vs A2 | #False2 | C1 vs A1 | C2 vs A2 | #Accepted3 | FDR4 | |
| 0.2 | 329 | 340 | 18 | 319 | 514 | 92 | 19.6% |
| 0.15 | 287 | 291 | 10 | 273 | 470 | 74 | 13.5% |
| 0.1 | 168 | 190 | 3 | 160 | 332 | 45 | 6.7% |
| 0.09 | 167 | 188 | 2 | 159 | 331 | 45 | 4.4% |
| 0.08 | 149 | 170 | 2 | 147 | 313 | 44 | 4.5% |
| 0.07 | 146 | 163 | 2 | 141 | 304 | 40 | 5.0% |
| 0.06 | 143 | 156 | 2 | 136 | 294 | 38 | 5.3% |
| 0.05 | 135 | 153 | 0 | 133 | 292 | 38 | 0.0% |
| 0.04 | 102 | 105 | 0 | 93 | 213 | 29 | 0.0% |
| 0.03 | 95 | 100 | 0 | 86 | 201 | 24 | 0.0% |
| 0.02 | 86 | 82 | 0 | 77 | 185 | 22 | 0.0% |
| 0.01 | 60 | 56 | 0 | 54 | 140 | 20 | 0.0% |
| 0.005 | 51 | 42 | 0 | 42 | 107 | 15 | 0.0% |
| 0.001 | 35 | 29 | 0 | 31 | 72 | 12 | 0.0% |
The analysis is based on pair-wise comparisons (control: C1 & C2; ALS mice: A1 & A2).
False positives are changed in both null comparisons (C1 vs C2; A1 vs A2).
Proteins are consistently altered in both comparisons (C1 vs A1; C2 vs A2).
FDR (false discovery rate) = #False/#Accepted
Table 2. Selected proteins that are altered in ventral roots of G93A mice1.
| Accession# | Protein names | Spectral counts | p value2 | ||||||
|---|---|---|---|---|---|---|---|---|---|
| C1 | C2 | A1 | A2 | C3 | C1 vs A1 | C2 vs A2 | A vs C3 | ||
| Proteins with increased level in G93A | |||||||||
| ER Stress | |||||||||
| NP_035162.1 | protein disulfide isomerase, prolyl 4-hydroxylase | 11 | 7 | 35 | 48 | 16 | 2.9E-04 | 4.7E-09 | 5.1E-04 |
| NP_031617.1 | calreticulin | 9 | 9 | 22 | 35 | 13 | 1.8E-02 | 5.1E-05 | 1.2E-02 |
| NP_031620.1 | calumenin isoform 1 | 3 | 1 | 10 | 13 | 1 | 4.6E-02 | 4.8E-04 | 9.3E-04 |
| Secretory pathway | |||||||||
| NP_034835.1 | galectin 3 | 0 | 1 | 20 | 18 | 2 | 1.5E-07 | 1.7E-05 | 6.7E-05 |
| NP_031496.2 | apolipoprotein D | 0 | 1 | 15 | 26 | 4 | 5.5E-06 | 7.7E-08 | 3.7E-04 |
| NP_033826.2 | apolipoprotein E | 5 | 5 | 47 | 71 | 7 | 3.9E-10 | 1.3E-16 | 7.7E-12 |
| Cellular structure | |||||||||
| NP_001106959.1 | septin 9 isoform b | 5 | 4 | 15 | 17 | 2 | 2.2E-02 | 3.2E-03 | 4.3E-04 |
| NP_780660.1 | cytoskeleton-associated protein 4 | 4 | 3 | 12 | 21 | 6 | 4.1E-02 | 9.7E-05 | 1.9E-02 |
| Metabolism | |||||||||
| NP_034551.2 | hexosaminidase A | 0 | 0 | 5 | 18 | 0 | 9.1E-03 | 6.4E-07 | 4.9E-05 |
| NP_034552.1 | hexosaminidase B | 0 | 0 | 14 | 36 | 0 | 1.1E-05 | 1.8E-12 | 4.3E-09 |
| Proteolysis | |||||||||
| NP_031824.1 | cathepsin B preproprotein | 0 | 0 | 5 | 14 | 0 | 9.1E-03 | 1.1E-05 | 2.1E-04 |
| NP_059068.1 | lysozyme 2 | 1 | 2 | 8 | 10 | 0 | 1.3E-02 | 1.6E-02 | 4.4E-04 |
| Proteins with decreased level in G93A | |||||||||
| NP_031736.1 | creatine kinase, muscle | 187 | 282 | 115 | 70 | 254 | 3.1E-05 | 1.3E-31 | 1.2E-18 |
| NP_058034.1 | myosin light chain | 3 | 28 | 0 | 0 | 6 | 4.4E-02 | 5.1E-10 | 4.2E-03 |
Results of two SOD1 G93A mutant mice (A1 and A2), two littermates (C1 and C2) and WT SOD1 overexpressing mice (C3)
The proteins detected in the spinal cord samples were further filtered by the same cutoff (p value < 0.05).
The p values were derived from G-test. In A vs C3 comparison, average spectral counts of A1 and A2 were used.
Validation of protein changes in ALS mice
To verify the findings from the proteomic analysis we analyzed mouse tissues by immunoblotting of selected candidates. Comparison of ventral roots from ALS mice vs. littermate and SOD1WT controls confirmed the relative specificity of ApoE and Gal3 in SOD1G93A (Fig 3A). Further confirmation of specificity was sought in spinal cord homogenates from these animals (Fig 3B). Interestingly, the protein that remained specific for the SOD1G93A was Gal3, and the Gal3 level was only increased in symptomatic stage (118 days) but not in presymptomatic stage (47 days) (Fig 3c). At 118 days SOD1WT mice showed very little expression of Gal3 in the lumbar spinal cord, suggesting that the increase in Gal3 in the SOD1G93A was not just a phenomenon of ageing. Strikingly, immunocytochemistry using the Gal3 antibody corroborated the findings on immunoblot, showing intense staining in SOD1G93 lumbar spinal cord, and little to no staining in controls (Fig 3D).
Figure 3.

Validation of protein changes in multiple tissues of ALS and control mice by immunoblotting.
(A) ApoE and Gal3 were highly elevated in ventral roots of ALS mouse.
(B) Only Gal3 was increased in spinal cord of ALS mice when compared to SOD1WT mice.
(C) Gal3 was upregulated in symptomatic ALS mice, but not in presymptomatic or age-matched SOD1WT mice.
(D) Gal3 was elevated in ALS mouse spinal cord shown by immunocytochemistry (ICC).
Analysis of Gal3 in human tissues
Spinal cord and brain tissues from patients who died with ALS (n = 9), other neurodegenerative diseases including Alzheimer's disease (n = 13) and Lewy body dementia (n = 2) and from “control” tissues without neuropathological abnormalities (n = 2) were subjected to immunoblotting and immunocytochemistry. Spinal cord homogenates from ALS patients showed significantly higher amounts (∼4 fold) of Gal3 as compared to both disease and normal controls (Fig 4). This same differential staining was seen by immunocytochemistry (Fig 5). Spinal cord and brainstem sections from ALS patients showed a relative increase in immunoreactivity with Gal3 antibodies, most consistently within the regions of the corticospinal tracts (Fig 5A-D). In sections containing both ventral and dorsal spinal roots, the ventral roots displayed higher intensity of staining as compared to the dorsal roots (Fig 5E-F). We did not see staining of neuronal cell bodies – staining was generally confined to cells with the appearance of glia. In an effort to identify the cells expressing Gal3 we stained serial sections with antibodies to Gal3, GFAP (for astrocytes), and Iba1 (for microglia/macrophages). As shown in Fig 5G-N, this analysis identified the majority of cells expressing Gal3 as microglia/macrophages.
Figure 4.

Gal3 protein is upregulated in human ALS spinal cord.
(A) Immunoblotting analysis of homogenized spinal cords from 9 ALS patients, 2 controls (normal individuals) and 15 other neurological diseases (ND), stained with antibodies against GAPDH and Gal3 (rabbit polyclonal Ab).
(B) Quantitative analysis of Gal3 level in all cases, normalized by the intensity of GAPDH.
(C) Validation of the immunoblotting results using another Gal3 antibody (mouse monoclonal Ab).
Figure 5.
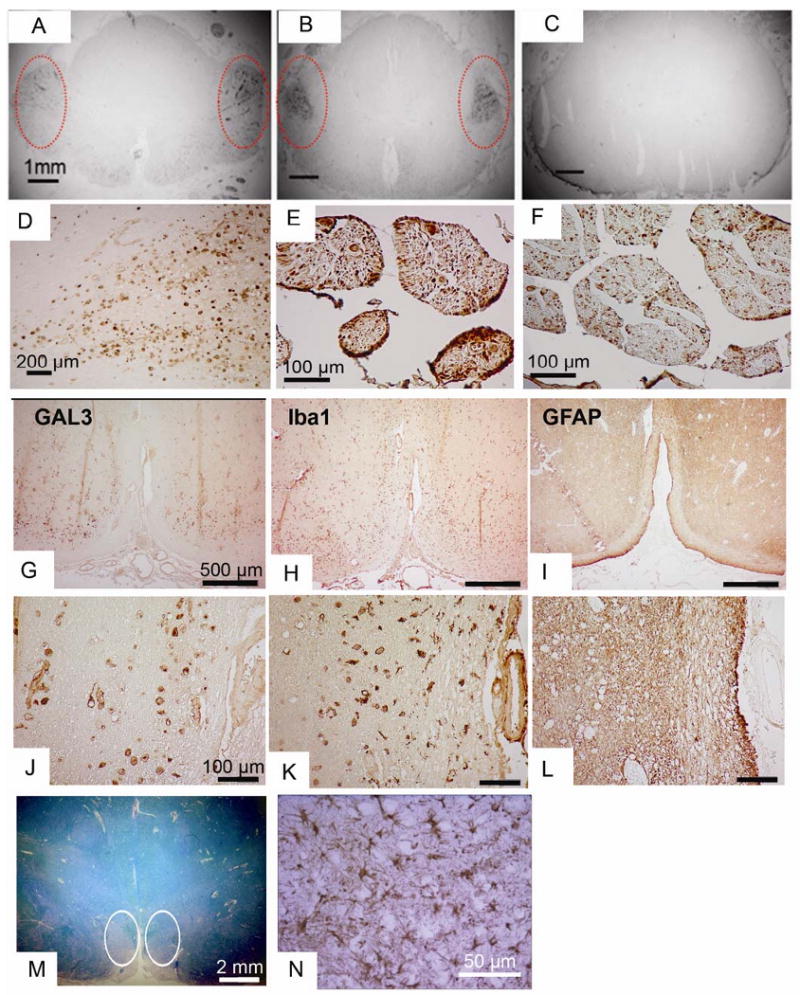
ICC analysis of Gal3 in human ALS tissues.
(A-C) Gal3 ICC in spinal cord sections from ALS (A and B) and Alzheimer Disease (C). Note the intense staining in the regions of the corticospinal tracts in the ALS cases (circled)
(D) Higher power of the region of corticospinal tracts.
(E-F) In the same ALS patient, Gal3 staining is more prominent in the ventral (E) vs. the dorsal (F) root.
(G-N) Serial sections from the ventral medulla from an ALS patient stained for Gal3, GFAP, and Iba1 in the region of the pyramidal tracts, at low power (G, H, I) and high power (J, K, L). The pallor seen on luxol fast blue (M, circled) indicates the ongoing axonal degeneration. The macrophage marker Iba1 shows prominent staining in similar pattern to Gal3, but the astrocyte marker GFAP shows little staining in this region. Serving as an internal control for GFAP staining is another region of the same tissue section showing the presence of reactive astrocytes (N).
As Gal3 is a secretory protein, we further examined Gal3 level in human spinal fluids by ELISA. The samples were collected from patients of motor neuron diseases (MND, n = 37), other neurological diseases (OND, n = 24), and normal controls (n = 21) (Fig 6). The MND group included patients characterized at the time of sampling as sporadic ALS (n = 30), lower motor neuron disease (n = 4) and upper motor neuron disease (n = 3). The OND group included patients with peripheral neuropathy (n = 9, including one patient with multifocal motor neuropathy), hydrocephalus (n = 5), stroke or hemiparesis (n = 3), dementia (n = 2), and 1 patient each with Lyme disease, Bell's palsy, multiple sclerosis, Parkinsonism, and HSV meningitis. Gal3 was below the limit of detection of 1 ng/ml in 10 samples from patients with MND (27%), 10 from OND (41%), and 7 from normal controls (33%). In those samples where Gal3 was detected, the mean level was significantly higher in MND (2.17 ± 1.5 ng/ml) as compared to both OND (1.6 ± 0.48 ng/ml) and normal controls (1.59 ± 0.34 ng/ml), suggesting that Gal3 in the CSF may be a marker for motor neuron diseases.
Figure 6.

The Gal3 level is increased in the CSF of ALS patients.
(A) The standard curve of ELISA analysis to show dynamic range of the method. Recombinant Gal3 was used in the titration.
(B) Analysis of Gal3 protein in CSF samples by ELISA. Although the Gal3 level is variable in individuals, it still shows increased abundance in motor neuron disease (MND) patients, when compared to other neurological diseases (OND) and normal control cases. When values below the level of detection are excluded (assigned to be zero), the significance of the difference increases. The data indicate the mean and the standard error of the mean. The statistical analysis was performed between MND and all other cases based on two-tailed student t-test.
Discussion
We approached the problem of biomarker discovery for ALS using a paradigm of large-scale proteomic profiling of biologically affected tissues in a relevant animal model in order to select protein candidates that could potentially differentiate diseased from non-diseased tissues 17. Candidate proteins were then stratified for their potential as a human biomarker, in this case a protein secreted into biofluids, and these proteins were verified with immunoblotting and immunocytochemistry in the ALS animal. Finally, the most promising candidate protein, Gal3 was tested in human tissue and CSF samples for the ability to differentiate ALS from controls and other neurodegenerative diseases. For this discovery phase of a search for disease biomarkers, the unbiased analysis of tissues from an animal model holds several advantages over the direct measurement from human specimens. Initiating a search by analysis of human tissue samples is fraught with many confounding factors, including genetic variation and variability in disease phenotypes. Sample preparation from humans is also subject to day-to-day variability. Mice are easier since they are genetically identical and live in a defined environment. Of course, animal models may not reflect true human pathology and therefore targets identified in animals must be validated in humans with ALS.
We reasoned that ventral roots SOD1G93A ALS mice, since they contain motor axons that are the extensions of the primary cells affected in both mouse and human ALS, were a good starting point for finding candidate biomarkers of ALS. In an analysis of 1,299 proteins from the ventral roots we identified 14 proteins that showed significant quantitative differences when compared to age-matched, non-transgenic littermates and transgenic mice overexpressing the wild-type human SOD1 protein. Twelve proteins that were increased in the SOD1G93A mice were organized into five categories based on known functions. In order to pare down this list to a manageable number for initial verification and validation, we chose proteins that could be investigated with commercially available antibodies. Because we are interested in identifying a biomarker that may potentially be measurable in human biofluids, we focused on two secreted proteins (Gal3 and ApoE), and verified the specific increase in Gal3 by immunoblot and immunocytochemistry in ventral root and spinal cord tissues from SOD1G93A mice. Importantly, the amount of Gal3 protein in spinal cord tissues from ALS mice increased from early to late disease, supporting the possibility that Gal3 levels might correspond with disease progression. ApoE did not maintain the specificity in spinal cord of SOD1G93A when subjected to this verification process, suggesting of tissue specificity in the ALS mouse.
To further explore the difference between ventral root and spinal cord tissues, we analyzed spinal cord tissues collected from an ALS mouse and a control littermate (120 days), leading to identification of 266 proteins with at least two matched peptides (supplemental table S3 and S4). Out of these spinal cord proteins, 96% were identified in both ALS and control tissues, indicating relatively small technical and biological variances. However, when comparing the list of spinal cord proteins with the top 266 proteins identified in ventral roots (with highest spectral counts), only 40% proteins were overlapped. The results further validated the difference in proteome composition between the two tissues. More comprehensive proteomic comparison of the two tissues in ALS is worthy of future study to facilitate the selection of altered proteins in both disease-affected tissues.
For translation of our mouse data to human ALS, human tissues from ALS patients, other neurodegenerative diseases, and normal controls were probed for the presence of Gal3. Compared to controls, immunoblot analysis showed a striking increase of Gal3 level in spinal cord tissues of ALS patients, and immunocytochemistry identified Gal3 staining in ALS patients in the regions of the corticospinal tracts. Neuronal cell bodies did not stain for Gal3, but investigation of several cases with astrocyte and microglial/macrophage markers suggested that microglia/macrophages are the prominent cell population expressing Gal3. Finally, and most importantly for the development of a biomarker that can be used in life, CSF samples from ALS patients also showed a relative increase in Gal3 as compared to disease and healthy controls. This positive finding is especially motivating since the analysis was relatively crude, using stored CSF samples and a commercially available kit. We assume that this assay can be further optimized for sensitivity and reproducibility, potentially demonstrating even greater usefulness in differentiating ALS patients from controls. Of course, the usefulness of Gal3, or any protein as a biomarker is not limited to its ability to differentiate ALS from non-ALS. Indeed, a protein biomarker that does not differentiate among diseases can still be extraordinarily useful if it provides clues to disease pathogenesis or if the level of the biomarker changes with disease progression, which may provide a surrogate marker for disease activity for clinical trials. Currently, we do not have longitudinal samples to test whether Gal3 protein levels increase with disease progression.
Gal3, also known as Mac2, is a member of the evolutionarily conserved family of galectins that recognize galactose-containing oligosaccharides. There is an extensive literature regarding the possible roles of Gal3 in a variety of human diseases, ranging from rheumatologic and cardiac disease, to diabetes and thyroid cancers 18. In nervous system disorders, Gal3 has been proposed as a marker for glial tumors 19 and has a demonstrated role in animal models of nerve regeneration 20 and experimental allergic encephalomyelitis 21. A gene profiling study in a different ALS mouse model (SOD1 G86R) showed increased levels of Gal3 mRNA in both muscle and spinal cords of affected animals, though protein levels were not measured 22. Other proteomics-based studies in both animal models and human ALS did not identify Gal3 as a biomarker 3, 23-25, however the techniques and tissue sources in each were quite different from those in our study.
Gal3 can be expressed by most cell types, and has been identified in the CNS and PNS in astrocytes, macrophages/microglia, endothelial cells, and Schwann cells. Immunocytochemistry on serial sections from ALS spinal cords and brainstem demonstrated that the majority of Gal3 co-localized with markers for microglia and macrophages, though we cannot rule out expression by astrocytes. Neuronal populations did not react with antibodies to Gal3. The Gal3 expression in macrophages/microglia is not surprising since Gal3 is typically associated with immune activation and regulation 26. Indeed, Gal3 is expressed by microglia phagocytosing myelin after traumatic or inflammatory lesions of the CNS 27. This finding is also consistent with other published data demonstrating the presence of inflammatory markers in ALS tissues and CSF 28, 29. However, it is also interesting to note that our proteomic data specifically did not identify proteins such as interleukin 1, TNF alpha, and beta 2 microglobulin, that might be expected if the elevation of Gal3 represents just a non-specific marker of macrophage/microglial activation.
Speculation of a possible biological role for Gal3 in the pathogenesis of ALS can be generated from perspective of the several known actions of this protein. For example, Gal3 can act as a pro or anti-apoptotic protein 30, with the generalization that intracellular Gal3 is antiapoptotic, and extracellular Gal3 is proapototic 18. The majority of data supporting these actions of Gal3 come from the cancer literature and it is unclear whether Gal3 can have similar affects in the nervous system. However, Gal3 has been shown to modulate the response to injury in the nervous system. Studies in Gal3 knockout mice demonstrate that expression of Gal3 inhibits peripheral nerve regeneration after axotomy 20, and exacerbates CNS damage in EAE 21. In the latter study it was proposed that Gal3 intensifies the immune-mediated injury by suppressing the production of the anti-inflammatory cytokine IL-10, leading to an enhanced inflammatory response. It is interesting to note that IL-10 has been suggested as a neuroprotective cytokine released from microglia during the course of ALS progression 31.
It is important to note that a useful biomarker need not be specific for ALS. Specificity is necessary only when the biomarker is used to differentiate disorders that have potentially overlapping phenotypes (diagnostic biomarker). We expect that Gal3 may be elevated in tissues and CSF of many neurological diseases that show microglia activation or inflammation. However, protein biomarkers that correlate with progression could be important markers of disease activity, and thus could be used as surrogate markers of clinical response in therapeutic trials. This type of disease biomarker would improve the efficiency of trials by prognosticating whether a drug is active in ameliorating disease. Of course, this utility of a protein biomarker will depend on prospective measurements in ALS patients during the course of disease, and the demonstration that a protein biomarker does indeed correlate with disease progression.
Conclusion
Using recently developed proteomics strategy, we profile proteins in disease-affected ventral roots in ALS mouse model, leading to the identification of 14 proteins with statistically significant changes. One of the proteins (Gal3) was further validated in spinal cords of the animal model, and more interestingly, in human ALS spinal cords and CSF. The Gal3 elevation appears to be indicative to the onset of ALS symptom in mice. Given its secretory nature and detectable level in CSF, it is a potential biomarker for ALS that is worth further evaluation in a prospective cohort of patients, and potentially in future clinical trials.
Supplementary Material
Acknowledgments
We thank Drs. A. Levey, P. Xu and N. T. Seyfried for valuable comments regarding the manuscript, Matt Jaffa for assistance with CSF samples, and Dr. Marla Gearing and Deborah Cooper for providing the human spinal cord tissues. We also thank Dr. R. Cummings for providing purified Gal3 proteins. This work was supported by the National Institutes of Health grants (P50AG025688, R21NS060182, and P30NS055077) and the Amyotrophic Lateral Sclerosis Association. Importantly, we thank the patients and families who contributed tissues and CSF samples, without which this kind of research could not be accomplished.
References
- 1.Lagier-Tourenne C, Cleveland DW. Rethinking ALS: the FUS about TDP-43. Cell. 2009;136(6):1001–4. doi: 10.1016/j.cell.2009.03.006. [DOI] [PMC free article] [PubMed] [Google Scholar]
- 2.Cudkowicz ME, Katz J, Moore DH, O'Neill G, Glass JD, Mitsumoto H, Appel S, Ravina B, Kieburtz K, Shoulson I, Kaufmann P, Khan J, Simpson E, Shefner J, Levin B, Cwik V, Schoenfeld D, Aggarwal S, McDermott MP, Miller RG. Toward more efficient clinical trials for amyotrophic lateral sclerosis. Amyotroph Lateral Scler. 2010;11(3):259–65. doi: 10.3109/17482960903358865. [DOI] [PubMed] [Google Scholar]
- 3.Zhai J, Strom AL, Kilty R, Venkatakrishnan P, White J, Everson WV, Smart EJ, Zhu H. Proteomic characterization of lipid raft proteins in amyotrophic lateral sclerosis mouse spinal cord. FEBS J. 2009;276(12):3308–23. doi: 10.1111/j.1742-4658.2009.07057.x. [DOI] [PMC free article] [PubMed] [Google Scholar]
- 4.Bergemalm D, Forsberg K, Jonsson PA, Graffmo KS, Brannstrom T, Andersen PM, Antti H, Marklund SL. Changes in the spinal cord proteome of an amyotrophic lateral sclerosis murine model determined by differential in-gel electrophoresis. Mol Cell Proteomics. 2009;8(6):1306–17. doi: 10.1074/mcp.M900046-MCP200. [DOI] [PMC free article] [PubMed] [Google Scholar]
- 5.Lukas TJ, Luo WW, Mao H, Cole N, Siddique T. Informatics-assisted protein profiling in a transgenic mouse model of amyotrophic lateral sclerosis. Mol Cell Proteomics. 2006;5(7):1233–44. doi: 10.1074/mcp.M500431-MCP200. [DOI] [PubMed] [Google Scholar]
- 6.Gurney ME, Pu H, Alexander DD, Kwon YW, Zhai P. Motor Neuron Degeneration in Mice That Express a Human Cu,Zn Superoxide Dismutase Mutation. Science. 1994;264(5166):1772–1775. doi: 10.1126/science.8209258. [DOI] [PubMed] [Google Scholar]
- 7.Xu P, Duong DM, Peng J. Systematical optimization of reverse-phase chromatography for shotgun proteomics. Journal of proteome research. 2009;8(8):3944–50. doi: 10.1021/pr900251d. [DOI] [PMC free article] [PubMed] [Google Scholar]
- 8.Shevchenko A, Wilm M, Vorm O, Mann M. Mass spectrometric sequencing of proteins silver-stained polyacrylamide gels. Anal Chem. 1996;68(5):850–8. doi: 10.1021/ac950914h. [DOI] [PubMed] [Google Scholar]
- 9.Eng J, McCormack AL, Yates JR., 3rd An approach to correlate tandem mass spectral data of peptides with amino acid sequences in a protein database. J Am Soc Mass Spectrom. 1994;5:976–989. doi: 10.1016/1044-0305(94)80016-2. [DOI] [PubMed] [Google Scholar]
- 10.Peng J, Elias JE, Thoreen CC, Licklider LJ, Gygi SP. Evaluation of multidimensional chromatography coupled with tandem mass spectrometry (LC/LC-MS/MS) for large-scale protein analysis: the yeast proteome. J Proteome Res. 2003;2:43–50. doi: 10.1021/pr025556v. [DOI] [PubMed] [Google Scholar]
- 11.Elias JE, Gygi SP. Target-decoy search strategy for increased confidence in large-scale protein identifications by mass spectrometry. Nat Methods. 2007;4(3):207–14. doi: 10.1038/nmeth1019. [DOI] [PubMed] [Google Scholar]
- 12.Kislinger T, Cox B, Kannan A, Chung C, Hu P, Ignatchenko A, Scott MS, Gramolini AO, Morris Q, Hallett MT, Rossant J, Hughes TR, Frey B, Emili A. Global survey of organ and organelle protein expression in mouse: combined proteomic and transcriptomic profiling. Cell. 2006;125(1):173–86. doi: 10.1016/j.cell.2006.01.044. [DOI] [PubMed] [Google Scholar]
- 13.Seyfried NT, Gozal YM, Dammer EB, Xia Q, Duong DM, Cheng D, Lah JJ, Levey AI, Peng J. Multiplex SILAC analysis of a cellular TDP-43 proteinopathy model reveals protein inclusions associated with SUMOylation and diverse polyubiquitin chains. Mol Cell Proteomics. 2010;9(4):705–18. doi: 10.1074/mcp.M800390-MCP200. [DOI] [PMC free article] [PubMed] [Google Scholar]
- 14.Glass JD, Schryer BL, Griffin JW. Calcium-mediated degeneration of the axonal cytoskeleton in the Ola mouse. Journal of Neurochemistry. 1994;62(6):2472–5. doi: 10.1046/j.1471-4159.1994.62062472.x. [DOI] [PubMed] [Google Scholar]
- 15.Fischer LR, Culver DG, Tennant P, Davis AA, Wang M, Castellano-Sanchez A, Khan J, Polak MA, Glass JD. Amyotrophic lateral sclerosis is a distal axonopathy: evidence in mice and man. Experimental Neurology. 2004;185(2):232–40. doi: 10.1016/j.expneurol.2003.10.004. [DOI] [PubMed] [Google Scholar]
- 16.Liu H, Sadygov RG, Yates JR., 3rd A model for random sampling and estimation of relative protein abundance in shotgun proteomics. Anal Chem. 2004;76(14):4193–201. doi: 10.1021/ac0498563. [DOI] [PubMed] [Google Scholar]
- 17.Rifai N, Gillette MA, Carr SA. Protein biomarker discovery and validation: the long and uncertain path to clinical utility. Nature biotechnology. 2006;24(8):971–83. doi: 10.1038/nbt1235. [DOI] [PubMed] [Google Scholar]
- 18.Dumic J, Dabelic S, Flogel M. Galectin-3: an open-ended story. Biochimica et Biophysica Acta. 2006;1760(4):616–35. doi: 10.1016/j.bbagen.2005.12.020. [DOI] [PubMed] [Google Scholar]
- 19.Park SH, Min HS, Kim B, Myung J, Paek SH. Galectin-3: a useful biomarker for differential diagnosis of brain tumors. Neuropathology. 2008;28(5):497–506. doi: 10.1111/j.1440-1789.2008.00909.x. [DOI] [PubMed] [Google Scholar]
- 20.Narciso MS, Mietto Bde S, Marques SA, Soares CP, Mermelstein Cdos S, El-Cheikh MC, Martinez AM. Sciatic nerve regeneration is accelerated in galectin-3 knockout mice. Experimental Neurology. 2009;217(1):7–15. doi: 10.1016/j.expneurol.2009.01.008. [DOI] [PubMed] [Google Scholar]
- 21.Jiang HR, Al Rasebi Z, Mensah-Brown E, Shahin A, Xu D, Goodyear CS, Fukada SY, Liu FT, Liew FY, Lukic ML. Galectin-3 deficiency reduces the severity of experimental autoimmune encephalomyelitis. Journal of Immunology. 2009;182(2):1167–73. doi: 10.4049/jimmunol.182.2.1167. [DOI] [PubMed] [Google Scholar]
- 22.Gonzalez de Aguilar JL, Niederhauser-Wiederkehr C, Halter B, De Tapia M, Di Scala F, Demougin P, Dupuis L, Primig M, Meininger V, Loeffler JP. Gene profiling of skeletal muscle in an amyotrophic lateral sclerosis mouse model. Physiol Genomics. 2008;32(2):207–18. doi: 10.1152/physiolgenomics.00017.2007. [DOI] [PubMed] [Google Scholar]
- 23.Fukada K, Zhang F, Vien A, Cashman NR, Zhu H. Mitochondrial proteomic analysis of a cell line model of familial amyotrophic lateral sclerosis. Mol Cell Proteomics. 2004;3(12):1211–23. doi: 10.1074/mcp.M400094-MCP200. [DOI] [PMC free article] [PubMed] [Google Scholar]
- 24.Bowser R, Cudkowicz M, Kaddurah-Daouk R. Biomarkers for amyotrophic lateral sclerosis. Expert Rev Mol Diagn. 2006;6(3):387–98. doi: 10.1586/14737159.6.3.387. [DOI] [PubMed] [Google Scholar]
- 25.Ranganathan S, Williams E, Ganchev P, Gopalakrishnan V, Lacomis D, Urbinelli L, Newhall K, Cudkowicz ME, Brown RH, Jr, Bowser R. Proteomic profiling of cerebrospinal fluid identifies biomarkers for amyotrophic lateral sclerosis. Journal of Neurochemistry. 2005;95(5):1461–71. doi: 10.1111/j.1471-4159.2005.03478.x. [DOI] [PMC free article] [PubMed] [Google Scholar]
- 26.Filer A, Bik M, Parsonage GN, Fitton J, Trebilcock E, Howlett K, Cook M, Raza K, Simmons DL, Thomas AM, Salmon M, Scheel-Toellner D, Lord JM, Rabinovich GA, Buckley CD. Galectin 3 induces a distinctive pattern of cytokine and chemokine production in rheumatoid synovial fibroblasts via selective signaling pathways. Arthritis and Rheumatism. 2009;60(6):1604–14. doi: 10.1002/art.24574. [DOI] [PMC free article] [PubMed] [Google Scholar]
- 27.Rotshenker S, Reichert F, Gitik M, Haklai R, Elad-Sfadia G, Kloog Y. Galectin-3/MAC-2, Ras and PI3K activate complement receptor-3 and scavenger receptor-AI/II mediated myelin phagocytosis in microglia. Glia. 2008;56(15):1607–13. doi: 10.1002/glia.20713. [DOI] [PubMed] [Google Scholar]
- 28.Moreau C, Devos D, Brunaud-Danel V, Defebvre L, Perez T, Destee A, Tonnel AB, Lassalle P, Just N. Elevated IL-6 and TNF-alpha levels in patients with ALS: inflammation or hypoxia? Neurology. 2005;65(12):1958–60. doi: 10.1212/01.wnl.0000188907.97339.76. [DOI] [PubMed] [Google Scholar]
- 29.Brettschneider J, Mogel H, Lehmensiek V, Ahlert T, Sussmuth S, Ludolph AC, Tumani H. Proteome analysis of cerebrospinal fluid in amyotrophic lateral sclerosis (ALS) Neurochemical Research. 2008;33(11):2358–63. doi: 10.1007/s11064-008-9742-5. [DOI] [PubMed] [Google Scholar]
- 30.Li X, Ma Q, Wang J, Liu X, Yang Y, Zhao H, Wang Y, Jin Y, Zeng J, Li J, Song L, Li P, Qian X, Cao C. c-Abl and Arg tyrosine kinases regulate lysosomal degradation of the oncoprotein Galectin-3. Cell Death Differ. 2010;17(8):1277–87. doi: 10.1038/cdd.2010.8. [DOI] [PubMed] [Google Scholar]
- 31.Henkel JS, Beers DR, Zhao W, Appel SH. Microglia in ALS: the good, the bad, and the resting. J Neuroimmune Pharmacol. 2009;4(4):389–98. doi: 10.1007/s11481-009-9171-5. [DOI] [PubMed] [Google Scholar]
Associated Data
This section collects any data citations, data availability statements, or supplementary materials included in this article.