

Abstract
Transcriptional silencing of tumor suppressor genes and other cancer-related genes induced by promoter CpG island hypermethylation is an important epigenetic mechanism of hepatocarcinogenesis. Previous studies have established methylation profiles of hepatocellular carcinomas (HCCs) and demonstrated that methylation of several candidate genes in resected tissues may be associated with time to recurrence. The goals of our study were to test whether specific promoter methylation and mRNA levels of candidate genes, as well as global changes in DNA methylation, can be linked with time to recurrence and clinicopathological variables in a homogenous study group of HCC patients. Forty-three tumorous and 45 non-tumorous liver tissue samples from the surgical margin were obtained from HCV-positive, HBV-negative HCC patients who underwent tumor resection surgery and who were monitored for tumor recurrence thereafter (median follow-up time: 16 months (range, 0 – 79 months)). Methylation-specific PCR was used to assess the promoter methylation status of P16(INK4a), SOCS-1, RASSF1A, APC, GSTP1, RIZ1, and MGMT genes, while the level of LINE-1 methylation was used as marker of global DNA methylation levels. Methylation frequencies in P16(INK4a), RASSF1A, APC, GSTP1, and RIZ1 genes were significantly greater in tumorous versus non-tumorous tissues. Methylation of RIZ1 in non-tumorous tissues was significantly associated with time to recurrence. Additionally, genomic DNA was significantly more hypomethylated in tumorous tissues, and this change was associated with shorter recurrence, but not with clinicopathological features. In conclusion, this study supports the role of aberrant methylation in the pathobiology of HCV-positive HCCs. The finding that RIZ1 methylation and increased levels of LINE-1 hypomethylation in non-tumorous tissues are associated with time to recurrence underscores the importance of assessing the epigenetic state of the liver remnant.
Keywords: hepatocellular carcinoma, epigenetics, time to recurrence
1. Introduction
Hepatocellular carcinoma (HCC) is the fifth most common and the third most fatal malignancy worldwide [1]. While the incidence of many cancers is declining, HCC incidence continues on the upward trajectory over the last three decades in many countries, including the U.S. and Japan. Over 80% of hepatocellular carcinoma cases are attributable to four major causes: infection with hepatitis C (HCV) or B (HBV) viruses, chronic alcohol consumption, and/or exposure to aflatoxin B1 [2]. Profound geographic variation in HCC incidence and etiology is well known; the highest density of cases occur in Southeast Asia and are associated primarily with chronic HBV (China), or HCV (Japan) infection [3,4]. It is widely believed that the continuous epidemic of HCV largely accounts for the observed increase in HCC incidence [4,6]. Clinical management of HCC is challenging due both to the lack of diagnostic and prognostic biomarkers and resistance of HCC to chemotherapy and radiation treatment. Tumor resection and ablation are common clinical choices; however, survival is poor, with a 5-year recurrence rate of over 75% and a 5-year survival as low as 50% [7,8]. Though clinicopathological features are useful in identifying patients who are at-risk for recurrence, molecular predictors have also been proposed [9,10].
In liver and other tissues, gene-specific promoter hypermethylation is increasingly recognized as a common epigenetic event throughout all stages of carcinogenesis [11–13]. Several studies have shown aberrant hypermethylation of P16(INK4a), RASSF1A, SOCS-1, GSTP1, APC, RIZ1, and MGMT in HCC [14–19]. Furthermore, methylation profiling of HCC has been successful in characterizing some of the antecedent methylation changes of specific genes in cancer initiation and promotion, aberrations that have been shown to accompany distinct, sequential histopathologic steps during hepatocarcinogenesis [17,20,21]. This has been crucial in providing evidence for field cancerization of HCC, the notion that HCC recurrences represent formations of additional field tumors that develop from patches of genetically and epigenetically dysregulated preneoplastic cells in the diseased liver [22,23]. In addition, it has been suggested that the methylation status of many of these genes can be predictive of recurrence-free and overall survival, albeit there is some inconsistency between the studies for individual genes as predictive biomarkers. Even in relatively small study groups (60 pairs of tumorous and adjacent non-tumorous tissues or fewer), the methylation status of GSTP1, CDH1, P16(INK4a), CRABP1, and SYK in tumorous tissues corresponds to shortened overall survival [17,24,25], while specific promoter hypermethylation of MGMT in tumorous tissues and RIZ1 in the non-tumorous tissues have been reported as associated with time to recurrence [18].
Underpinning the complex and aberrant epigenetic milieu of hepatocarcinogenesis, gene-specific hypermethylation is often accompanied by global genomic hypomethylation, an epigenetic event associated with oncogene activation and overall genomic instability during carcinogenesis [26]. Though several studies offer conflicting reports of the relationship between global DNA hypomethylation and hypermethylation of specific genes [25,27], it has been demonstrated that global DNA hypomethylation in tumorous tissues is inversely correlated with overall patient survival in studies consisting of 60 [26] or 85 samples [28].
However, most of the previous reports that have examined epigenetic changes in HCC consisted of patient study groups that were heterogeneous with respect to the underlying disease etiology. Additionally, epigenetic studies of HCC only seldom include simultaneous analyses of both methylation status and gene expression levels. Thus, characterization of epigenetic and gene expression changes specific to HCV-positive/HBV-negative disease etiology and identification of genes whose promoter methylation status might be predictive of time to recurrence were paramount goals of this study. We determined both global DNA methylation levels and gene-specific methylation status in tumorous and adjacent non-tumorous tissues in an etiologically and geographically distinct study group of HCC patients, compared the association between promoter methylation and gene expression, and analyzed the relationship between these epigenetic aberrations and both clinicopathological variables and time to recurrence.
2. Materials and Methods
2.1 Patient study group and sample collection
The study group consisted of 49 HCV-positive, HBV-negative subjects with primary HCCs who underwent curative resection surgery at the University of Yamanashi Hospital (Yamanashi Prefecture, Japan) between 2000 and 2007 (mean age = 66.2 ± 8.1 years; 37 males and 12 females). A summary of the clinicopathological characteristics of the study group can be found in Tsuchiya et al., 2010 [29]. After surgery, patients returned monthly to the clinic for follow-up tests. Ultrasounds or computed tomography scans of the liver were performed every 3 or 6 months, respectively, to determine the time to recurrence. Follow-up continued until a detectable recurrence, patient death, or the end of the study in July 2008 (median follow-up: 16 months (range, 0 – 79 months)). Written, informed consent was obtained in accordance with the Institutional Board on Ethics for Human Science at the University of Yamanashi. Following removal of the tumor(s), fresh tissue samples were collected from the tumorous and the non-tumorous surgical margin, frozen in liquid nitrogen and stored at −80º C until laboratory processing. Due to insufficient tissue quantities from several of the patients, 43 tumorous and 45 non-tumorous tissue samples were used in the present study, representing 39 paired tissue samples from the same patients. DNA samples from 10 non-transplant grade human livers (free from liver disease according to the pathology reports) were kindly provided by Drs. Stephen Ferguson and Jonathan Jackson (LifeTechnologies, Durham, NC) and used as controls.
2.2 DNAisolation and sodium bisulfite conversion
DNA was isolated from frozen tissue samples by a procedure that was slightly modified from one reported previously [30]. Briefly, tissue was mechanically lysed with a Retsch Tissue Lyser (Qiagen, Valencia, CA) then subjected to a Cell Lysis Solution (5 Prime Inc., Gaithersburg, MD) and proteinase K (Roche Diagnostics, Indianapolis, IN) digestion, followed by incubation with Protein Precipitation Solution (5 Prime Inc., Gaithersburg, MD). Nucleic acids were precipitated with 100% isopropanol and RNAs were digested with Ribonuclease A (Sigma, St. Louis, MO). An additional proteinase K digestion and protein precipitation, followed by DNA precipitation with 100% isopropanol, were performed. DNA was resuspended and stored in ddH2O at −80º C until use. For bisulfite conversion, 2 μg of sample liver DNAs, along with control methylated and unmethylated human DNA (Zymo Research, Orange, CA) were treated with the EZ DNA Methylation-Gold Kit (Zymo Research).
2.3 Methylation-specific Polymerase Chain Reaction (MSP)
Methylated and unmethylated primer sequences for P16(INK4a), SOCS-1, RASSF1A, APC, GSTP1, RIZ1 and MGMT genes are shown in Supplemental Table 1 [refs. 14–18,31]. Four-hundred ng of bisulfite-converted DNA (10 μL), 50 pmol forward and reverse primers (5 μL each, Nucleic Acids Core Facility, UNC-Chapel Hill), 5 μL ddH2O, and 25 μL 2X Amplitaq Gold PCR Master Mix (Applied Biosystems, Foster City, CA), for a final reaction volume of 50 μL, were subjected to MSP under the following conditions: 95ºC for 10 min., 35 cycles of 45 s at 95ºC, 60 s at the annealing temperature specific for each primer set, 60 s at 72ºC, and a final 10 min. extension at 72ºC. Each sample was PCR-amplified using both methylation-specific and unmethylation-specific primers. The final PCR products were vacuum-concentrated to 20 μL and run on a 1.75% agarose gel. Ethidium bromide stain was used for DNA visualization and Kodak 1D Image Analysis Software (Sigma, St. Louis, MO) was used for image processing. The presence of a band at the expected fragment length was scored as positive for methylation; absence was scored as negative (see Supplemental Figure 1A for an example).
2.4 Combined bisulfite restriction analysis (COBRA) of LINE-1
The levels of global DNA methylation was assessed by COBRA of long interspersed nuclear elements (LINEs) as previously described by Yang et al. [32]. Briefly, a 413 bp region of LINE-1 was amplified by PCR. The PCR product was aliquoted into two samples; half was digested with HinFI restriction endonuclease (New England Biolabs, Ipswich, MA) and half was left undigested. Each treatment was run in tandem on a 1.75% agarose gel and visualized as detailed above. Because HinFI will only digest repetitive elements that were originally methylated, a higher ratio of 413 bp band intensities between the digested and undigested treatments indicates more globally hypomethylated genomic DNA in a tissue sample (see Supplemental Figure 1B for an example). Agarose gels were photographed using AlphaDigiDoc Pro System (Alpha Innotech, San Leandro, CA). The signal intensity of undigested and digested LINE-1 PCR fragments from agarose gel images were quantified using ImageQuant 5.1 Software (Molecular Dynamics, Sunnyvale, CA) and ratio of the signal intensity of digested to undigested DNA fragments were used to determined level of methylation.
2.5 Gene expression data
As part of a companion study [29], gene expression data from microarrays were available for most of the tumorous (41/43) and non-tumorous (43/45) samples. Raw microarray data was archived in Gene Expression Omnibus (GSE17856) and is available to the public. Levels of mRNA were compared to methylation status of the seven genes investigated and analyses were performed to determine the relationships between gene expression and time to recurrence and clinicopathologic variables. Gene expression data was further used to guide the search of new candidate genes that were potentially regulated by promoter hypermethylation.
2.6 Statistical Analyses
Most of the statistical tests were performed separately within sub-groups consisting of the tumorous and non-tumorous samples. McNemar’s, chi-square, Fisher’s exact tests and both paired and unpaired Student’s t-test were used to compare methylation frequencies between tumorous and non-tumorous samples, to determine associations between the methylation status of each gene and clinicopathological variables, to examine differences in gene expression according to methylation status, and to compare LINE-1 methylation levels between samples. Univariate and multivariate Cox proportional hazards models were used to investigate relationships between promoter methylation status, gene expression, and clinicopathological data with time to recurrence with JMP software (version 6, SAS Institute Inc., Cary, NC). Kaplan-Meier recurrence-free survival curves were generated and Mantel-Cox log-rank tests were performed to assess the association between time to recurrence and gene-specific status or global DNA methylation levels using software from GraphPad Prism (v. 5, San Diego, CA). A p-value <0.05 was considered statistically significant.
3. Results
3.1 Clinicopathological characteristics of the patient study group
In all of the statistical analyses performed in this study, the full study group (49 subjects) was divided into patients for which DNA and gene expression data from HCC samples (n=43), or non-tumorous samples (n=45) were available. There were 39 paired samples. The patients in each sub-group did not differ significantly with respect to any of the clinicopathological variables (data not shown). As a first step to consider the relationship between the typical clinicopathological variables of HCC resection patients, including demographic characteristics, tumor information, laboratory results, and the time to recurrence, univariate Cox proportional hazards analyses were performed. In both sub-groups, tumor number, tumor diameter, and tumor stage were significantly associated with an earlier recurrence (Supplemental Table 2).
3.2 Gene-specific promoter methylation analysis in tumorous and non-tumorous tissues
Aberrant promoter methylation of P16(INK4a), SOCS-1, RASSF1A, APC, GSTP1, RIZ1, and MGMT is commonly reported in epigenetic studies of HCC [14–19]. Here, we examined the methylation profile of these 7 genes, which are associated with a number of dysregulated pathways during carcinogenesis, in both tumorous and non-tumorous samples from HCV-positive HCC patients (Table 1). All of these genes were almost entirely unmethylated in the DNA from control human livers; however, the frequencies of methylation of all genes, except MGMT, were significantly higher (p<0.05, Fisher’s exact test) in tumorous samples as compared to control liver. In non-tumorous samples, the methylation frequencies of only SOCS-1 and RASSF1A were significantly higher than those in controls.
Table 1.
Frequency of promoter methylation of tumor suppressor genes in tumorous, non-tumorous, and control liver DNA and association with time to recurrence.
| Gene | Tumorous Samples (n = 43) | Non-tumorous Samples (n = 45) | No. CTL samples methylated (%) | |||||||
|---|---|---|---|---|---|---|---|---|---|---|
| No. T samples methylated (%) | Hazard Ratio | 95% CI | p-value | No. NT samples methylated (%) | Hazard Ratio | 95% CI | p-value | |||
| p16** | 34/43 (79%) | 0.88 | 0.59 – 1.40 | 0.57 | 7/45 (16%) | 0.85 | 0.50 – 1.32 | 0.50 | 0/10 (0%) | |
| SOCS-1 | 39/43 (91%) | 1.05 | 0.63 – 2.16 | 0.86 | 41/45 (91%) | 0.60 | 0.35 – 1.25 | 0.15 | 0/10 (0%) | |
| RASSF1A* | 43/43 (100%) | n/a (all methylated) | 31/45 (69%) | 0.96 | 0.68 – 1.39 | 0.82 | 0/10 (0%) | |||
| APC** | 40/43 (93%) | 0.91 | 0.49 – 2.26 | 0.79 | 9/45 (20%) | 1.41 | 0.88 – 2.14 | 0.15 | 1/10 (10%) | |
| GSTP1** | 23/43 (53%) | 0.80 | 0.56 – 1.13 | 0.20 | 2/45 (4%) | 0.74 | 0.18 – 1.61 | 0.52 | 0/10 (0%) | |
| RIZ1** | 33/42 (79%) | 0.92 | 0.62 – 1.46 | 0.71 | 4/45 (9%) | 2.29 | 1.22 – 3.83 | 0.01 | 0/10 (0%) | |
| MGMT* | 0/43 (0%) | n/a (all unmethylated) | 7/45 (16%) | 1.17 | 0.44 – 2.67 | 0.73 | 0/10 (0%) | |||
T, tumorous; NT, non-tumorous; CTL, control;
p<0.05,
p<0.001 for McNemar’s chi-Square test between paired tumorous and non-tumorous tissues. Associations with recurrence-free survival were tested using univariate Cox proportional hazard models; p-values are from Log-Rank Tests.
We applied McNemar’s version of the chi-square test to compare the methylation frequencies between the 39 pairs of tumorous and non-tumorous tissue samples. The frequencies of methylation of p16(INK4a), RASSF1A, APC, GSTP1, and RIZ1 were significantly higher in tumorous as compared to non-tumorous tissues, while the methylation frequency of MGMT showed an opposite trend, and SOCS-1 exhibited an equally high methylation frequency in both sub-groups (Table 1).
In addition to identifying differences in gene-specific frequencies of methylation between tumorous and non-tumorous tissues, we were interested in investigating the significance of the multiplicity of methylated genes in the pathogenesis of HCC. Figure 1 shows the distribution of the number of samples with multiple methylated genes in control, non-tumorous and tumorous tissues. There was a statistically significant increase in the number of methylated genes as pathology progressed from normal to neoplastic, as the average number of methylated genes (± SD) in control, non-tumorous, and tumorous samples was 0.1 (± 0.3), 2.2 (±1.0), and 4.9 (±1.0), respectively (p<0.001, unpaired t-tests).
Figure 1.
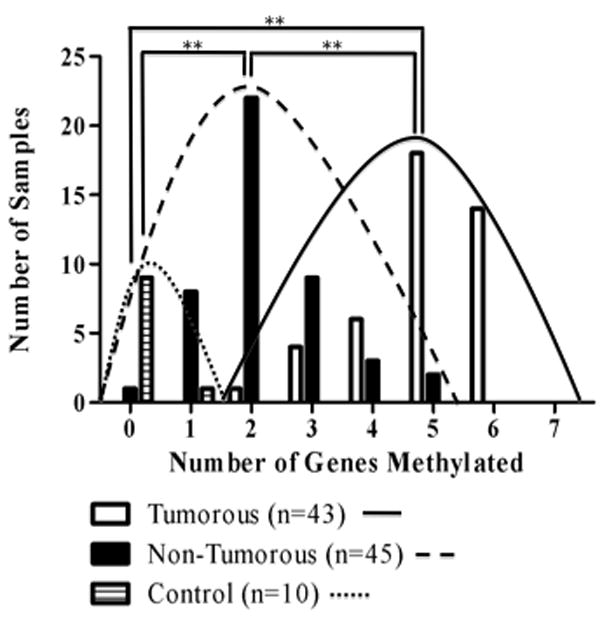
Number of tumorous, non-tumorous and control DNA samples with 0 – 7 genes methylated. Curves are drawn to distinguish the distribution of the number of genes methylated in tumorous, non-tumorous, and control tissues. The average number of genes methylated (± SD) was 4.9 (± 1.0) in tumorous tissues, 2.2 (± 1.0) in non-tumorous tissues and 0.1 (± 0.3) in control samples. ** p<0.001, 2-tailed unpaired t-test.
3.3 Analysis of methylation accordance between tumorous and non-tumorous tissues
The nonzero number of non-tumorous samples for which promoter methylation was detected in each gene examined and the significantly higher methylation frequencies of SOCS-1 and RASSF1A in non-tumorous tissues relative to control liver provide evidence for field cancerization [18,23] within the preneoplastic tissue adjacent to HCC. To further explore this concept, we determined the accordance between methylation status in tumorous and non-tumorous tissue from the same patient for each gene. To characterize a tumor as monoclonal or polyclonal in origin [33], a comparison of the methylation status between paired tumorous and non-tumorous samples was performed. There are four possible combinations of methylation status for each tissue pair: the gene is methylated in both the non-tumorous tissue and the corresponding tumorous tissue (T+/NT+), the gene is methylated in the tumorous, but not in non-tumorous tissue (T+/NT−), the gene is methylated in neither tissue (T−/NT−), or the gene is methylated in the non-tumorous, but not the tumorous tissue (T−/NT+). The first three combinations can be identified as accordant and have been suggested to be of monoclonal origin [18]. When comparing each sample pair type by each specific gene (Table 2), the majority of tissues were either T+/NT− (avg. 42%) or T+/NT+ (avg. 28%). However, at least one sample pair was discordant (that is, T−/NT+) for methylation in all genes except RASSF1A and APC, indicating that these tumors were polyclonally derived and providing support for multicentric HCC tumorigenesis, as described by others [34].
Table 2.
Methylation status in paired (n=39) tumorous and non-tumorous tissues from the same patient.
| Gene | T−/NT−(%) | T−/NT+ (%) | T+/NT−(%) | T+/NT+ (%) |
|---|---|---|---|---|
| p16 | 7 (18%) | 1 (3%) | 25 (64%) | 6 (15%) |
| SOCS-1 | 1 (3%) | 3 (8%) | 3 (8%) | 32 (82%) |
| RASSF1A | 0 (0%) | 0 (0%) | 12 (31%) | 27 (69%) |
| APC | 2 (5%) | 0 (0%) | 29 (74%) | 8 (21%) |
| GSTP1 | 17 (44%) | 1 (3%) | 20 (51%) | 1 (3%) |
| RIZ1 | 8 (21%) | 1 (3%) | 27 (69%) | 3 (8%) |
| MGMT | 33 (85%) | 6 (15%) | 0 (0%) | 0 (0%) |
| Average % | 25% | 4% | 42% | 28% |
T, tumorous; NT, non-tumorous; (−) indicates no promoter methylation and (+) indicates promoter methylation in tumorous or non-tumorous tissues
Additionally, we analyzed accordance between the methylation status in tumorous and corresponding non-tumorous tissues for all 7 genes and found that 28 (72%) of the pairs were accordant for all genes. Of the 11 pairs that were not accordant for all genes, 10 were discordant for only one gene (Supplemental Figure 2). Moreover, the 11 discordant pairs were obtained from patients who experienced an average time to recurrence that was longer than those patients harboring accordant tumorous/non-tumorous tissue pairs (29.3 months versus 20.9 months), though this relationship was not statistically significant (p=0.20, data not shown).
3.4 Association between promoter methylation status, time to recurrence, and clinicopathological variables
To investigate the association between gene methylation status and time to recurrence, we performed univariate Cox proportional hazards analyses for all genes in both the tumorous and non-tumorous sub-groups. We observed that only hypermethylation of RIZ1 in non-tumorous tissues was significantly associated with a higher risk for earlier recurrence (HR=2.29; 95% CI=1.22–3.83; p=0.01, Table 1). However, this relationship was not significant in the multivariate analysis when other significant univariate clinicopathological predictors (tumor diameter, tumor number, and tumor stage) were included (data not shown). Figure 2 shows Kaplan-Meier recurrence-free survival curves according to the methylation status of RIZ1 and P16(INK4a), a representative non-significant gene, in tumorous and non-tumorous tissues. Despite the prominent shift in the number of methylated genes as pathology progressed from control to tumorous tissue (Figure 1), univariate Cox proportional hazards analyses revealed that the number of methylated genes per tumorous sample did not dispose the patient to a higher risk for earlier recurrence (data not shown). In addition, we examined the relationship between gene methylation status and clinicopathological variables (Supplemental Table 3). Only a few significant (p<0.05) relationships were found.
Figure 2.
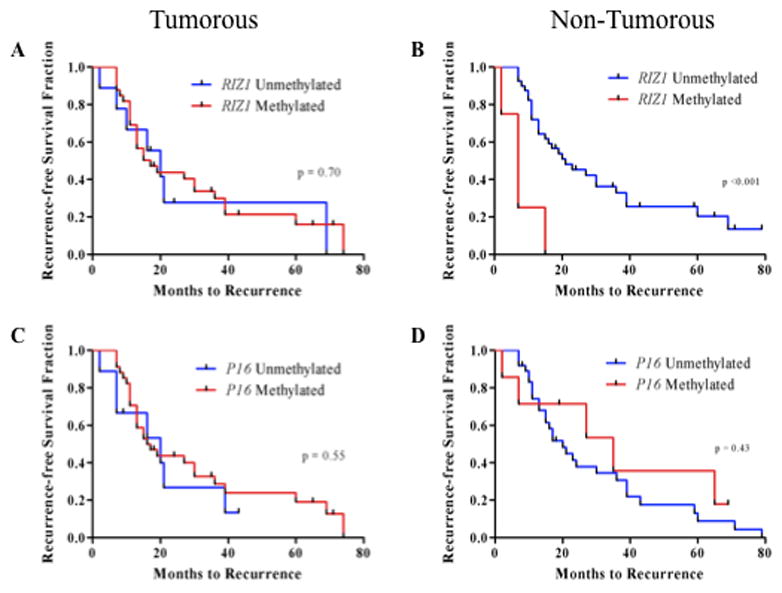
Kaplan-Meier recurrence-free survival curves based on promoter hypermethylation of tumor suppressor genes. Curves are shown for RIZ1: (A), tumorous tissues, (B) non-tumorous tissues; and p16: (C) tumorous tissues, (D) non-tumorous tissues. P-values from Log-Rank (Mantel-Cox) tests are shown for differences in time to recurrence according to methylation status.
3.5 Global DNA methylation analysis in tumorous and non-tumorous tissues
Though promoter hypermethylation of specific genes is a common epigenetic event in hepatocarcinogenesis, this specific aberration is often concurrent with global DNA hypomethylation [27]. Therefore, in addition to examining gene-specific hypermethylation, global DNA hypomethylation in tumorous and non-tumorous tissues was assessed by analyzing the level of LINE-1 methylation as a marker for global DNA methylation levels. LINE-1 was significantly (p<0.001) more hypomethylated in tumorous tissues as compared to non-tumorous tissues (Figure 3A). When patients were divided into those with an earlier recurrence (<1 year) or later recurrence (>1 year), the level of hypomethylation in the tumorous samples was significantly higher in patients with earlier recurrences. The same was true when assigning 2 years as the cutoff between early and late recurrence (Figure 3B). When patients with HCV-associated HCC were sub-divided into two groups based on the median value of LINE-1 hypomethylation in non-tumorous tissues, a nearly significant difference in time to recurrence outcome between the groups was observed; patients with higher hypomethylation experienced earlier recurrences (p=0.06, Figure 3C). The level of LINE-1 hypomethylation in tumorous tissues was also significantly inversely correlated with ALT levels (data not shown). In non-tumorous tissues, LINE-1 hypomethylation was significantly directly correlated with tumor diameter (r2 = 0.11, p = 0.03, data not shown). No other correlations with clinicopathological variables were observed (Supplemental Table 4). Univariate Cox proportional hazards analyses revealed that the level of global DNA hypomethylation in either tissue type was not significantly related to time to recurrence. There was also no association between the degree of LINE-1 hypomethylation and the methylation status of any of the 7 genes, or the number of genes methylated in either the tumorous or non-tumorous sub-group (Supplemental Table 4).
Figure 3.
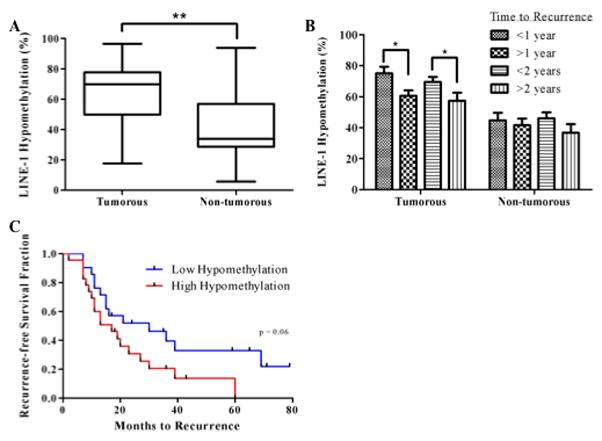
Analysis of LINE-1 hypomethylation levels in tumorous and non-tumorous tissues. (A), box plot of average LINE-1 hypomethylation level according to tissue type. Medians, interquartile ranges, minima and maxima are shown. **p<0.001, two-tailed, paired t-test. (B), Differences in LINE-1 hypomethylation levels according to early or late recurrence. Means + SEM are shown. *p<0.05, two-tailed, unpaired t-test. (C), Kaplan-Meier recurrence-free survival curve and Log-Rank (Mantel-Cox) test of time to recurrence according to high (above median) or low (below median) hypomethylation levels in non-tumorous tissues.
3.6 Variable concordance between gene expression and promoter methylation status in tumorous and non-tumorous tissues
Though the functional consequence of promoter methylation is frequently presumed to be a reduction in gene expression, this relationship is only infrequently evaluated in clinical studies. Using microarray data collected from the same tumorous and non-tumorous samples, we compared the promoter methylation status of the 7 candidate genes with their mRNA levels. There were significant differences in the expression level for 6 genes between tumorous and non-tumorous tissues (Figure 4, Supplemental Table 5). When tumorous and non-tumorous subgroups were pooled, corresponding gene expression levels were significantly lower in samples with RIZ1 methylation (p<0.01) and GSTP1 methylation (p=0.01). Interestingly, P16 expression was significantly higher in methylated versus unmethylated tissues, a relationship that was also true when analyzing only tumorous tissues. Significant concordance between lower gene expression and methylation of MGMT was also observed in the non-tumorous sub-group (Supplemental Table 5). The univariate Cox proportional hazards models analyses of the association between gene expression and time to recurrence showed that only one probe for the SOCS-1 gene was significant, and only in non-tumorous tissues (HR=8.09; 95% CI=1.11–52.5; p=0.04). For this same probe, gene expression in methylated tissues was marginally significantly lower (p=0.06) in pooled tumorous and non-tumorous tissues (Supplemental Table 5).
Figure 4.
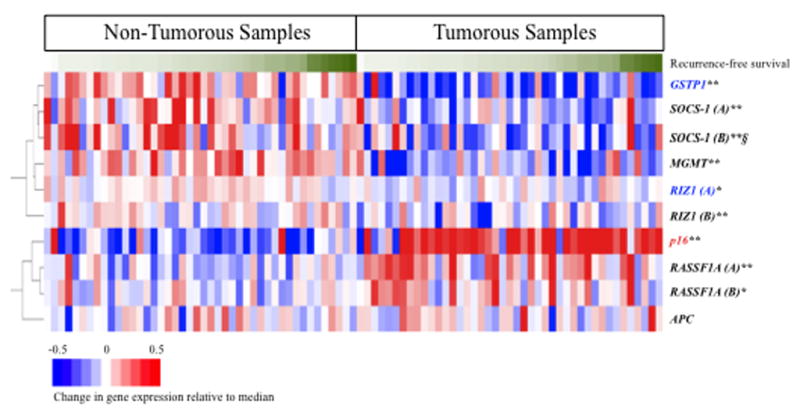
Clustering of gene expression data for seven tumor suppressor genes. Red = up-regulated; blue = down-regulated; white = no change in expression, relative to the median gene expression. Tumorous and non-tumorous samples are sorted based on time to recurrence, with longer times to recurrence appearing on the right in each sub-group, corresponding to darker green. Two different probes for the same gene are distinguished by (A) and (B). *p<0.01; **p<0.001, from two-tailed, paired t-tests for significant differences in gene expression between tumorous and non-tumorous samples.
Blue highlighting, gene expression significantly lower; and red highlighting, gene expression significantly higher in samples showing promoter methylation of the same gene when tumorous and non-tumorous samples were pooled (p<0.05, two-tailed, unpaired t-test). § Gene expression was significantly associated with risk for earlier recurrence for SOCS-1 (B) (p<0.05, Supplemental Table 5). Gene expression was lower in methylated versus unmethylated samples for SOCS-1 (B) (p=0.06).
We previously reported a strongly predictive time to recurrence signature based on the gene expression data of 91 genes in non-tumorous tissues from patients with a late (>1 year) recurrence [29]. This signature was independently prognostic in the multivariate Cox proportional hazards analysis that included both tumor diameter and the number of tumors. To examine whether differences in expression of these biomarker genes may be linked to promoter methylation, we chose the top 20 genes with the most significant Cox scores with regards to time to recurrence for methylation analysis (Supplemental Figure 3). Of these, 9 (45%) had putative CpG islands in the promoter region, and methylated DNA- and unmethylated DNA-specific primers were designed. We screened 8 paired tumorous and non-tumorous samples (4 from patients with <1 year recurrence and 4 from patients with >1 year recurrence) for CpG region methylation in these 9 genes and found them to be uniformly unmethylated in both tissue types (data not shown).
4. Discussion
Gene-specific promoter hypermethylation and global DNA hypomethylation are common epigenetic aberrations found in human liver tumors; however, answers to questions regarding the epigenetic changes specific to the underlying disease etiology remain elusive. Additionally, though the functional consequence of promoter hypermethylation is transcriptional silencing of the associated gene, this assumption often goes untested, as few have concurrently investigated both methylation and gene expression. In this study, we examined both gene-specific changes in promoter methylation and gene expression levels and global DNA methylation levels in tumorous and non-tumorous surgical margin tissues, and investigated the relationship between the epigenetic changes and both clinicopathological variables and time to recurrence. Herein, we report significant differences in both gene-specific hypermethylation and global DNA hypomethylation levels between tumorous and non-tumorous tissues and confirm the utility of RIZ1 hypermethylation in non-tumorous tissues as a predictive biomarker of earlier recurrence following tumor resection.
We examined gene-specific methylation of selected genes, including P16(INK4a), SOCS-1, RASSF1A, APC, GSTP1, RIZ1 and MGMT based on their relevance in several cancer pathways (e.g., cell cycle regulation, inhibition of the Ras pathway, xenobiotic metabolism and DNA repair) that are frequently disturbed in HCC [14–19]. Consistent with other studies, we observed higher frequencies of promoter methylation in tumorous versus non-tumorous tissues for P16(INK4a), RASSF1A, APC, GSTP1, and RIZ1. The high frequency of methylation in tumorous tissues for all genes, except MGMT, as well as the high average number of genes methylated per sample (4.9), suggest that HCV-associated HCC is characterized by concordant methylation of multiple genes, epigenetic events which might signify the emergence of the CpG island methylator phenotype, an important feature of many human neoplasms [35]. Interestingly, however, both SOCS-1 and RASSF1A genes were methylated at high frequencies in non-tumorous tissues, and MGMT was significantly more methylated in non-tumorous tissues, indicating that epigenetic aberrations in surrounding non-neoplastic tissues are important events in HCC tumorigenesis [20,36]. Indeed, all of the genes examined were methylated in at least two of the non-tumorous samples, and the average number of methylated genes in non-tumorous samples was 2.2. Similarly, other researchers have demonstrated that promoter hypermethylation is far more frequent in non-tumorous HCV-positive liver as compared to non-tumorous HCV-negative liver [20]. Thus, the aberrant gene-specific methylation profile in this etiologically distinct subclass of HCC reveals the importance of epigenetic changes in virus-associated hepatocarcinogenesis. In addition, the high methylation frequencies observed in the surgical margin of non-tumorous liver tissue suggest epigenetic evidence for field cancerization in HCC and may be related to the rapidity of HCC recurrence following resection.
A major focus of our study was to elucidate the relationship between changes in global and/or gene-specific DNA methylation and time to recurrence. The potential relevance of using methylation status as a predictor for overall or time to recurrence has been explored by several investigators, and with encouraging results. Specifically, hypermethylation of GSTP1 and P16 was previously reported as significantly associated with reduced overall survival [17,24], while MGMT hypermethylation in tumorous tissues and RIZ1 hypermethylation in non-tumorous tissues were significantly related to earlier recurrence [18]. The results of our study demonstrate that only methylation of RIZ1 in non-tumorous tissues was associated with an increased risk for earlier recurrence. This serves as an independent confirmation of the association between RIZ1 promoter hypermethylation and shorter time to recurrence and is consistent with the finding that RIZ1 promoter hypermethylation is an early event in hepatocarcinogenesis [36]. We optimistically posit that RIZ1 hypermethylation tested in biopsy specimens may serve as a pre-clinical marker of liver tumor development. We caution, however, that the number of genes examined in our study was limited and perhaps the addition of other candidate genes may yield better correlations between the number of methylated genes and time to recurrence. Importantly, varying results between this study and others demonstrate how specific epigenetic changes may be reflective of the distinct background liver disease of HCC.
Several groups have recently demonstrated that global DNA hypomethylation accompanies specific gene hypermethylation in HCC and contributes to carcinogenesis via protooncogene activation and overall genomic instability [25–27]. We also show that genomic hypomethylation, as assessed by LINE-1 methylation levels, occurs concomitantly with specific gene hypermethylation in tumorous tissues. This finding corresponds to the results of the study conducted by Kim et al. [27], demonstrating that hypermethylation of CpG islands is related to the levels of LINE-1 hypomethylation in HCC.
Despite not finding a significant association between LINE-1 hypomethylation levels and time to recurrence, we observed that the level of hypomethylation in tumorous tissues from patients with earlier recurrences was significantly higher than that in subjects with later recurrences in separate analyses that used either 1 year or 2 years as the cutoff for early versus late recurrence. LINE-1 methylation levels in non-tumorous tissues did not differ after dichotomization according to recurrence time, in agreement with the study conducted by Calvisi et al. [26]. Interestingly, however, when time to recurrence was assessed after binning non-tumorous tissues into below and above the median hypomethylation level, a high level of hypomethylation in non-tumorous tissues increased the risk for earlier recurrence with modest significance. This finding supports a role for global hypomethylation in predisposing non-neoplastic surrounding tissue to the development of secondary tumors.
Furthermore, our study combined epigenetic analyses with whole genome microarray data to investigate molecular changes during hepatocarcinogenesis. Because it is well-recognized that promoter hypermethylation may result in transcriptional repression, we aimed to characterize the relationship between methylation of specific genes and corresponding mRNA levels. We hypothesized that tissues in which gene promoters were methylated would also show decreased expression. Even though we found significant differences in gene expression between tumorous and non-tumorous tissues for all of the genes (except for APC), RIZ1 and GSTP1 were the only genes whose expression was significantly lower in methylated samples when examining both tumorous and non-tumorous samples together. Counter-intuitively, expression of P16 was actually significantly higher in samples showing P16 methylation. When analyzed separately in the tumorous sub-group, this relationship was upheld. Additionally, MGMT expression was significantly lower in methylated samples in the non-tumorous sub-group. RIZ1 hypermethylation was significantly associated with reduced time to recurrence, and RIZ1 gene expression was lower in hypermethylated samples, a relationship that has been demonstrated by others [37]. However, the univariate Cox proportional hazards analyses showed that gene expression of RIZ1 and 5 of the other genes analyzed was not associated with time to recurrence; only SOCS-1 expression in non-tumorous samples was significantly associated with earlier recurrence.
The lack of the hypothesized correlation between promoter hypermethylation and reduced gene expression in 5 of the 7 genes analyzed could be the result of examining only a limited number of CpG sites in the gene promoters. Additionally, promoter hypermethylation is only one of several epigenetic modifications affecting gene expression. Because mRNA levels are quite dynamic, it is reasonable to suggest that other compensatory processes are operating as cells attempt to reverse changes in expression due to promoter hypermethylation. In the dysfunctional biological and molecular context of cancer, there could be a myriad of mechanisms responsible for influencing gene expression, including miRNA binding, chromatin and histone modifications, and larger chromosomal aberrations, such as loss of heterozygosity. Finally, the over-sensitivity of methylation-specific PCR for detecting methylation might partially explain the absence of the expected correlation between promoter methylation status and gene expression.
To further investigate the apparent lack of a direct relationship between methylation status and gene expression, we attempted the converse approach, and selected candidates for methylation analysis based on expression profiles of genes which were related to time to recurrence. Except for GATA-4, all of the 9 genes identified with putative promoter CpG islands had not previously been reported in the literature, and thus were novel targets for methylation analyses. However, none of the genes were methylated in a subset of tumorous and non-tumorous tissues, including GATA-4, which was previously reported to be methylated in 58% of HCC cases [26]. Thus, overall, we conclude that there is a lack of agreement between promoter methylation status and gene expression in a group of HCV-positive HCC patients, and we reason that assessment of methylation status alone may not be sufficient for explaining the downstream cascade of events leading to dysregulated gene expression in HCV-associated hepatocarcinogenesis.
From a genome-wide perspective, then, it appears that gene expression signatures of time to recurrence are more difficult to characterize, because a host of other mechanisms that affect gene expression are operating, perhaps undetectably. By focusing within a smaller, more gene-specific context, however, patterns of methylation appear to be more stable and robust markers of the sequential accumulation of molecular aberrations along multistep hepatocarcinogenesis. Biomarkers such as RIZ1 hypermethylation in non-tumorous tissues may serve a more clinically useful role, as its association with earlier recurrence or as an early event in tumorigenesis is reproducible between studies, even within distinct, independent study groups [36,37].
In summary, we examined some of the epigenetic changes that sequentially accumulate during HCV-related hepatocarcinogenesis and demonstrate the technical and practical challenges of relating promoter methylation status to corresponding gene expression levels and time to recurrence. Multiple genes in multiple pathways known to be dysregulated during tumorigenesis were hypermethylated in both tumorous and non-tumorous tissues. Additionally, changes in global DNA methylation levels were more pronounced in tumorous tissues. Together, our epigenetic data establishes an aberrant methylation profile in an etiologically distinct group of HCV-positive HCC cases. The finding that RIZ1 methylation and increased levels of LINE-1 hypomethylation in non-tumorous tissues are associated with time to recurrence underscores the importance of assessing the epigenetic state of the liver remnant following tumor resection.
Novelty and impact.
This study examined changes both in promoter hypermethylation of cancer-related genes and gene expression levels in pairs of tumorous and non-tumorous tissues resected from patients with HCV-associated hepatocellular carcinoma and analyzed associations between these epigenetic changes and time to recurrence. These parallel analyses rarely appear in reports of epigenetic changes in liver tumor biology and highlight the complex relationship between epigenetic and genetic events in hepatocarcinogenesis.
Supplementary Material
Acknowledgments
Financial support for these studies was provided, in part, by grants from the National Institutes of Health: R01 AA016285 and R01 ES015241. EJF was also supported, in part, by the UNC Graduate School Competitive Merit Assistantship.
Abbreviations
- HCC
hepatocellular carcinoma
- MSP
methylation-specific PCR
- PCR
polymerase chain reaction
- P16(INK4a)
Cyclin-dependent kinase inhibitor 2A
- SOCS-1
suppressor of cytokine signaling 1
- RASSF1A
Ras association domain family 1A
- APC
adenomatous polyposis coli
- GSTP1
glutathione S-transferase π 1
- RIZ1
retinoblastoma protein-interacting zing-finger 1
- MGMT
O6-Methylguanine-DNA methyltransferase
- LINE-1
long interspersed nuclear element-1
Footnotes
6. Conflict of Interest Statement
The authors declare that there are no conflicts of interest.
Publisher's Disclaimer: This is a PDF file of an unedited manuscript that has been accepted for publication. As a service to our customers we are providing this early version of the manuscript. The manuscript will undergo copyediting, typesetting, and review of the resulting proof before it is published in its final citable form. Please note that during the production process errors may be discovered which could affect the content, and all legal disclaimers that apply to the journal pertain.
References
- 1.Gomaa AI, Khan SA, Toledano MB, Waked I, Taylor-Robinson SD. Hepatocellular carcinoma: epidemiology, risk factors and pathogenesis. World J Gastroenterol. 2008;14:4300–4308. doi: 10.3748/wjg.14.4300. [DOI] [PMC free article] [PubMed] [Google Scholar]
- 2.Thorgeirsson SS, Grisham JW. Molecular pathogenesis of human hepatocellular carcinoma. Nat Genet. 2002;31:339–346. doi: 10.1038/ng0802-339. [DOI] [PubMed] [Google Scholar]
- 3.Franceschi S, Raza SA. Epidemiology and prevention of hepatocellular carcinoma. Cancer Lett. 2009;286:5–8. doi: 10.1016/j.canlet.2008.10.046. [DOI] [PubMed] [Google Scholar]
- 4.Umemura T, Ichijo T, Yoshizawa K, Tanaka E, Kiyosawa K. Epidemiology of hepatocellular carcinoma in Japan. J Gastroenterol. 2009;44(Suppl):102–107. doi: 10.1007/s00535-008-2251-0. [DOI] [PubMed] [Google Scholar]
- 5.Horner MJ, Ries LAG, Krapcho M, Neyman N, Aminou R, Howlader N, Altekruse SF, Feuer EJ, Huang L, Mariotto A, Miller BA, Lewis DR, et al. SEER Cancer Statistics Review, 1975–2006. National Cancer Institute; 2009. [cited 2009 Oct 21]; Available from: URL: http://seer.cancer.gov/csr/1975_2006/ [Google Scholar]
- 6.Jepsen P, Vilstrup H, Tarone RE, Friis S, Sorensen HT. Incidence rates of hepatocellular carcinoma in the U.S. and Denmark: recent trends. Int J Cancer. 2007;121:1624–1626. doi: 10.1002/ijc.22860. [DOI] [PubMed] [Google Scholar]
- 7.Tung-Ping PR, Fan ST, Wong J. Risk factors, prevention, and management of postoperative recurrence after resection of hepatocellular carcinoma. Ann Surg. 2000;232:10–24. doi: 10.1097/00000658-200007000-00003. [DOI] [PMC free article] [PubMed] [Google Scholar]
- 8.Bruix J, Llovet JM. Major achievements in hepatocellular carcinoma. Lancet. 2009;373:614–616. doi: 10.1016/S0140-6736(09)60381-0. [DOI] [PubMed] [Google Scholar]
- 9.Hoshida Y, Villanueva A, Kobayashi M, Peix J, Chiang DY, Camargo A, Gupta S, Moore J, Wrobel MJ, Lerner J, Reich M, Chan JA, et al. Gene expression in fixed tissues and outcome in hepatocellular carcinoma. N Engl J Med. 2008;359:1995–2004. doi: 10.1056/NEJMoa0804525. [DOI] [PMC free article] [PubMed] [Google Scholar]
- 10.Hoshida Y, Nijman SM, Kobayashi M, Chan JA, Brunet JP, Chiang DY, Villanueva A, Newell P, Ikeda K, Hashimoto M, Watanabe G, Gabriel S, et al. Integrative transcriptome analysis reveals common molecular subclasses of human hepatocellular carcinoma. Cancer Res. 2009;69:7385–7392. doi: 10.1158/0008-5472.CAN-09-1089. [DOI] [PMC free article] [PubMed] [Google Scholar]
- 11.Esteller M, Corn PG, Baylin SB, Herman JG. A gene hypermethylation profile of human cancer. Cancer Res. 2001;61:3225–3229. [PubMed] [Google Scholar]
- 12.Das PM, Singal R. DNA methylation and cancer. J Clin Oncol. 2004;22:4632–4642. doi: 10.1200/JCO.2004.07.151. [DOI] [PubMed] [Google Scholar]
- 13.Tischoff I, Tannapfe A. DNA methylation in hepatocellular carcinoma. World J Gastroenterol. 2008;14:1741–1748. doi: 10.3748/wjg.14.1741. [DOI] [PMC free article] [PubMed] [Google Scholar]
- 14.Wong IH, Lo YM, Zhang J, Liew CT, Ng MH, Wong N, Lai PB, Lau WY, Hjelm NM, Johnson PJ. Detection of aberrant p16 methylation in the plasma and serum of liver cancer patients. Cancer Res. 1999;59:71–73. [PubMed] [Google Scholar]
- 15.Schagdarsurengin U, Wilkens L, Steinemann D, Flemming P, Kreipe HH, Pfeifer GP, Schlegelberger B, Dammann R. Frequent epigenetic inactivation of the RASSF1A gene in hepatocellular carcinoma. Oncogene. 2003;22:1866–1871. doi: 10.1038/sj.onc.1206338. [DOI] [PubMed] [Google Scholar]
- 16.Yoshikawa H, Matsubara K, Qian GS, Jackson P, Groopman JD, Manning JE, Harris CC, Herman JG. SOCS-1, a negative regulator of the JAK/STAT pathway, is silenced by methylation in human hepatocellular carcinoma and shows growth-suppression activity. Nat Genet. 2001;28:29–35. doi: 10.1038/ng0501-29. [DOI] [PubMed] [Google Scholar]
- 17.Lee S, Lee HJ, Kim JH, Lee HS, Jang JJ, Kang GH. Aberrant CpG island hypermethylation along multistep hepatocarcinogenesis. Am J Pathol. 2003;163:1371–1378. doi: 10.1016/S0002-9440(10)63495-5. [DOI] [PMC free article] [PubMed] [Google Scholar]
- 18.Lou C, Du Z, Yang B, Gao Y, Wang Y, Fang S. Aberrant DNA methylation profile of hepatocellular carcinoma and surgically resected margin. Cancer Sci. 2009;100:996–1004. doi: 10.1111/j.1349-7006.2009.01138.x. [DOI] [PMC free article] [PubMed] [Google Scholar]
- 19.Csepregi A, Rocken C, Hoffmann J, Gu P, Saliger S, Muller O, Schneider-Stock R, Kutzner N, Roessner A, Malfertheiner P, Ebert MP. APC promoter methylation and protein expression in hepatocellular carcinoma. J Cancer Res Clin Oncol. 2008;134:579–589. doi: 10.1007/s00432-007-0321-y. [DOI] [PMC free article] [PubMed] [Google Scholar]
- 20.Nishida N, Nagasaka T, Nishimura T, Ikai I, Boland CR, Goel A. Aberrant methylation of multiple tumor suppressor genes in aging liver, chronic hepatitis, and hepatocellular carcinoma. Hepatology. 2008;47:908–918. doi: 10.1002/hep.22110. [DOI] [PMC free article] [PubMed] [Google Scholar]
- 21.Gao W, Kondo Y, Shen L, Shimizu Y, Sano T, Yamao K, Natsume A, Goto Y, Ito M, Murakami H, Osada H, Zhang J, et al. Variable DNA methylation patterns associated with progression of disease in hepatocellular carcinomas. Carcinogenesis. 2008;29:1901–1910. doi: 10.1093/carcin/bgn170. [DOI] [PubMed] [Google Scholar]
- 22.Braakhuis BJ, Tabor MP, Kummer JA, Leemans CR, Brakenhoff RH. A genetic explanation of Slaughter’s concept of field cancerization: evidence and clinical implications. Cancer Res. 2003;63:1727–1730. [PubMed] [Google Scholar]
- 23.Lehmann U, Berg-Ribbe I, Wingen LU, Brakensiek K, Becker T, Klempnauer J, Schlegelberger B, Kreipe H, Flemming P. Distinct methylation patterns of benign and malignant liver tumors revealed by quantitative methylation profiling. Clin Cancer Res. 2005;11:3654–3660. doi: 10.1158/1078-0432.CCR-04-2462. [DOI] [PubMed] [Google Scholar]
- 24.Ko E, Kim Y, Kim SJ, Joh JW, Song S, Park CK, Park J, Kim DH. Promoter hypermethylation of the p16 gene is associated with poor prognosis in recurrent early-stage hepatocellular carcinoma. Cancer Epidemiol Biomarkers Prev. 2008;17:2260–2267. doi: 10.1158/1055-9965.EPI-08-0236. [DOI] [PubMed] [Google Scholar]
- 25.Lee HS, Kim BH, Cho NY, Yoo EJ, Choi M, Shin SH, Jang JJ, Suh KS, Kim YS, Kang GH. Prognostic implications of and relationship between CpG island hypermethylation and repetitive DNA hypomethylation in hepatocellular carcinoma. Clin Cancer Res. 2009;15:812–820. doi: 10.1158/1078-0432.CCR-08-0266. [DOI] [PubMed] [Google Scholar]
- 26.Calvisi DF, Ladu S, Gorden A, Farina M, Lee JS, Conner EA, Schroeder I, Factor VM, Thorgeirsson SS. Mechanistic and prognostic significance of aberrant methylation in the molecular pathogenesis of human hepatocellular carcinoma. J Clin Invest. 2007;117:2713–2722. doi: 10.1172/JCI31457. [DOI] [PMC free article] [PubMed] [Google Scholar]
- 27.Kim MJ, White-Cross JA, Shen L, Issa JP, Rashid A. Hypomethylation of long interspersed nuclear element-1 in hepatocellular carcinomas. Mod Pathol. 2009;22:442–449. doi: 10.1038/modpathol.2008.203. [DOI] [PubMed] [Google Scholar]
- 28.Tangkijvanich P, Hourpai N, Rattanatanyong P, Wisedopas N, Mahachai V, Mutirangura A. Serum LINE-1 hypomethylation as a potential prognostic marker for hepatocellular carcinoma. Clin Chim Acta. 2007;379:127–133. doi: 10.1016/j.cca.2006.12.029. [DOI] [PubMed] [Google Scholar]
- 29.Tsuchiya M, Parker JS, Kono H, Matsuda M, Fujii H, Rusyn I. Gene expression in nontumoral liver tissue and recurrence-free survival in hepatitis C virus- positive hepatocellular carcinoma. Mol Cancer. 2010;9:74. doi: 10.1186/1476-4598-9-74. [DOI] [PMC free article] [PubMed] [Google Scholar]
- 30.Nakamura J, Swenberg JA. Endogenous apurinic/apyrimidinic sites in genomic DNA of mammalian tissues. Cancer Res. 1999;59:2522–2526. [PubMed] [Google Scholar]
- 31.House MG, Guo MZ, Iacobuzio-Donahue C, Herman JG. Molecular progression of promoter methylation in intraductal papillary mucinous neoplasms (IPMN) of the pancreas. Carcinogenesis. 2003;24:193–198. doi: 10.1093/carcin/24.2.193. [DOI] [PubMed] [Google Scholar]
- 32.Yang AS, Estecio MR, Doshi K, Kondo Y, Tajara EH, Issa JP. A simple method for estimating global DNA methylation using bisulfite PCR of repetitive DNA elements. Nucleic Acids Res. 2004;32:e38. doi: 10.1093/nar/gnh032. [DOI] [PMC free article] [PubMed] [Google Scholar]
- 33.Nomoto S, Kinoshita T, Kato K, Otani S, Kasuya H, Takeda S, Kanazumi N, Sugimoto H, Nakao A. Hypermethylation of multiple genes as clonal markers in multicentric hepatocellular carcinoma. Br J Cancer. 2007;97:1260–1265. doi: 10.1038/sj.bjc.6604016. [DOI] [PMC free article] [PubMed] [Google Scholar]
- 34.Adachi E, Maeda T, Matsumata T, Shirabe K, Kinukawa N, Sugimachi K, Tsuneyoshi M. Risk factors for intrahepatic recurrence in human small hepatocellular carcinoma. Gastroenterology. 1995;108:768–775. doi: 10.1016/0016-5085(95)90450-6. [DOI] [PubMed] [Google Scholar]
- 35.Issa JP. CpG island methylator phenotype in cancer. Nat Rev Cancer. 2004;4:988–993. doi: 10.1038/nrc1507. [DOI] [PubMed] [Google Scholar]
- 36.Piao GH, Piao WH, He Y, Zhang HH, Wang GQ, Piao Z. Hyper-methylation of RIZ1 tumor suppressor gene is involved in the early tumorigenesis of hepatocellular carcinoma. Histol Histopathol. 2008;23:1171–1175. doi: 10.14670/HH-23.1171. [DOI] [PubMed] [Google Scholar]
- 37.Du Y, Carling T, Fang W, Piao Z, Sheu JC, Huang S. Hypermethylation in human cancers of the RIZ1 tumor suppressor gene, a member of a histone/protein methyltransferase superfamily. Cancer Res. 2001;61:8094–8099. [PubMed] [Google Scholar]
Associated Data
This section collects any data citations, data availability statements, or supplementary materials included in this article.