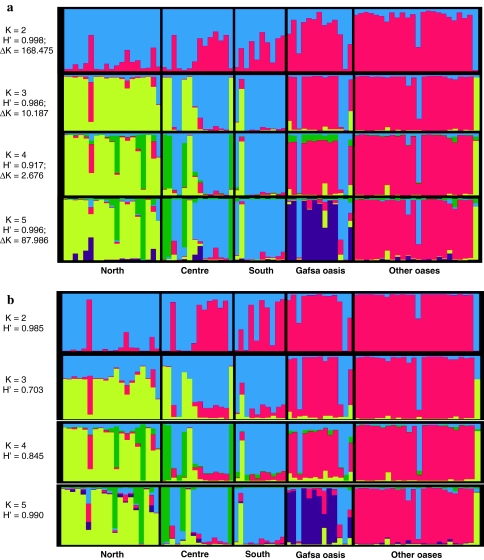
Fig. 2.
Estimated population structure. Each individual is represented by a thin vertical line, which is partitioned into K colored segments that represent the individual’s estimated membership fractions in K clusters. Black lines separate individuals of different populations on the basis of their geographic origin. Populations are labeled below the Figure. The Figure shown for a given K is based on the highest probability run at that K. a Results obtained using STRUCTURE program. For each K value, average pairwise similarity (H′) and rate of change of posterior probability of K (ΔK) were mentioned. b Results obtained using InStruct program based on the selfing rate model 3 using the adaptative independence sampler method and the uniform distribution prior. For each K value, average pairwise similarity (H′) was calculated

