Chemoembolization is a safe and effective therapy in patients with hepatocellular carcinoma.
Abstract
Purpose:
To determine comprehensive imaging and long-term survival outcome following chemoembolization for hepatocellular carcinoma (HCC).
Materials and Methods:
One hundred seventy-two patients with HCC treated with chemoembolization were studied retrospectively in an institutional review board approved protocol; this study was HIPAA compliant. Baseline laboratory and imaging characteristics were obtained. Clinical and laboratory toxicities following treatment were assessed. Imaging characteristics following chemoembolization were evaluated to determine response rates (size and necrosis) and time to progression (TTP). Survival from the time of first chemoembolization treatment was calculated. Subanalyses were performed by stratifying the population according to Child-Pugh, United Network for Organ Sharing, and Barcelona Clinic for Liver Cancer (BCLC) staging systems.
Results:
Cirrhosis was present in 157 patients (91%); portal hypertension was present in 139 patients (81%). Eleven patients (6%) had metastases at baseline. Portal vein thrombosis was present in 11 patients (6%). Fifty-five percent of patients experienced some form of toxicity following treatment; 21% developed grade 3 or 4 bilirubin toxicity. Post-chemoembolization response was seen in 31% and 64% of patients according to size and necrosis criteria, respectively. Median TTP was 7.9 months (95% confidence interval: 7.1, 9.4) but varied widely by stage. Median survival was significantly different between patients with BCLC stages A, B, and C disease (stage A, 40.0 months; B, 17.4 months; C, 6.3 months; P < .0001).
Conclusion:
The determination of TTP and survival in patients with HCC is confounded by tumor biology and background cirrhosis; chemoembolization was shown to be a safe and effective therapy in patients with HCC.
© RSNA, 2010
Introduction
Hepatocellular carcinoma (HCC) is the most common primary malignant tumor of the liver. It is the sixth most common malignancy worldwide and is the third most common cause of cancer-related mortality (1,2). Curative options are scarce; transplantation remains the standard of care for patients with limited disease as defined by the Milan criteria (3). Given the advanced stage of disease at presentation, numerous noncurative treatment modalities are routinely used, including therapies such as transarterial chemoembolization (4–7).
Although locoregional therapies continue to establish a role in the management of HCC, there remain important gaps in knowledge regarding outcomes using strictly defined objective imaging criteria. Response Evaluation Criteria in Solid Tumors guidelines describe tumor response for systemic treatments and provide minimal guidance for locoregional therapies. This is because locoregional therapies are administered at staged intervals, with different tumors being treated a variable number of times and at different time points. Hence, for locoregional therapies, the concept of assessing size and lesion necrosis continues to have an evolving role in determining response (8,9); these issues are addressed by the European Association for the Study of the Liver (EASL) and other guidelines (8,10). Also, despite the fact that response rate following systemic and locoregional therapy in HCC has been shown to predict a survival benefit, time to progression (TTP) has emerged as an important imaging endpoint that may also be used to predict survival benefit (10–13). The heterogeneity of presentation, differences in tumor natural history, and advanced stage of HCC have resulted in substantial difficulties in the design of clinical trials. Finally, the variability and lack of standardization of locoregional therapies have also made data interpretation and analyses difficult.
The purpose of this study was to determine the response rate (size and necrosis), TTP, and survival in a cohort of patients with HCC following chemoembolization.
Materials and Methods
Patient Cohort
Between January 1, 2000, and December 31, 2008, 172 patients underwent treatment with chemoembolization for HCC at a single institution. Institutional review board authorization was obtained; this study was Health Insurance Portability and Accountability Act compliant.
Pretreatment Evaluation and Staging
All patients underwent pretreatment assessment including history, physical examination, and laboratory assessment. Clinical criteria for treatment with chemoembolization included (a) imaging or pathologic diagnosis of HCC, (b) Eastern Cooperative Oncology Group performance status of 0–2, (c) bilirubin level of 3.0 mg/dL or less (≤51.3 μmol/L), (d) limited portal vein thrombosis (with hepatopedal flow), and/or (e) extrahepatic metastases (patients with cirrhosis often exhibit reactive lymphadenopathy in the periportal, cardiophrenic, or retroperitoneal lymph nodes; for this analysis, lymph nodes larger than 2.0 cm in these locations were also classified as extrahepatic metastases) (14). Cirrhosis was defined as the presence of any of the following: nodular liver surface at imaging, portal hypertension, or evidence of cirrhosis at pathologic evaluation of the biopsy specimen. Portal hypertension was defined as the presence of either (a) splenomegaly with thrombocytopenia (platelets < 100000/μL) or (b) portosystemic shunts (patent umbilical veins, coronary/gastroesophageal varices, splenorenal shunts) (15). Biopsy was performed to confirm HCC if the lesion was larger than 2 cm but did not meet standard imaging criteria (7,8,16,17) or if the maximum dimension of the lesion was 1–2 cm (17). Tumor burden was defined by means of subjective assessment as the percentage of the total liver volume that was involved by the tumor. Baseline diagnostic imaging was performed by using contrast material–enhanced magnetic resonance (MR) imaging or triphasic computed tomography (CT). Patients were staged by using the Child-Pugh, United Network for Organ Sharing (UNOS), Okuda, Barcelona Clinic Liver Cancer (BCLC), and Cancer of the Liver Italian Program classifications (16,18,19).
Treatment
Treatment with chemoembolization was consensus-based by a multidisciplinary team in HCC conference at our institution. On the day of treatment, patients underwent angiography to determine vascular anatomy and variants and to assess portal flow (20). Chemotherapeutic agents (30 mg doxorubicin, 100 mg cisplatin, and 30 mg mitomycin) mixed with 10 mL lipiodol were injected at the branch or segmental arterial level, followed by injection of 300–500 μm permanent embolic particles (Embospheres; BioSphere Medical, Rockland, Mass) (21–23). Patients were subsequently admitted for the management of potential postembolization syndrome. Additional chemoembolization sessions were performed if (a) the first treatment was thought to incompletely treat the lesion (or lesions) on cross-sectional images (represented by viable tumor), (b) the multifocality of disease did not allow complete targeting of tumor in one treatment session, or (c) alternate blood supply from parasitized hepatic arteries were identified at initial diagnostic angiography.
Response Evaluation
Patients underwent imaging (triphasic CT or contrast-enhanced MR imaging) 1 month after treatment to assess response in the treated lesions and subsequently underwent imaging every 2–3 months (8). Five radiologists who were well-versed in the radiographic changes that follow locoregional therapies performed baseline and response assessments (R.J.L., R.K.R., F.H.M., K.T.S., and R.S.). Given the scope of this analysis and time constraints, only one reader per patient was assigned. During imaging assessment, response was assessed according to World Health Organization (WHO) and EASL criteria, and a search was performed for the appearance of new lesions or extrahepatic metastases. All scans obtained from baseline to last follow-up, transplantation, or death were evaluated. Target lesions were identified and measured; untreated lesions were not included in the response analysis. Target lesions were defined as follows: In patients with solitary HCC lesions, the one lesion was used for assessment of response; in patients with multifocal disease, since chemoembolization treatments are performed as staged procedures at our institution, we used the largest tumor treated during the first session to follow for response assessment (40).
WHO criteria.—WHO criteria recommend using the product of the tumor’s maximum dimension with its perpendicular dimension for measurement. Response of the target lesions were assessed with WHO criteria by using the following definitions: complete response was defined as 100% decrease in sum of products; partial response, 50% or more decrease in sum of products of the target lesions; and progressive disease, greater than 25% increase in the sum of the products from maximum response or new intra- or extrahepatic lesions. All others findings were defined as stable disease (8,24). Of importance, when assessing response according to WHO criteria, the entire lesion was always measured, rather than only the enhancing portion, as has been reported by other investigators (25).
EASL criteria.—Enhancement characteristics and degree of necrosis in the treated lesions were studied (26). EASL response in treated lesions are based on the following: complete response was defined as absence of any enhancing tissue; partial response, greater than 50% decrease in enhancing tissue; and stable disease, less than 50% decrease in enhancing tissue (8,13). Progressive disease was defined as any increase in the amount of enhancing tissue that clinically would translate into additional locoregional therapy (ie, repeat chemoembolization).
α-Fetoprotein.—Among patients with available α-fetoprotein (AFP) findings, an exploratory analysis was performed in patients with baseline AFP level greater than 200 ng/mL and greater than 400 ng/mL to facilitate comparison of our data with data from those centers using these values as their cut-off levels for HCC diagnosis (27). The posttreatment AFP levels were compared with the baseline (greater than 50% reduction, greater than 90% reduction, complete normalization) (28).
Progression Analysis
For purposes of calculating TTP, an endpoint was defined as progression according to any of the following modes: WHO, EASL, or UNOS stage, portal vein thrombus extension, or appearance of new lesion. Despite the fact that patients underwent pretreatment scanning, the starting point for all variables was the date of first chemoembolization session. Patients without imaging follow-up available were censored as “nonprogressors” on the day of first treatment. A patient undergoing multiple treatments to the same lesion to completely devascularize the lesion, or one needing two separate embolization sessions to completely cover the tumor bed because of alternate blood supply, was considered to have undergone one cycle. All patients were permitted to undergo one treatment cycle to the target lesion(s), after which any imaging findings that fulfilled any of the above criteria for progressive disease (and potentially necessitated additional chemoembolization treatment) was counted as progression. Per guidelines, the development of a new lesion was confirmed in retrospect as progression at the time it was first detected, even if definitive imaging criteria for new HCC were met at subsequent imaging (10).
Toxicity
All patients were followed up clinically for toxicities and adverse events according to the National Cancer Institute’s Common Terminology Criteria for Adverse Events v3.0 (29). Toxicities were recorded at any time during follow-up and were only censored to curative treatment (ie, transplantation or resection). Toxicity was recorded only if the grade increased from baseline.
Statistical Analyses and Survival
Prior to final statistical analysis, preliminary data were analyzed by using univariate and graphical methods, wherever applicable, to facilitate inspection and interpretation of the data. Outliers and influential observations were identified and checked for accuracy. Data error due to data entry oversight was appropriately corrected. All data were summarized by using appropriate descriptive statistics (eg, mean and standard deviation for continuous variables, count and frequency for categorical variables). Kaplan-Meier analysis was used to evaluate patient survival. Median time to response, TTP, and survival were calculated and compared by using the log-rank test (30). For the purposes of survival calculations, death was defined as an endpoint; patients were censored at the date of last follow-up or date of resection or transplantation (if applicable). Median follow-up time was determined by using the reverse Kaplan-Meier method (31).
Hazard ratios were calculated by using univariate and multivariate Cox proportional hazards regression models. Independent variables entered into the multivariate model predicting patient survival included age, sex, ethnicity, cirrhosis, portal hypertension, Eastern Cooperative Oncology Group performance status, UNOS stage, WHO response, EASL response, and baseline AFP levels. Portal vein thrombosis, metastases, tumor distribution, and maximum baseline tumor dimension were not included into the multivariate model because they were captured by means of UNOS stage. Bilirubin and ascites were not included in the multivariate model because they were captured by Child-Pugh class. These variables were excluded to eliminate multi-colinearity in the multivariate regression model. Throughout the report, confidence interval estimation was performed by using the Wald method and statistical significance was established at an α level of .05. All statistical analyses were performed by using statistical software (SAS version 9.2; SAS Institute, Cary, NC).
Results
Patient Sample
Tables 1 and 2 display baseline data for the 172-patient cohort. Median age was 60 years (range, 33–89 years); 140 patients (81%) were male. Hepatitis C (85 patients [49%]) and alcohol (29 patients [17%]) were the most common contributing factors for cirrhosis. The majority of patients had a performance status of 0 (90 patients [52%]) and had not undergone prior treatment (155 patients [90%]). In 71 patients (41%), HCC was confirmed at biopsy. Most patients had cirrhosis (157 patients [91%]) and portal hypertension (139 patients [81%]). Seventy-four patients (43%) had solitary HCC with a tumor burden of less than 25% [159 patients (92%)] and no vascular invasion (161 patients [94%]). Eleven (6%) had extrahepatic metastases (nine patients had enlarged lymph nodes, one had lung nodules, and one had peritoneal metastases). The mean size of the largest tumor was 5.4 cm. In most patients, bilirubin level was less than 2.0 mg/dL. There were 96 patients (56%) with Child-Pugh class A, 135 (78%) with BCLC A or B, 61 (35%) with UNOS T2, and 43 (25%) with UNOS T3 disease.
Table 1.
Baseline Demographics in Patients with HCC
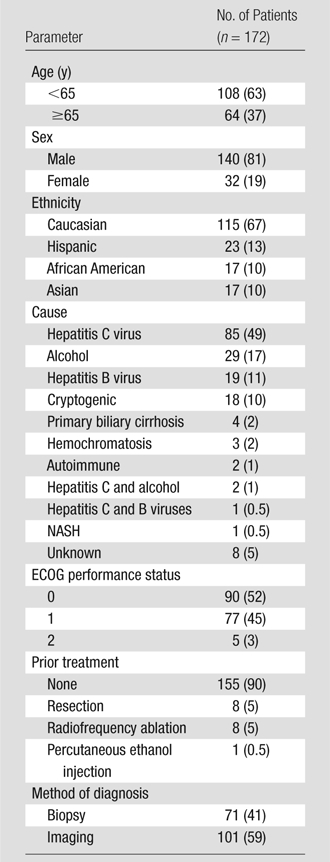
Note.—Data in parentheses are percentages. ECOG = Eastern Cooperative Oncology Group, NASH = nonalcoholic steatohepatitis.
Table 2.
Baseline Characteristics and Disease Stages in Patients with HCC

Note.—Data in parentheses are percentages.
Indicates percent of liver involved by tumor.
Data in brackets are the mean tumor size and range, respectively, in centimeters.
Treatment and Follow-up
The median number of treatments was one per patient (interquartile range, 1–2; range, 1–5) for the entire cohort; the median number of treatments in patients who did not undergo transplantation was two per patient (interquartile range, 1–2; range, 1–5). The median length of hospitalization was 2 days (interquartile range, 1–2 days; range, 1–11 days). No patient received sorafenib (Nexavar; Bayer, Berlin, Germany) or other transarterial locoregional therapy. Nine patients underwent radiofrequency ablation in small, de novo HCCs at progression.
Clinical and Laboratory Toxicities
Table 3 lists the clinical and laboratory toxicities. The most common findings after treatment included fatigue (62 patients [36%]), pain (57 patients [33%]), and nausea/vomiting (43 patients [25%]). Grade 3–4 bilirubin toxicities were also noted (36 patients [21%]).
Table 3.
Clinical and Laboratory Toxicities
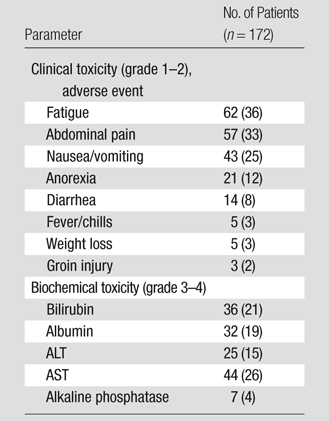
Note.—Data in parentheses are percentages. ALT = alanine aminotransferase, AST = aspartate aminotransferase.
Imaging Outcomes
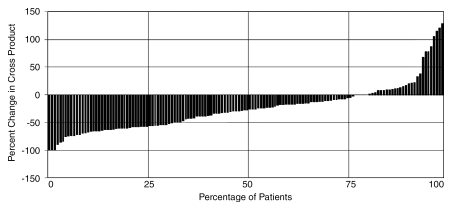
Response rate.—Of 172 patients, 143 (83%) underwent imaging follow-up; 29 patients (17%) had no imaging follow-up (early transplantation, n = 18; death within 3 months, n = 2; no posttreatment imaging follow-up available, n = 9). Overall, 568 scans were reviewed, for a mean of 2.8 follow-up scans per patient. Table 4 lists response and TTP analyses stratified by stage. Figure 1 is a waterfall plot demonstrating percent change in tumor size following treatment (from baseline). Although a WHO partial response rate of 31% (44 of 143) was seen in this analysis, 77% (110 of 143) of lesions showed decrease in size following treatment. According to EASL, the response rate was 64% (91 of 143) (complete response, 23%; partial response, 41%). The median time to partial response in responders was 4 months (95% confidence interval: 2.8, 5.8 months) by WHO criteria and 1.3 months (95% confidence interval: 1.2, 1.8 months) by EASL criteria. Response rates were similar between patients with Child-Pugh class A (WHO: 26 of 80 [33%]; EASL: 47 of 80 [59%]) and class B (WHO: 19 of 61 [31%]; EASL: 43 of 61 [70%]) disease. WHO partial response rate by tumor size was as follows: smaller than 5 cm, 32 of 90 (36%); 5–10 cm, nine of 33 (27%); and larger than 10 cm, four of 20 (20%). EASL partial response rate by tumor size was as follows: smaller than 5 cm, 66 of 90 (73%); 5–10 cm, 14 of 33 (42%); and larger than 10 cm, 11 of 20 (55%).
Table 4.
Imaging and Survival Analyses
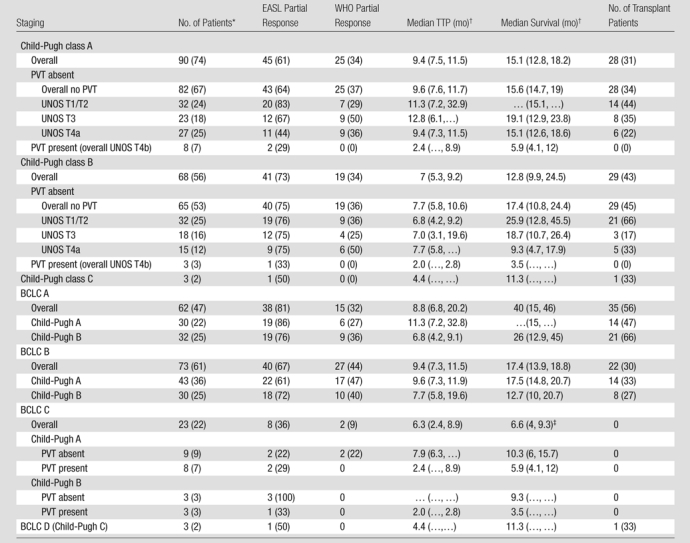
Note.—Except where indicated, data are numbers of patients, and data in parentheses are percentages. Table includes 132 patients without extrahepatic metastases for imaging (WHO partial response, EASL partial response) and 161 patients for survival and TTP analyses (patients without imaging follow-up were censored as nonprogressors at the time of first treatment). PVT = portal vein thrombosis.
Data in parentheses are numbers of patients with imaging follow-up.
Data in parentheses are 95% confidence intervals.
One patient underwent resection.
Figure 1:
Waterfall plot demonstrates post-chemoembolization change in tumor size.
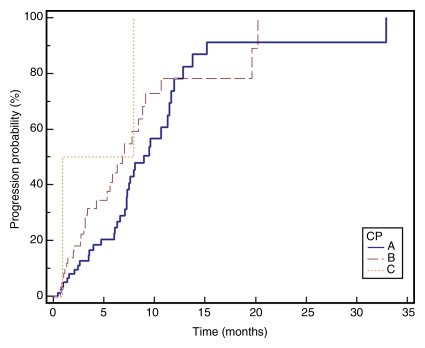
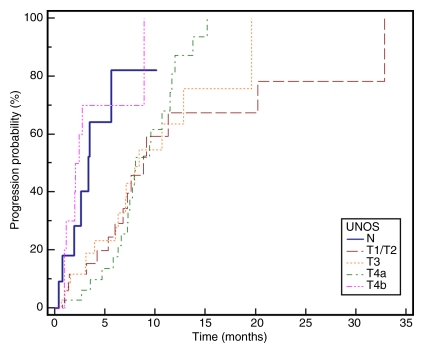
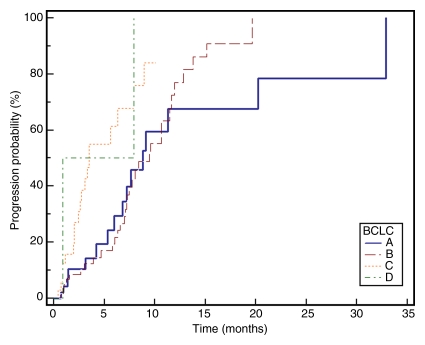
Median TTP.—TTP for the entire cohort (n = 143) was 7.9 months (95% confidence interval: 7.1, 9.4 months); 75% of patients were progression-free at 16 weeks. Figure 2 displays TTP in Kaplan-Meier format.
Figure 2a:
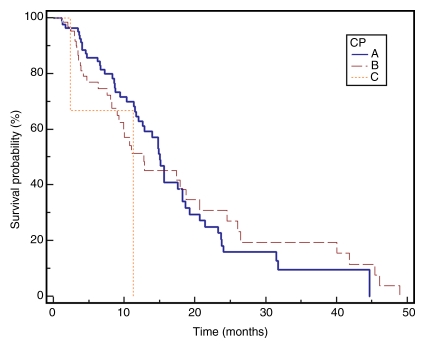
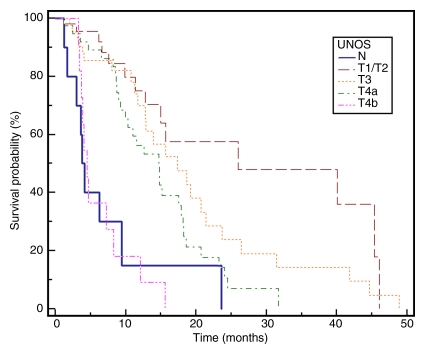
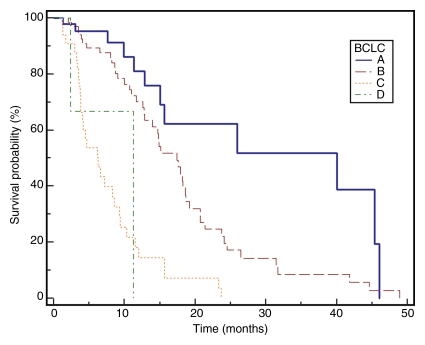
Kaplan-Meier curves demonstrate (a) TTP substratified by Child-Pugh class (CP) (P = .1351), (b) survival substratified by Child-Pugh class (P = .2927), (c) TTP substratified by UNOS stage (P = .0001), (d) survival substratified by UNOS stage (P < .0001). Kaplan-Meier curves show (e) TTP substratified by BCLC stage (P = .0009), and (f) survival substratified by BCLC stage (P < .0001).
Figure 2b:
Kaplan-Meier curves demonstrate (a) TTP substratified by Child-Pugh class (CP) (P = .1351), (b) survival substratified by Child-Pugh class (P = .2927), (c) TTP substratified by UNOS stage (P = .0001), (d) survival substratified by UNOS stage (P < .0001). Kaplan-Meier curves show (e) TTP substratified by BCLC stage (P = .0009), and (f) survival substratified by BCLC stage (P < .0001).
Figure 2c:
Kaplan-Meier curves demonstrate (a) TTP substratified by Child-Pugh class (CP) (P = .1351), (b) survival substratified by Child-Pugh class (P = .2927), (c) TTP substratified by UNOS stage (P = .0001), (d) survival substratified by UNOS stage (P < .0001). Kaplan-Meier curves show (e) TTP substratified by BCLC stage (P = .0009), and (f) survival substratified by BCLC stage (P < .0001).
Figure 2d:
Kaplan-Meier curves demonstrate (a) TTP substratified by Child-Pugh class (CP) (P = .1351), (b) survival substratified by Child-Pugh class (P = .2927), (c) TTP substratified by UNOS stage (P = .0001), (d) survival substratified by UNOS stage (P < .0001). Kaplan-Meier curves show (e) TTP substratified by BCLC stage (P = .0009), and (f) survival substratified by BCLC stage (P < .0001).
Figure 2e:
Kaplan-Meier curves demonstrate (a) TTP substratified by Child-Pugh class (CP) (P = .1351), (b) survival substratified by Child-Pugh class (P = .2927), (c) TTP substratified by UNOS stage (P = .0001), (d) survival substratified by UNOS stage (P < .0001). Kaplan-Meier curves show (e) TTP substratified by BCLC stage (P = .0009), and (f) survival substratified by BCLC stage (P < .0001).
Figure 2f:
Kaplan-Meier curves demonstrate (a) TTP substratified by Child-Pugh class (CP) (P = .1351), (b) survival substratified by Child-Pugh class (P = .2927), (c) TTP substratified by UNOS stage (P = .0001), (d) survival substratified by UNOS stage (P < .0001). Kaplan-Meier curves show (e) TTP substratified by BCLC stage (P = .0009), and (f) survival substratified by BCLC stage (P < .0001).
AFP level.—Baseline AFP level greater than 200 ng/mL was observed in 60 patients (35%). Follow-up AFP levels were available in 52 of these patients and showed the following responses: a greater than 50% reduction in AFP in 26 patients (50%), a greater than 90% reduction in 16 patients (31%), and complete normalization in three patients (6%). Baseline AFP level greater than 400 ng/mL was observed in 50 (29%) of 172 patients. In 42 of these 50 patients, follow-up AFP findings were available and showed the following responses: greater than 50% reduction in AFP in 21 patients (50%), greater than 90% reduction in 15 patients (36%), and complete normalization in three patients (7%).
Survival Analyses
No patient was lost to follow-up for the survival analyses. At the time of study closure, 112 patients had died (55 [49%] with disease progression, 48 [43%] with stable disease and grade ≥1 bilirubin toxicity, and nine [8%] with stable disease and no bilirubin toxicities). To mitigate the effect of extrahepatic metastases, Table 4 reports survival for the 161 patients who were free of metastases at baseline. The median follow-up period was 38.9 months (95% confidence interval: 31.9, 51.9 months). Sixty-one patients underwent curative transplantation (n = 59) or resection (n = 2); survival is reported censored to the date of transplantation. Survival of patients with Child-Pugh class A and Child-Pugh class B BCLC B disease was 17.5 and 12.7 months, respectively (P = .62). Median survival was significantly different between patients with BCLC A, B, and C disease (stage A, 40.0 months; B, 17.4 months; C, 6.6 months; P = .001). The median survival of patients with (n = 11) and those without (n = 161) metastases was 4.2 months (95% confidence interval: 15.6, 24.2 months) and 18.6 months (95% confidence interval: 2.9, 9.4 months) (P < .0001), respectively. Figure 2 displays survival as Kaplan-Meier curves.
Univariate and Multivariate Analyses
Table 5 presents the hazard ratios by category of various predictors of survival in HCC. Significant prognosticators of survival on univariate and multivariate analysis included UNOS stage, baseline AFP levels, and WHO response. Presence of extrahepatic metastases (P = .0005) and/or vascular invasion (P = .0002) was seen to be associated with significantly worse survival. Baseline AFP levels of 200 ng/mL or less (P = .0015) and observation of WHO response after treatment (P = .0015) were associated with improved survival.
Table 5.
Univariate and Multivariate Analyses
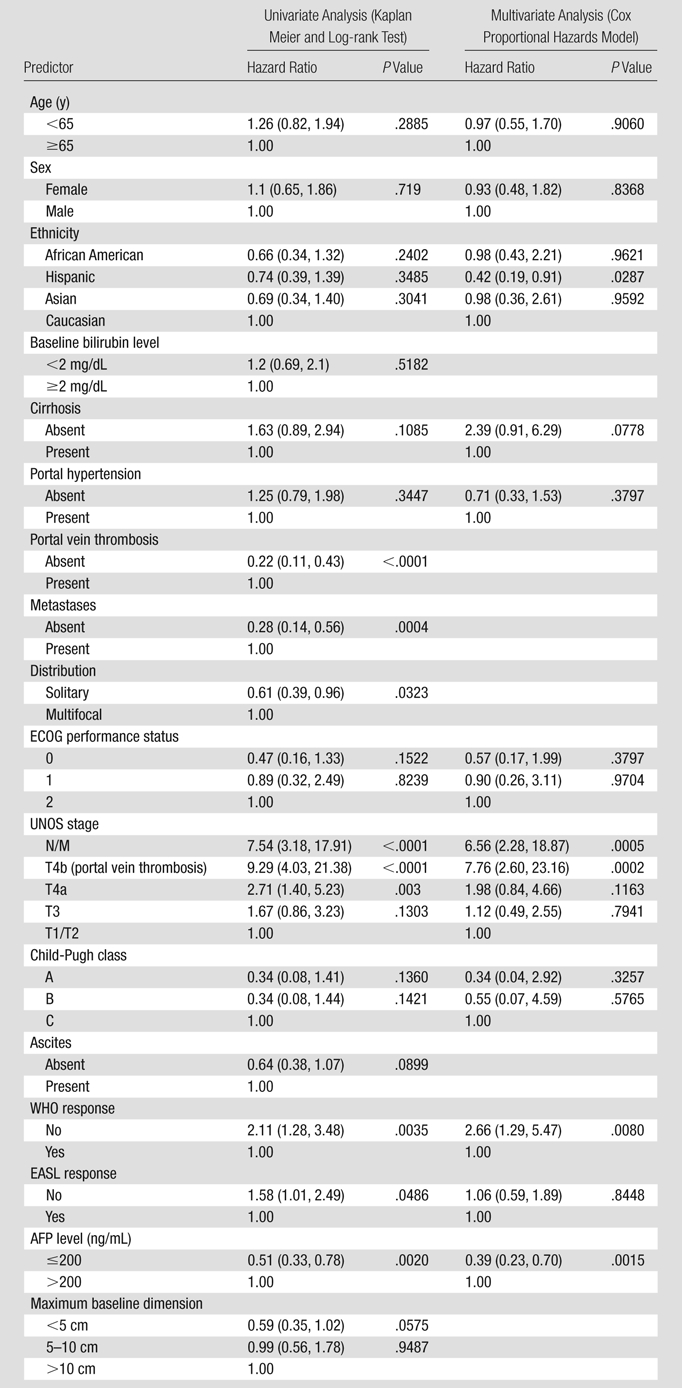
Note.—Data in parentheses are 95% confidence intervals. Portal vein thrombosis, metastases, distribution, and dimension were not included in the multivariate model because they are captured by UNOS stage. Bilirubin level and ascites were not included in the multivariate model because they are captured by Child-Pugh score. ECOG = Eastern Cooperative Oncology Group.
Discussion
Chemoembolization as a treatment option for HCC has been used for decades. Since then, outcomes have been improved by advances in interventional techniques and refinement in patient selection. In fact, chemoembolization was established as the standard of care for intermediate-stage HCC in 2002 when randomized studies in selected patients with Child-Pugh class A disease demonstrated a survival benefit (32,33). Chemoembolization is now recognized as the standard of care for intermediate-stage HCC (7,8).
The incidence of HCC is increasing worldwide (34). Progress has been made in the past decade in the management of HCC with surgical, systemic, and locoregional treatments. Effective locoregional treatment modalities for HCC necessitate the ability to accurately assess response by using imaging and to compare with systemic agents. Our study included a large cohort of HCC patients treated at a single institution with chemoembolization, where comprehensive imaging follow-up and investigator-assessed response permitted the exploratory analysis of TTP analyses using strict objective imaging criteria. Such imaging outcomes following chemoembolization obtained in a systematic manner that includes EASL guidelines have not been thoroughly reported.
In our study, the safety of chemoembolization was found to be similar to that in recent reports. Georgiades et al (35) described a 22% incidence of grade 3 bilirubin toxicities at 1-year follow-up, which is in line with our findings of 21% grade 3–4 hyperbilirubinemia. The incidence of postembolization syndrome was also in keeping with that in previous reports; 55% of our patients experienced symptoms attributable to chemoembolization (36).
Although response rate has traditionally been used as an endpoint in phase 2 studies prior to advancing to phase 3, this concept is being challenged with the advent of molecular targeted therapies (37,38). Clinically relevant survival advantages have been seen with therapies that produce marginal response (10,11,13). The most powerful evidence supporting TTP as a surrogate for survival was published in a phase 3 trial in advanced HCC in which patients were to receive either sorafenib or placebo; median TTP was 5.5 months in the sorafenib group and 2.8 months in the placebo group (P < .001). Response rate was 2% for sorafenib and 1% for placebo. Despite the lack of response, a survival benefit was identified, suggesting that improvements in survival may be obtained with cytostatic agents (10). Although this finding challenges the role of using imaging to assess response for targeted agents, there are no conclusive data to extend this concept to locoregional therapies such as transarterial chemoembolization. A consensus panel did agree on avascularity and necrosis as components of response in capturing antitumor effects of therapies such as chemoembolization (8). This suggests that in single-arm studies (without comparators), tumor response will continue to be integral to the identification of antitumor effect.
We analyzed various outcomes (such as TTP) as a function of (a) Child-Pugh class substratified by tumor stage (UNOS stage/portal vein thrombosis) and (b) BCLC stage. As outcomes are based on different staging schemes, the creation of such tables for other forms of systemic and locoregional therapies would allow direct comparisons of these treatment options. These data may also assist in designing clinical trials for chemoembolization. Our median TTP with chemoembolization was 7.9 months, and the progression-free rate at 16 weeks was 75%. Recent single-arm studies have reported a median TTP of 4.2 months and median survival of 9.2 months in patients with treatment-naïve inoperable HCC treated with sorafenib (38) and a progression-free survival at 16 weeks of 62.5% for patients treated with bevacizumab and erlotinib (39).
The data from this cohort showed minimal differences in survival between patients with Child-Pugh classes A and B disease without UNOS substratification. This may be due to the fact that patients with Child-Pugh A disease had a higher rate of advanced HCC (T4a+T4b) in our population when compared with patients with Child-Pugh B disease (39% vs 26%). This finding stresses the importance of using staging systems that combine liver function, vascular invasion, and tumor burden when comparing outcomes (10). The differences in outcomes become more evident when using the BCLC staging system.
In the multivariate analyses, presence of extrahepatic metastases and/or vascular invasion was seen to be associated with significantly worse survival; baseline AFP levels of 200 ng/mL or lower and observation of WHO response after treatment were associated with improved survival. EASL response was not found to be a significant prognostic factor. This may be due to the arterial occlusive effect of transarterial chemoembolization; decreased contrast agent delivery to the tumors (which leads to falsely classifying a tumor as showing response) and embolization of tumor vascularity may result in the development of new parasitized collateral vessels that would result in locally recurrent disease.
There are limitations to this analysis. Nontarget lesions that were not treated during the first treatment session were not included in the response analysis at the lesion level; however, appearance of new lesions was incorporated in TTP analyses. Because of time and funding limitations, only one reader was assigned per patient. Although there are variations in chemoembolization technique, this bias is minimized by the single-center experience, providing an internal standard. Progression according to EASL enhancement was recorded when any enhancement that led to re-treatment was noted rather than waiting for 30% increase as recommended (10). The confidence intervals of time-to-endpoint analyses using Kaplan-Meier techniques (TTP and survival) are dependent on the number of endpoints reached. Due to the low number of endpoints reached in the substratification analyses, the confidence intervals are correspondingly wide.
There is a need for prospective studies that assess the long-term effects of chemoembolization as well as a need to initiate combination or head-to-head studies that include targeted molecules. Guidance on the design and appropriate endpoints of such studies has been recently described (10). Novel imaging tools such as diffusion-weighted MR imaging and other functional instruments may become integral to such research and appear to be addressed by intergroup studies. The imaging outcomes reported herein are meant to be hypothesis-generating as future clinical trials are explored. A cooperative group study of chemoembolization with and without sorafenib is underway.
Chemoembolization is a safe and effective therapy for patients with HCC. We recommend using staging systems that combine liver function, vascular invasion, and tumor burden when comparing outcomes for HCC.
Advances in Knowledge.
Median time to progression (TTP) was 7.9 months.
Patients with Barcelona Clinic for Liver Cancer (BCLC) stage C disease had significantly lower TTP compared with patients with BCLC stages A and B (A, 8.8 months; B, 9.4 months; C, 3.5 months; P = .0005).
Median survival of all patients with BCLC stages A, B, and C disease was significantly different: A, 40.0 months; B, 17.4 months; C, 6.3 months.
Implication for Patient Care.
TTP in patients treated with chemoembolization for hepatocellular carcinoma appears to be comparable to that in patients treated with biologic agents (eg, sorafenib), without the associated systemic toxicities.
Received August 13, 2009; revision requested October 12; revision received October 28; accepted November 9; final version accepted November 23.
This research was supported by the National Institutes of Health (grant R01 CA126809).
Authors stated no financial relationship to disclose.
Abbreviations:
- AFP
- α-fetoprotein
- BCLC
- Barcelona Clinic for Liver Cancer
- EASL
- European Association for the Study of the Liver
- HCC
- hepatocellular carcinoma
- TTP
- time to progression
- UNOS
- United Network for Organ Sharing
- WHO
- World Health Organization
References
- 1.Parkin DM, Bray F, Ferlay J, Pisani P. Global cancer statistics, 2002. CA Cancer J Clin 2005;55(2):74–108 [DOI] [PubMed] [Google Scholar]
- 2.Bosch FX, Ribes J, Díaz M, Cléries R. Primary liver cancer: worldwide incidence and trends. Gastroenterology 2004;127(5 suppl 1):S5–S16 [DOI] [PubMed] [Google Scholar]
- 3.Mazzaferro V, Regalia E, Doci R, et al. Liver transplantation for the treatment of small hepatocellular carcinomas in patients with cirrhosis. N Engl J Med 1996;334(11):693–699 [DOI] [PubMed] [Google Scholar]
- 4.Kulik LM, Atassi B, van Holsbeeck L, et al. Yttrium-90 microspheres (TheraSphere) treatment of unresectable hepatocellular carcinoma: downstaging to resection, RFA and bridge to transplantation. J Surg Oncol 2006;94(7):572–586 [DOI] [PubMed] [Google Scholar]
- 5.Lu DS, Yu NC, Raman SS, et al. Radiofrequency ablation of hepatocellular carcinoma: treatment success as defined by histologic examination of the explanted liver. Radiology 2005;234(3):954–960 [DOI] [PubMed] [Google Scholar]
- 6.Maddala YK, Stadheim L, Andrews JC, et al. Drop-out rates of patients with hepatocellular cancer listed for liver transplantation: outcome with chemoembolization. Liver Transpl 2004;10(3):449–455 [DOI] [PubMed] [Google Scholar]
- 7.Bruix J, Sherman M. Practice Guidelines Committee, American Association for the Study of Liver Diseases Management of hepatocellular carcinoma. Hepatology 2005;42(5):1208–1236 [DOI] [PubMed] [Google Scholar]
- 8.Bruix J, Sherman M, Llovet JM, et al. Clinical management of hepatocellular carcinoma: conclusions of the Barcelona-2000 EASL conference. J Hepatol 2001;35(3):421–430 [DOI] [PubMed] [Google Scholar]
- 9.Takayasu K, Arii S, Ikai I, et al. Prospective cohort study of transarterial chemoembolization for unresectable hepatocellular carcinoma in 8510 patients. Gastroenterology 2006;131(2):461–469 [DOI] [PubMed] [Google Scholar]
- 10.Llovet JM, Di Bisceglie AM, Bruix J, et al. Design and endpoints of clinical trials in hepatocellular carcinoma. J Natl Cancer Inst 2008;100(10):698–711 [DOI] [PubMed] [Google Scholar]
- 11.Llovet JM, Bruix J. Molecular targeted therapies in hepatocellular carcinoma. Hepatology 2008;48(4):1312–1327 [DOI] [PMC free article] [PubMed] [Google Scholar]
- 12.Llovet JM, Bruix J. Novel advancements in the management of hepatocellular carcinoma in 2008. J Hepatol 2008;48(suppl 1):S20–S37 [DOI] [PubMed] [Google Scholar]
- 13.Llovet JM, Ricci S, Mazzaferro V, et al. Sorafenib in advanced hepatocellular carcinoma. N Engl J Med 2008;359(4):378–390 [DOI] [PubMed] [Google Scholar]
- 14.Katyal S, Oliver JH, 3rd, Peterson MS, Ferris JV, Carr BS, Baron RL. Extrahepatic metastases of hepatocellular carcinoma. Radiology 2000;216(3):698–703 [DOI] [PubMed] [Google Scholar]
- 15.Brown JJ, Naylor MJ, Yagan N. Imaging of hepatic cirrhosis. Radiology 1997;202(1):1–16 [DOI] [PubMed] [Google Scholar]
- 16.El-Serag HB, Marrero JA, Rudolph L, Reddy KR. Diagnosis and treatment of hepatocellular carcinoma. Gastroenterology 2008;134(6):1752–1763 [DOI] [PubMed] [Google Scholar]
- 17.Minagawa M, Makuuchi M, Torzilli G, et al. Extension of the frontiers of surgical indications in the treatment of liver metastases from colorectal cancer: long-term results. Ann Surg 2000;231(4):487–499 [DOI] [PMC free article] [PubMed] [Google Scholar]
- 18.A new prognostic system for hepatocellular carcinoma: a retrospective study of 435 patients: the Cancer of the Liver Italian Program (CLIP) investigators. Hepatology 1998;28(3):751–755 [DOI] [PubMed] [Google Scholar]
- 19.Llovet JM, Fuster J, Bruix J. Barcelona-Clínic Liver Cancer Group The Barcelona approach: diagnosis, staging, and treatment of hepatocellular carcinoma. Liver Transpl 2004;10(2 suppl 1):S115–S120 [DOI] [PubMed] [Google Scholar]
- 20.Covey AM, Brody LA, Maluccio MA, Getrajdman GI, Brown KT. Variant hepatic arterial anatomy revisited: digital subtraction angiography performed in 600 patients. Radiology 2002;224(2):542–547 [DOI] [PubMed] [Google Scholar]
- 21.Coldwell DM, Stokes KR, Yakes WF. Embolotherapy: agents, clinical applications, and techniques. RadioGraphics 1994;14(3):623–643; quiz 645–646 [DOI] [PubMed] [Google Scholar]
- 22.Solomon B, Soulen MC, Baum RA, Haskal ZJ, Shlansky-Goldberg RD, Cope C. Chemoembolization of hepatocellular carcinoma with cisplatin, doxorubicin, mitomycin-C, ethiodol, and polyvinyl alcohol: prospective evaluation of response and survival in a U.S. population. J Vasc Interv Radiol 1999;10(6):793–798 [DOI] [PubMed] [Google Scholar]
- 23.Ramsey DE, Kernagis LY, Soulen MC, Geschwind JF. Chemoembolization of hepatocellular carcinoma. J Vasc Interv Radiol 2002;13(9 pt 2):S211–S221 [DOI] [PubMed] [Google Scholar]
- 24.Therasse P, Arbuck SG, Eisenhauer EA, et al. New guidelines to evaluate the response to treatment in solid tumors. European Organization for Research and Treatment of Cancer, National Cancer Institute of the United States, National Cancer Institute of Canada. J Natl Cancer Inst 2000;92(3):205–216 [DOI] [PubMed] [Google Scholar]
- 25.Yao FY, Hirose R, LaBerge JM, et al. A prospective study on downstaging of hepatocellular carcinoma prior to liver transplantation. Liver Transpl 2005;11(12):1505–1514 [DOI] [PubMed] [Google Scholar]
- 26.Kamel IR, Bluemke DA, Eng J, et al. The role of functional MR imaging in the assessment of tumor response after chemoembolization in patients with hepatocellular carcinoma. J Vasc Interv Radiol 2006;17(3):505–512 [DOI] [PubMed] [Google Scholar]
- 27.Trevisani F, De Notariis S, Rossi C, Bernardi M. Randomized control trials on chemoembolization for hepatocellular carcinoma: is there room for new studies?. J Clin Gastroenterol 2001;32(5):383–389 [DOI] [PubMed] [Google Scholar]
- 28.Riaz A, Ryu RK, Kulik LM, et al. Alpha-fetoprotein response after locoregional therapy for hepatocellular carcinoma: oncologic marker of radiologic response, progression, and survival. J Clin Oncol 2009;27(34):5734–5742 [DOI] [PubMed] [Google Scholar]
- 29.Trotti A, Colevas AD, Setser A, et al. CTCAE v3.0: development of a comprehensive grading system for the adverse effects of cancer treatment. Semin Radiat Oncol 2003;13(3):176–181 [DOI] [PubMed] [Google Scholar]
- 30.Kaplan EL, Meier P. Nonparametric estimation from incomplete observations. J Am Stat Assoc 1958;53:457–481 [Google Scholar]
- 31.Bradburn MJ, Clark TG, Love SB, Altman DG. Survival analysis. III. Multivariate data analysis—choosing a model and assessing its adequacy and fit. Br J Cancer 2003;89(4):605–611 [DOI] [PMC free article] [PubMed] [Google Scholar]
- 32.Llovet JM, Real MI, Montaña X, et al. Arterial embolisation or chemoembolisation versus symptomatic treatment in patients with unresectable hepatocellular carcinoma: a randomised controlled trial. Lancet 2002;359(9319):1734–1739 [DOI] [PubMed] [Google Scholar]
- 33.Lo CM, Ngan H, Tso WK, et al. Randomized controlled trial of transarterial lipiodol chemoembolization for unresectable hepatocellular carcinoma. Hepatology 2002;35(5):1164–1171 [DOI] [PubMed] [Google Scholar]
- 34.El-Serag HB. Hepatocellular carcinoma and hepatitis C in the United States. Hepatology 2002;36(5 suppl 1):S74–S83 [DOI] [PubMed] [Google Scholar]
- 35.Georgiades CS, Hong K, D’Angelo M, Geschwind JF. Safety and efficacy of transarterial chemoembolization in patients with unresectable hepatocellular carcinoma and portal vein thrombosis. J Vasc Interv Radiol 2005;16(12):1653–1659 [DOI] [PubMed] [Google Scholar]
- 36.Leung DA, Goin JE, Sickles C, Raskay BJ, Soulen MC. Determinants of postembolization syndrome after hepatic chemoembolization. J Vasc Interv Radiol 2001;12(3):321–326 [DOI] [PubMed] [Google Scholar]
- 37.Thomas MB, O’Beirne JP, Furuse J, Chan AT, Abou-Alfa G, Johnson P. Systemic therapy for hepatocellular carcinoma: cytotoxic chemotherapy, targeted therapy and immunotherapy. Ann Surg Oncol 2008;15(4):1008–1014 [DOI] [PubMed] [Google Scholar]
- 38.Abou-Alfa GK, Schwartz L, Ricci S, et al. Phase II study of sorafenib in patients with advanced hepatocellular carcinoma. J Clin Oncol 2006;24(26):4293–4300 [DOI] [PubMed] [Google Scholar]
- 39.Thomas MB, Morris JS, Chadha R, et al. Phase II trial of the combination of bevacizumab and erlotinib in patients who have advanced hepatocellular carcinoma. J Clin Oncol 2009;27(6):843–850 [DOI] [PubMed] [Google Scholar]
- 40.Riaz A, Miller FH, Kulik LM, et al. Imaging response in the primary index lesion and clinical outcomes following transarterial locoregional therapy for hepatocellular carcinoma. JAMA 2010;303(11):1062–1069 [DOI] [PMC free article] [PubMed] [Google Scholar]


