

Abstract
Background and Aims
Given the importance of postprandial hyperlipidemia to increase risk for atherosclerosis, in the present study, stable isotope-labeled meals were fed to healthy subjects (7 males and 3 females) to investigate the kinetics chylomicron synthesis and the impact of sensory exposure to lipid on metabolism.
Methods
Subjects performed 2, 24-hr inpatient studies which entailed consumption of a liquid formula evening meal containing 30g of oil (+13C2 triolein) on day 1. Breakfast (day 2) consisted of TAG fed as capsules (30g oil + 13C7 triolein) to avoid activation of mouth taste receptors. Next, modified sham feeding of cream cheese occurred over 2 hrs. In the 2 trials, the stimulus was higher-fat (HF) and lower-fat (LF) cream cheese. A liquid meal was consumed at lunch. Blood sampling occurred intermittently and chylomicron particles Sf >400-TAG, were analyzed by GC/MS.
Results
13C2-Label was found in fasting-state lipoproteins and individuals with higher body fat percentages demonstrated greater dilution of meal-TAG from endogenous sources. For both trials, 13 ± 4% of lipoprotein-TAG oleic acid was derived from the previous evening meal. Incremental AUC for TAG during HF was ~2½ times higher than after LF exposure (46 ±15 vs 17 ± 5 μmol/l × hr, P=0.04). The greater HF morning lipemia occurred with elevated glucose, insulin and NEFA peaks following lunch.
Conclusions
These data support a connection between enteral lipid metabolism and oral fat exposure, resulting in elevated postprandial lipemia. The results suggest that the intestine may participate in a mechanism coordinating oral fat signaling with control of subsequent macronutrient disposal in the body.
Keywords: Enterocytes, lipid absorption, postprandial lipemia, stable isotopes
BACKGROUND AND AIMS
Human sensory systems provide signals that guide food choice, digestion, and nutrient metabolism. 1-3 Recent findings have begun to characterize relationships between sensory signals and dietary fats. Specifically, there is increasing evidence for a gustatory component to fat detection and its role in fat digestion, gut hormone secretion, lipid trafficking in the enterocyte, and postprandial lipemia. In rodents, electro-physiological studies demonstrate taste receptor cells depolarize in response to fatty acids (FA)4, taste nerve cuts diminish fat detection5-7, and rodents can detect low FA concentrations.8, 9 Further, oral fat exposure stimulates pancreatic exocrine secretions 5, 10, 11 and augments postprandial lipemia.12 Much of this has also been documented in humans who can detect low concentrations of FA varying in chain length13 and degree of saturation 14, 15 in the oral cavity without the aid of textural or olfactory cues. Gut hormone16 and pancreatic endocrine17 secretions, as well as serum triacylglycerol (TAG) concentrations18-20, are also responsive to oral fat exposure in humans. The implications of these responses are potentially far-reaching. Recent advances in understanding of FA uptake and intracellular lipid droplet physiology support a role in the control of cellular energy utilization.21-23 Moreover, energy balance may be impacted by the effects of gut hormone secretions on appetite16 and binding of these hormones to adipocytes leads to increased TAG storage24, 25 and reduced TAG breakdown.26 The effects on intestinal lipid processing also alter absorption of fat soluble nutrients27 and the greater postprandial TAG elevation may contribute to insulin resistance28 and CVD risk.29-31 Thus, a more complete understanding of the intestinal TAG absorption process and the potential for a physiological response to fat “taste” is warranted.
The key outstanding question concerns the origin and disposition of circulating TAG after oral stimulation. Identification of an early (i.e., 30-60 minutes post oral stimulation) spike in serum TAG19 supports the existence of an intracellular pool that can be mobilized in a very short period of time. Finally, it is apparent that the greatest discrepancy in circulating TAG concentration due to oral fat exposure occurs 4-8 hours after lipid loading. 13 The present study was designed to quantify the origin of the lipid appearing in the circulation after oral fat exposure. Using a dual isotopic labeling scheme, this study identified the TAG consumed in an evening meal as it entered the circulation over a 24-hour period.
METHODS
Subjects
Ten healthy men and women (7 males and 3 females) were recruited to participate in 24-hr metabolic studies conducted at the Clinical Research Center (CRC). The protocols were approved by the Human Subjects Committees of the University of Minnesota (IRB #0106M01801), where the project was initiated, and by the University of Texas Southwestern Medical Center (IRB #032006-030) where the project was concluded, after a move of the laboratory. Inclusion criteria were non-smoking status, age 18-50y, stable body weight, and maintenance of customary exercise/activity patterns while exclusion criteria were diabetes or any other metabolic disease, or taking medications known to affect lipid metabolism. Screening evaluations consisted of an interview with a blood draw (performed in 12-hr fasted subjects who had abstained from alcohol for ≥ 48 hr) and body composition measured via Dual Energy X-ray Absorptiometry (Lunar Corporation, Madison, WI). None of the subjects selected for the study were on any medications, supplements or nutraceuticals.
Procedures
Each subject participated in two metabolic studies, which differed only by the type of sensory stimulation used (see below). Subject activities for the 3d prior to both studies were standardized for diet (energy intake based on Harris-Benedict equation32), exercise (maintenance of customary patterns), and alcohol consumption (prohibited during the 3d). Diets were prepared by the subjects themselves and consisted of whole foods. The in-patient study protocol is shown in fig 1 which shows the subject was admitted and at 1830, consumed an evening meal that provided 40% of their total daily energy (TDE) needs. After dinner, the subject was allowed to work in his/her room, and get up to move around as needed. By 2200, lights were out and subjects slept in the unit. The evening meal consisted of a cold, liquid shake containing skim milk and olive oil, and was flavored with Hershey’s® chocolate syrup. The balance of the subject’s energy needs was made up by consumption of a low-fat blueberry muffin. The final mean compositions of the shakes and muffins are shown in fig 1. Olive oil (30g) was chosen to give a distinct FA composition to the evening meal (rich in oleic acid, 18:1, n-9) to duplicate this study design parameter previously used by Mattes.19 To trace the sources of lipoprotein TAG-FA, the evening meal was labeled with a stable isotope (13C2-triolein, Isotec Inc, Miamisburg, OH; isotopic purity >99%) mixed to homogeneity into the shake. After the meal, subjects consumed no energy until 0800 on day 2. Upon rising, subjects were given a chance to wash up, an IV line was placed, and fasting blood samples were obtained. Then the subject ingested, with roughly ½ cup of water, a preload of 30, 1g capsules containing safflower oil (Nature’s Plus, Melville, NY), rich in linoleic acid (18:2, n-6) and labeled with a second stable isotope, 13C7-18:1-triolein. Sensory exposure, beginning at 0815, was set at time zero and blood was drawn at 31 time points thereafter. Different time points were used for different assays (see figures and suppl. table 1). No other food was consumed until lunch at 1300 (4.75 hr), which was composed of a liquid shake (fig 1). The lunch shake met 30% of the subject’s TDE and contained no stable isotope. FA compositions of the various meals are presented in suppl. table 2.
Figure 1. Inpatient study timeline.
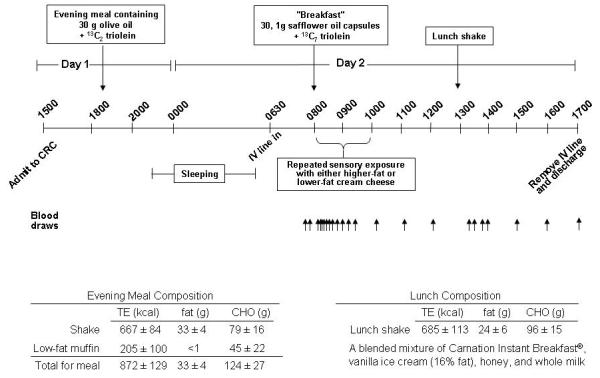
See methods for specifics of protocol. Abbreviations: CRC, clinical research center; TE, total energy.
Sensory exposure, lipoprotein isolation, and laboratory analysis
Oral sensory exposures was performed with 5g aliquots of cream cheese presented on a plastic spoon. Beginning at 0815, each exposure was chewed for 10 sec, and then expectorated into a cup.33 Sensory exposure occurred at time 0′, 5′, 10′, 15′, 20′, 25′, 30′, 35′, 40′, 45′, 60′, 75′, 90′, and 100′ (suppl. table 1). For the two different studies, higher-fat (HF) and non-fat (lower-fat, LF) cream cheese (Philadelphia® brand, Kraft Foods) served as the sensory stimuli. The HF cream cheese contained 17 mg FA per 5g aliquot and the LF cream cheese contained undetectable amounts of FA per 5g aliquot. Trace amounts of carbohydrate were in both cream cheese products (<0.15 g). The subjects were blinded with respect to which cream cheese they tasted and the two studies were conducted in random order; each study separated by ~8 wks. Women were studied during the luteal phase of the menstrual cycle. After 1000 on day 2, the subjects engaged in sedentary activities (e.g., reading, watching TV, working on a computer). All blood was drawn into iced vacutainers with serum was separated immediately. To determine the sources of TAG-FA secreted by the intestine, total TAG-rich lipoproteins (tTRL, d<1.006 g/ml), a chylomicron-rich fraction (Sf >400), and a large VLDL fraction (Sf 60-400) were isolated from serum.34 Lipoprotein-TAG and serum non-esterified fatty acids (NEFA) concentrations were determined via enzymatic assay (Wako Chemicals USA, Inc., Richmond, VA). Due to a limitation in the amount of blood that could be drawn, TRL-TAG isotopic analysis occurred immediately before the capsule consumption/sham feeding, and throughout day 2. Concentrations of serum glucose were measured via a Vitros Analyzer 950 (Ortho-Clinical Diagnostics, Rochester, NY), and insulin via chemiluminescent immunoassay (Diagnostic Products Corporation, Los Angeles, CA). Individual FA in lipoprotein-TAG were analyzed for composition by GC and for label enrichment by GC/MS as described in the supplemental data section.
Calculations and statistics
Data are presented as mean ± SEM, unless otherwise stated, and analyzed as incremental area-under-the curve (iAUC) relative to fasting values. The tests were divided into postprandial phases which included a period in the morning between 0 hr to 2 hr (during sensory exposure), one for the entire morning between 0 hr to 4.75 hr (post-capsule ingestion), one between 4.75 hr and 9 hr (post-lunch), and for the entire day (total iAUC = the post-capsule + post-lunch areas). As shown in equation 1, the contribution of total dietary oleic acid to Sf >400 lipoprotein TAG-oleic acid present in blood was calculated as follows:
At each time-point that the Sf >400 lipoproteins were isolated, the concentration of TAG in this fraction was determined by enzymatic means, correcting for dilution and concentration of the sample occurring by addition of salt solutions and tube slicing. This concentration (μmol/L of Sf >400 TAG in serum) was multiplied by the molar percentage of the TAG-FA that was oleate, as determined by GC, and that product was multiplied by the percentage of oleate in the Sf >400 lipoprotein-TAG that was labeled with 13C2 or 13C7, as determined by GC/MS.
| equ. 1 |
Oleic acid enrichments of the evening meal and capsule breakfast were determined and the % of label found in TAG oleic acid was divided by the percentage enrichment of the meal to determine the total Sf >400 TAG oleic acid in the blood derived from the meals (labeled and unlabeled oleic acid). This calculation assumes that the labeled 13C2 and 13C7 oleic acids are absorbed in a manner similar to the unlabeled oleate in the meal. Statistically significant differences between treatments were determined by paired Student’s t-tests to compare iAUCs using Statview (version 5.0.1., SAS Institute Inc, Berkeley, CA). A P-value < 0.05 was considered significant.
RESULTS
The characteristics of the 10 subjects (2 Hispanic, 2 white, 1 African American, and 2 Asian males and 1 Hispanic and 2 white females) were as follows: age (mean ± SD) of 34 ± 8 y; a body mass index of 25.4 ± 3.0 kg/m2, body weight 74.0 ± 11.5 kg; body fat % 26.8 ± 9.6%, lean mass % 67.1 ± 11.5 %, fasting concentrations of TAG 0.90 ± 0.27 mmol/L, glucose 4.9 ± 0.3 mmol/L, and insulin 7.6 ± 2.4 mU/L. With regard to the blinding of the study, subjects could not consistently identify the higher-fat (HF) or lower-fat (LF) cream cheese aliquots being tasted when asked during the study. Previous studies have shown that upon initial exposure to HF and LF cream cheese, hedonic rates for the two were similar.13
Postprandial glucose, insulin, and NEFA responses
Figure 2 shows the concentrations of serum glucose, insulin, and NEFA present throughout the day, with each graph inset containing an expanded axis to show the early phase response to tasting. Fasting concentrations of glucose, insulin, and NEFA were not different between the tests. During sensory exposure, cephalic phase responses were observed for glucose during both LF (0.19 ± 0.22 IAUC mmol/L*hr) and HF sensory exposure (0.31 ± 0.23 mmol/L*hr), with no treatment difference. Three time points demonstrated elevation after HF tasting (fig 2A, asterisks). For insulin, cephalic phase responses were also observed during LF and HF sensory exposures, but the latter treatment more than doubled the cephalic insulin iAUC (table 1, P<0.05). Insulin remained elevated during the post-capsule and post-lunch phases (table 1) after HF sensory exposure (fig 2B). Post-lunch, HF insulin iAUC was 27% higher and resulted in a 25% greater total day-long insulin iAUC (P<0.02). Cephalic phase responses for NEFA are clearly present during both tests and selected time points were elevated during the HF test post-lunch (fig 2C).
Figure 2. Serum concentrations of glucose, insulin, and NEFA.
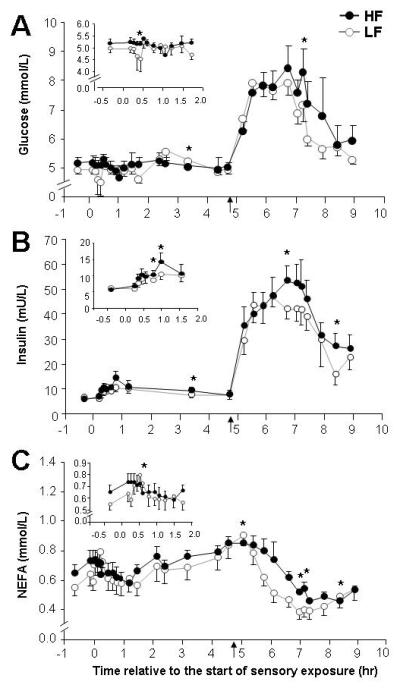
See methods for specifics of protocol. HF sensory exposure, denoted with filled symbols; LF sensory exposure, unfilled symbols. Time points that are significantly different (P<0.05) denoted by asterisks.
TABLE 1.
Fasting concentrations and incremental area-under-the curve (iAUC) data for serum insulin and lipoproteins Sf >400
| Variable | Treatments |
|
|---|---|---|
| LF Sensory Exposure |
HF Sensory Exposure |
|
| Insulin | ||
| Fasting value (mU/L) | 5.8±0.6 | 6.3 ± 0.3 |
| Sensory exposure iAUC (mmol/L*hr) | 3 ± 1 | 7 ± 1 a |
| Post-capsule IAUC (mmol/L*hr) | 13 ± 4 | 26 ± 8 a |
| Post-lunch iAUC (mmol/L*hr) | 121 ± 11 | 140 ± 12 a |
| Total daylong iAUC (mmol/L*hr) | 133 ± 12 | 166 ± 17 a |
| Sf >400-TAG | ||
| Fasting value (μmol/L) | 23 ± 4 | 33 ± 7 |
| Sensory exposure iAUC (μmol/L*hr) | 17 ± 5 | 46 ± 15 a |
| Post-capsule IAUC (μmol/L*hr) | 217 ± 70 | 272 ± 90 |
| Post-lunch iAUC (μmol/L*hr) | 1056 ± 173 | 1361 ± 268 |
| Total daylong iAUC (μmol/L*hr) | 1273 ± 221 | 1633 ± 342 |
Data are mean ± SEM (n=10). Data for iAUC are relative to the fasting value and the phases (sensory exposure, post-capsule, etc) are described in the methods section.
P < 0.02 LF sensory exposure compared to HF sensory exposure.
TAG concentrations and sources of lipoprotein-TAG
No differences were detected for serum-TAG or Sf 60-400-TAG responses (fig 3A and 3C). For the cephalic-phase TAG response for Sf >400 lipoproteins, HF iAUC was 2.7x larger than the LF iAUC (table 1). Qualitatively, between time 2 hr and 4.75 hr, the two Sf >400 TAG concentration curves (fig 3B) diverged resulting in a higher HF post-lunch peak at 5.75 hr. The stable isotope patterns of enrichment in the Sf>400 fraction (fig 4A) demonstrate the dominance of evening meal (Evmeal) label at the onset of the experiment in the fasting state, followed by an abrupt increase during oral fat exposure (denoted by an arrow). At the beginning of day 2, in the fasting state 52 ± 5% of Sf>400 TAG-oleic acid was derived from the Evmeal (data not shown), with no difference between the HF and LF studies (P=0.48). Evmeal label enrichment decayed throughout the morning (fig 4A, filled diamonds) and rose again after lunch, with a similar pattern between the HF and LF trials. Similar patterns of absorption were also evident in the fatty acid composition of lipoprotein-TAG (suppl. fig 1). For both HF and LF tests, a peak in linoleic acid percentage occurred precisely at 5 hr, before lunch-TAG could have been absorbed (suppl. fig 1). Shown in fig 4B is the total daylong iAUC of lipoprotein Sf >400 TAG-18:1 found in the blood. Of this total iAUC, 138 ± 49 μmol/L*h was derived from the Evmeal after HF, compared to 109 ± 26 μmol/L*h after LF sensory exposure (P=0.29). Analyzed as a percentage of daylong 18:1 concentration, the 18:1 derived from the Evmeal did not differ between tests (13 ± 4%, P=0.48). By contrast, the breakfast capsule daylong 18:1 iAUC was significantly greater after HF (524 ± 105 μmol/L*h) compared to LF sensory exposure (354 ± 113 μmol/L*h, P=0.008). As a percentage of total 18:1 found in lipoprotein-TAG, this represented 50 ± 4% of the 18:1 iAUC derived from the capsule after HF versus 33 ± 5% after LF sensory exposure (P=0.02).
Figure 3. Concentrations of serum-TAG and TAG in lipoprotein fractions Sf >400 and Sf 60-400.
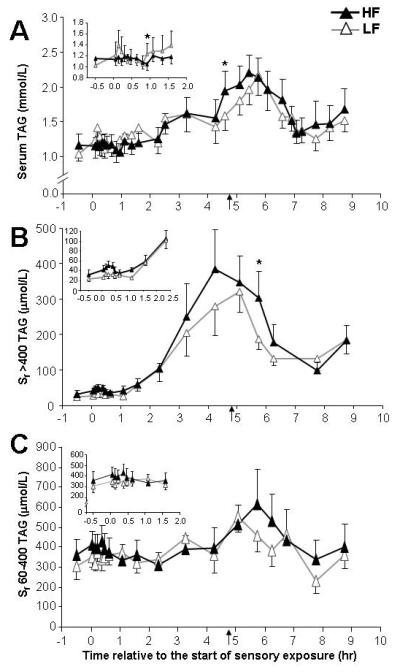
See legend of figure 2 for details.
Figure 4. Sf >400 lipoprotein-TAG FA labeling (4A) and accounting of the sources of lipoprotein-TAG oleic acid by labeling two consecutive meals (4B).
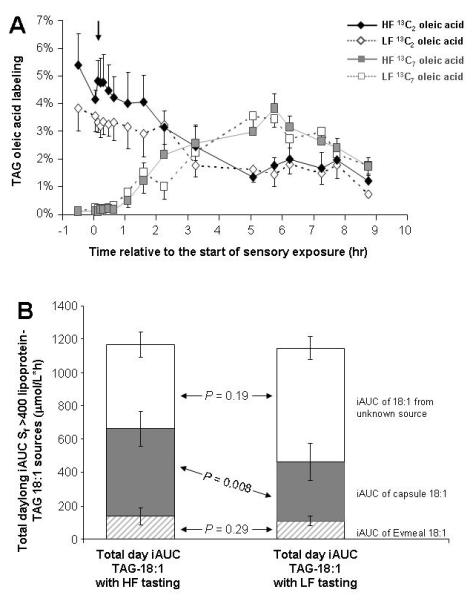
A) The evening meal fed the night before was labeled with 13C2 triolein and the morning capsules were labeled with 13C7 triolein. B) Sources of the total daylong iAUC of Sf>400 TAG oleic acid were identified from labeling patterns and enrichments of the Evmeal (hatched area), capsules (filled grey area) and the sum minus these two sources.
The pattern of individual responses
Because isotope labeling and sensory exposure have not been tested concurrently, we present the stable isotope enrichments for individual subjects (fig 5). The overall differences between subjects are remarkable; yet, there was a generally consistent pattern of TAG absorption within a subject. At fasting on day 2, significant residual label from the Evmeal was present in the Sf >400, chylomicron fraction (horizontal arrows). This label decayed, approaching zero in some subjects around mid-day (subject 3), and lingering in the chylomicron fraction of others (subjects 5 and 7). Differing patterns between subjects are highlighted by data for subject 10, in which the pattern of 13C7 capsule label (dashed line) rose in a near linear fashion during both tests, peaking at lunch (5.7 hr) for the LF test and just after lunch for the HF test. By contrast for subject 3, 13C7 entered the serum gradually, peaking very late in the day during both tests. For many subjects, but not all, the cephalic phase was characterized by a small peak in 13C2 label present at the onset of tasting (asterisks). Further, although the 13C2 label decayed throughout the day, a peak again was present at the onset of lunch (6 hr, denoted by upward arrows) in some subjects, suggesting an acute re-access of lipid from the Evmeal at the onset of lunch.
Figure 5. Pattern of labeling of lipoproteins Sf >400 TAG.
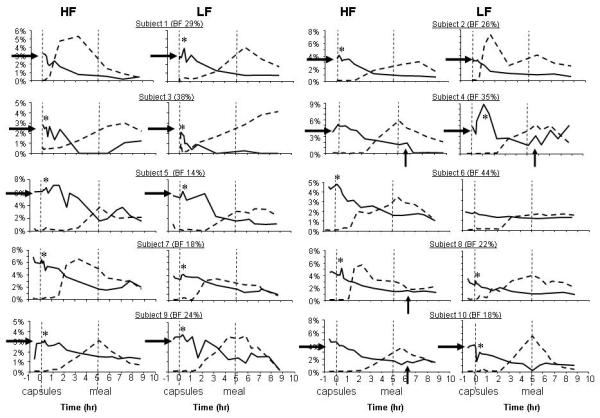
Evening meal label data (solid line) and capsule label (dashed lines) are presented for individual subjects from HF and LF sensory exposure. The unit on the Y-axis represents the percentage of Sf >400 lipoprotein-TAG oleic acid that is labeled. Horizontal arrows highlight similar starting enrichment of 13C2 at the beginning of the experiment, asterisks denote cephalic phase peaks, and upward arrows highlight acute increases in use of the 13C2 label at the onset of lunch, 4.75 hr.
Residual 13C2 Evmeal label was significantly correlated between the two tests (fig 6A) suggesting that dilution through the intestine is a characteristic that is different among subjects but somewhat reproducible within a subject. Significant negative correlations were observed between residual 13C2 label entering the blood at the start of the experiment and the subject’s body fat percentage (fig 6B). In other words, leaner subjects had lesser dilution of FA used for intestinal lipoprotein-TAG synthesis. Although the HF correlation did not reach statistical significance, the similar relationships between the HF and LF tests, would be expected since the residual label is that which is present in the fasting state before oral fat exposure began. Other subject characteristics (fasting concentrations of NEFA, insulin, glucose, HOMA) were investigated but no relationships were found to correlate with the residual 3C2 label in the morning. Following HF sensory exposure (fig 6C), a positive relationship was observed between the 13C2 residual label at the start of the experiment and the peak 13C7 enrichment achieved post-lunch. By contrast, after LF-sensory tasting, the correlation between 13C2 residual label and peak post-lunch 13C7 was absent (fig 6D). One possible mechanism for this finding could be that post-lunch LF NEFA concentrations were lower and thus contributed less to intestinal FA use which would result in less dilution of 13C7. To test this, for each HF and LF data set, simple regression was performed on the peak 13C7 enrichment after lunch and either the post-lunch nadir NEFA concentration or the post-lunch NEFA AUC; no significant correlations were found for either the HF or LF treatments.
Figure 6. Relationships between subject body fat residual Evmeal label, subject body fat %, and residual label and peak capsule enrichment.
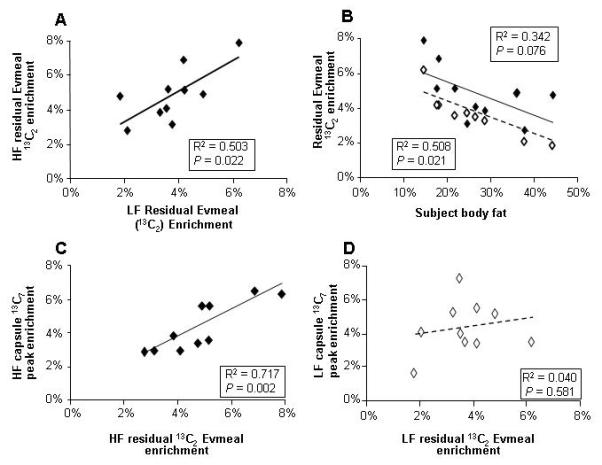
Data are from the HF (filled symbols, solid regression line) and the LF experiments (unfilled symbols, dashed line). A) Relationship between the residual Evmeal enrichment in Sf>400-TAG in the fasting state during HF and LF sensory tests; B) Subject body fat and the residual Evmeal label in Sf>400-TAG in the fasting state; C) fasting enrichment of Evmeal label in the morning vs capsule label enrichment during HF sensory exposure and D) during LF sensory exposure.
DISCUSSION
The goal of the present study was to track the absorption and concentrations of labeled lipids consumed over three successive eating events (dinner of day 1; breakfast and lunch of day 2). Why study the effects of sequential meals? The reason is that a confluence of data presented over the past 8 yrs has suggested that the entry of meal lipid is not complete within the 6 hours following the meal, and that the taste of a meal impacts both immediate lipid absorption 18, 20, 35, and the metabolism of lipid consumed in the next meal.16, 36, 37 The wider context for the present study was stimulated by recent advancements in three separate scientific areas: 1) progress in the understanding of how intestinal physiology impacts whole body energy metabolism38 after intestinal bypass surgery, 2) an accumulating body of evidence demonstrating that components of intracellular lipid droplets participate in the control of FA availability and trafficking.21, and 3) identification of putative fat taste receptors in rodents11, 39, 40 and strong evidence 41 that humans can detect FA in the oral cavity. The sum of these observations point toward a potential role of oral fat detection, referred to here as fat taste, to impact intestinal physiology, and subsequently augment postprandial lipemia. The present findings support the hypothesis that in some individuals, intestinal-TAG release is part of the cephalic phase response to taste and through the use of stable isotope labeling of consecutive meals, we extend this understanding with regard to the origin of the TAG lipids. Cephalic phase changes in insulin are known to be small in magnitude42, comparable to the changes in insulin observed here between 0 and 1 hr (fig 2B). Similarly, the appearance of the small increases in blood-TAG concentration at the onset of tasting (fig 3B and fig 5) raises the question of whether these increases were due to entry of preformed chylomicrons, pushed into the circulation as a result of sensory-induced peristalsis, or due to an immediate stimulation of chylomicron synthesis. A number of facts favor the latter mechanism. Although lymph flow may be slow in the postabsorptive state, it is known that nascent chylomicrons are secreted during fasting.43 Such physiology is supported here from the onset of blood sampling by the fall in evening meal FA labeled by both the stable isotope 13C2 oleic acid (fig 4A) and the oleic FA composition of the lipoprotein-TAG (supplementary fig 1). The patterns demonstrate steady decay from time 0 through 5 hr. Further, the presence of an oleic acid peak between 0 and 1 hr (fig 4A, arrow) for the HF test supports secretion of chylomicrons carrying TAG with a FA composition that is different from particles secreted at either 0 or 1 hr. Acute mobilization of stored intestinal lipid has been shown using electron microscopy of intestinal tissue by Robertson et al.44 What is the signal that causes mobilization of stored TAG during the cephalic phase? It may be a primary, vagally-mediated response27 or secondary to other cephalic phase responses (e.g., insulin).42
Our second key finding is that the data unequivocally document an appreciable quantity of previously-ingested lipid used for intestine-TAG synthesis for >18 hrs, spanning at least 2 meals. At the onset of day 2, 52 ± 5% of lipoprotein-TAG oleic acid was derived from the previous evening meal. This label decayed throughout the day and a minimum of 13 ± 4% of the previous evening meal’s TAG was present on day 2. These data are in contrast to the generally-held belief that meal fat is 95-98% absorbed in the postprandial period and that any residual lipid in the intestine reflects malabsorption.45 Lunch chylomicrons containing the evening meal isotope were concurrently labeled with the morning capsule isotope consumed 5 hrs earlier; making up ½ of the labeling pattern. We have previously fed, at breakfast and lunch, meals whose compositions and isotopic contents were identical.46 Yet, we found that only after lunch, did the chylomicron-TAG isotope enrichment become identical to the meals’ isotopic enrichments. A similar observation was made by Ravikumar, whose data demonstrate that a breakfast label peaked in the blood just after lunch.42 These and other data suggest that a large portion of breakfast chylomicrons carry pre-ingested lipid.42-44 One mechanism for this effect could be recycling of label into the enterocyte through the basolateral surface. The pattern of labeled oleic acid entry shows that in the morning, fasting chylomicron-TAG is derived first from an evening meal, and also potentially from serum NEFA through spillover of dietary fatty acids. Ravikumar et al demonstrated the presence of minute amounts of dietary label consumed at breakfast, in the plasma NEFA pool 24 hours later42 and this could provide a source of fasting chylomicron label found in the fasted state. Recycling of stable isotope over a 24-hr period could occur if label entered adipose and then re-emerged, coming back out of adipose in the fasting state. This is unlikely given the large quantity of adipose mass (kg) compared to the very small quantities of tracer (0.01 μmol) available. Breakfast FA enter enterocytes and are used for chylomicron secretion in combination with the stored TAG, or that taken up as NEFA (see below). In such a scheme, the flow of lipid in the intestine contributes to, but is not entirely constrained by, a “last in-last out” phenomenon since breakfast-TAG can be secreted immediately from, and also simultaneously enter, the storage pool. It is clear that sequential increases in meal-TAG content result in progressively larger lipemic responses (e.g., 40g TAG fed results in 2x the postprandial lipemia as 20g TAG fed).45 Yet, how can increasing doses of TAG eaten cause graded increases in blood lipid if a significant quantity of the lipid entering blood was not derived from the meal itself? For both of these observations to hold, some mechanism must control the quantity of secreted lipid based on lipid coming in. Future studies are needed to determine whether the sensation of fat in the mouth provides part of the cue to direct greater TAG-droplet use when higher-fat meals are eaten.46
Our third key finding is that HF sensory exposure, but not LF exposure was associated with higher glucose and insulin peaks after the next meal. Past studies of meal fat absorption have clearly identified a process called the “second meal effect”47 in which the macronutrient composition of a previous meal impacts the metabolism of the next meal.48, 49 Evidence exists that humans best metabolize meals with a similar macronutrient content to that most recently consumed; a high-fat evening meal can slow glucose metabolism the next morning and vice versa.49, 50 However, the present data suggest that simply tasting a HF substance results in refractory metabolism of carbohydrate and that the carry-over effect of taste can last for 5-6 hrs. The mediator of this effect may be higher postprandial TAG concentrations that occur with HF sensory exposure.12, 19, 20 The fourth finding here was a significant negative association between the subjects’ body fat and the residual percentages of evening meal label entering the blood the next morning in the fasting state. This is the first time such an observation has been made and replication of these findings within a larger study is needed. However, if true, lower residual labeling would occur due to dilution of the label within the enterocyte, and one candidate for such dilution is the serum NEFA pool.51 Recently, Lewis and colleagues demonstrated that elevations in plasma NEFA were associated with significantly greater apoB48 production rates.51 Based on these strong data, we investigated the relationship between fasting NEFA concentration and dilution of intestinal labeling; we did not find a significant correlation (suppl. figure 2). However, the blood NEFA concentration may not reflect its entry into the enterocyte and a stimulatory role of NEFA in intestinal chylomicron synthesis is consistent with the dominant role of NEFA as source of hepatic TAG synthesis.44
Two limitations of this study deserve comment. The first is that, although modified sham feeding (taste/spit) and consumption of oil capsules have been used widely in sensory studies 16, 52-54, this manner of feeding is not physiologic. Recent work noted similar postprandial-TAG concentrations when oral fat exposure was provided sequentially after lipid loading or when intermixed with loading, more closely mimicking an eating event.55 Further, the blood-TAG peak after capsule ingestion occurred between 3 and 4 hrs postprandially - exactly as expected for a regular meal.56 Since this feeding paradigm was used for both studies, the differences between the studies must be attributed to the different sensory tests. Second, the capsules ingested in the morning were rich in polyunsaturated FA while the label used to track this fat was a monounsaturated FA (13C7 triolein). Dietary PUFA and MUFA could be absorbed differently.57, 58 However, the early pattern of postprandial rise in chylomicron-TAG linoleic acid and the oleic acid label enrichment supported similar absorption (suppl. figure 3).
In summary, using isotopic labeling of consecutive meals, our data provide objective evidence of a significant delay in the full absorption of meal-TAG in healthy humans. At the onset of successive meals, a storage pool of lipid is likely accessed repeatedly for chylomicron assembly, its delay in use can span up to 18 hrs, and release of this pool could be augmented by fat taste. Some mechanism must control the quantity of lipid to be secreted based on the quantity of incoming lipid.46 The present results also raise the question of whether people who habitually consume HF meals retain more lipid in the intestine than those who consume LF meals. Lastly, increased subject body fat is associated with dilution of meal-TAG from FA originating from either enterocyte intracellular stores or from the serum. Determining whether a connection exists between intestinal fat stores and elevated postprandial lipemia will be a key goal for future investigation.
Supplementary Material
ACKNOWLEDGEMENTS
We are grateful to the participants for contributing their time to the study. We thank the staff at the GCRC for the medical management of these studies and express our appreciation to Nikki Hiner, Michael Adams, and Vidya Vaidyanathan for providing expert technical assistance.
This research was supported by Grant Number UL1RR024982, by the NCRR/NI titled North and Central Texas Clinical and Translational Science Initiative and UT Southwestern Medical Center (NIH M01-RR00633), NIH 5R01 DK04529414 (R. Mattes, PI), and the UTSW Taskforce on Obesity Research - Human Biology Core 1PL1DK081183-01 (Edward Livingston, PI), and 8 UL1 DE019584-02 (Jay Horton, PI)
Abbreviations
- iAUC
incremental area-under-the-curve
- GC/MS
gas chromatography/mass spectrometry
- HF
higher-fat
- LF
lower-fat
- FA
fatty acids
- NEFA
non-esterified fatty acids
- Sf
Svedberg unit of floatation
- TAG
triacylglycerols
- TDE
total daily energy
- tTRL
total triacylglycerol-rich lipoproteins
- VLDL
very-low density lipoproteins
Footnotes
No conflicts of interests exists for this study or manuscript
Publisher's Disclaimer: This is a PDF file of an unedited manuscript that has been accepted for publication. As a service to our customers we are providing this early version of the manuscript. The manuscript will undergo copyediting, typesetting, and review of the resulting proof before it is published in its final citable form. Please note that during the production process errors may be discovered which could affect the content, and all legal disclaimers that apply to the journal pertain.
Portions of this work were presented at the American Diabetes Association National Meeting in 2008.
REFERENCES
- 1.Zafra M, Molina F, Puerto A. The neural/cephalic reflexes in the physiology of nutrition. Neuroscience and Behavior Reviews. 2006;30:1032–1044. doi: 10.1016/j.neubiorev.2006.03.005. [DOI] [PubMed] [Google Scholar]
- 2.Mattes RD. Physiologic responses to sensory stimulation by food: nutritional implications. J Am Diet Assoc. 1997;97:406–413. doi: 10.1016/S0002-8223(97)00101-6. [DOI] [PubMed] [Google Scholar]
- 3.Power ML, Schulkin J. Anticipatory physiological regulation in feeding biology: cephalic phase responses. Appetite. 2008;50:194–206. doi: 10.1016/j.appet.2007.10.006. [DOI] [PMC free article] [PubMed] [Google Scholar]
- 4.Gilbertson TA, Fontenot DT, Liu L, et al. Fatty acid modulation of K+ channels in taste receptor cells: gustatory cues for dietary fat. Am J Physiol. 1997;272:C1203–C1210. doi: 10.1152/ajpcell.1997.272.4.C1203. [DOI] [PubMed] [Google Scholar]
- 5.Gaillard D, Laugerette F, N. D, El-Yassimi A, et al. The gustatory pathway is involved in CD36-mediated orosensory perception of long-chain fatty acids in the mouse. FASEB J. 2008;22:1458–1468. doi: 10.1096/fj.07-8415com. [DOI] [PubMed] [Google Scholar]
- 6.Pittman D, Crawley ME, Corbin CH, et al. Chorda tympani nerve transection impairs the gustatory detection of free fatty acids in male and female rats. Brain Research. 2007;1151:74–83. doi: 10.1016/j.brainres.2007.03.027. [DOI] [PubMed] [Google Scholar]
- 7.Stratford JM, Curtis KS, Contreras RJ. Chorda tympani nerve transection alters linoleic acid taste discrimination by male and female rats. Physiol Behav. 2006;89:311–319. doi: 10.1016/j.physbeh.2006.06.009. [DOI] [PubMed] [Google Scholar]
- 8.Tsuruta M, Kawada T, Fukuwatari T, et al. The orosensory recognition of long-chain fatty acids in rats. Physiol Behav. 1999;66:285–288. doi: 10.1016/s0031-9384(98)00299-6. [DOI] [PubMed] [Google Scholar]
- 9.Takeda M, Imaizumi M, Fushiki T. Preference for vegetable oils in the two-bottle choice test in mice. Life Sciences. 2000;67:197–204. doi: 10.1016/s0024-3205(00)00614-7. [DOI] [PubMed] [Google Scholar]
- 10.Hiraoka T, Fukuwatari T, Imaizumi M, et al. Effects of oral stimulation with fats on the cephalic phase of pancreatic enzyme secretion in esophagostomized rats. Physiol Behav. 2003;79:713–717. doi: 10.1016/s0031-9384(03)00201-4. [DOI] [PubMed] [Google Scholar]
- 11.Laugerette F, Passilly-Degrace P, Patris B, et al. CD36 involvement in orosensory detection of dietary lipids, spontaneous fat preference, and digestive secretions. J Clin Invest. 2005;115:3177–3184. doi: 10.1172/JCI25299. [DOI] [PMC free article] [PubMed] [Google Scholar]
- 12.Ramirez I. Oral stimulation alters digestion of intragastric oil meals in rats. Am J Physiol. 1985;248 doi: 10.1152/ajpregu.1985.248.4.R459. [DOI] [PubMed] [Google Scholar]
- 13.Mattes RD. Oral detection of short, medium and long chain fatty acids in humans. Chem Senses. 2009;34:145–150. doi: 10.1093/chemse/bjn072. [DOI] [PMC free article] [PubMed] [Google Scholar]
- 14.Chale-Rush A, Burgess JR, Mattes RD. Evidence for human orosensory (taste?) sensitivity to free fatty acids. Chem Senses. 2007;32:423–431. doi: 10.1093/chemse/bjm007. [DOI] [PubMed] [Google Scholar]
- 15.Chale-Rush A, Burgess JR, Mattes RD. Multiple routes of chemosensitivity to free fatty acids in humans. Am J Physiol Gastrointest Liver Physiol. 2007;272:G1206–G1212. doi: 10.1152/ajpgi.00471.2006. [DOI] [PubMed] [Google Scholar]
- 16.Health RB, Jones R, Frayn KN, et al. Vagal stimulation exaggerates the inhibitory ghrelin response to oral fat in humans. J Endocrinology. 2004;180:273–281. doi: 10.1677/joe.0.1800273. [DOI] [PubMed] [Google Scholar]
- 17.Crystal SR, Teff KL. Tasting fat: Cephalic phase hormonal responses and food intake in restrained and unrestrained eaters. Physiol Behav. 2006;89:213–220. doi: 10.1016/j.physbeh.2006.06.013. [DOI] [PubMed] [Google Scholar]
- 18.Mattes RD. The taste of fat elevates postprandial triacylglycerol. Physiol Behav. 2001;74:343–348. doi: 10.1016/s0031-9384(01)00578-9. [DOI] [PubMed] [Google Scholar]
- 19.Mattes RD. Oral fat exposure increases the first phase triacylglycerol concentration due to release of stored lipid in humans. J Nutr. 2002;132:3656–3662. doi: 10.1093/jn/132.12.3656. [DOI] [PubMed] [Google Scholar]
- 20.Mattes RD. Brief oral stimulation, but especially oral fat exposure, reliably elevates serum triglycerides in humans. Amer J Physiol. 2009;296:G365–G371. doi: 10.1152/ajpgi.90591.2008. [DOI] [PMC free article] [PubMed] [Google Scholar]
- 21.Brasaemle DL, Subramania V, Garcia A, et al. Perilipin A and the control of triacylglycerol metabolism. Mol Cell Biochem. 2009;326:15–21. doi: 10.1007/s11010-008-9998-8. [DOI] [PubMed] [Google Scholar]
- 22.Hamilton JA. New insights into the roles of proteins and lipids in membrane transport of fatty acids Prostaglandins. Leukotrienes and Essential Fatty Acids. 2007;77:355–361. doi: 10.1016/j.plefa.2007.10.020. [DOI] [PubMed] [Google Scholar]
- 23.Zhu J, Lee B, Buhman KK, et al. A dynamic, cytoplasmic triacylglycerol pool in enterocytes revealed by ex vivo and in vivo coherent anti-Stokes Raman scattering imaging. J Lipid Res. 2009;50:1080–1089. doi: 10.1194/jlr.M800555-JLR200. [DOI] [PMC free article] [PubMed] [Google Scholar]
- 24.Getty-Kaushik L, Song DH, Boylan MO, et al. Glucose-dependent insulinotropic polypeptide modulates adipocyte lipolysis and reesterification. Obesity. 2006;14:1124–1131. doi: 10.1038/oby.2006.129. [DOI] [PubMed] [Google Scholar]
- 25.Kim S-J, McIntosh CHS. Activation of lipoprotein lipase by glucose-dependent insulinotropic polypeptide in adipocytes. J Biol Chem. 2007;282:8557–8567. doi: 10.1074/jbc.M609088200. [DOI] [PubMed] [Google Scholar]
- 26.Feinle C, O’Donovan D, Doran S, et al. Effects of fat digestion on appetite, APD motility, and gut hormones in response to duodenal fat infusion in humans. Am J Physiol. 2003;284 doi: 10.1152/ajpgi.00512.2002. [DOI] [PubMed] [Google Scholar]
- 27.Mendeloff AI. The effects of eating and of sham feeding upon the absorption of vitamin A palmitate in man. J Clin Invest. 1954;33:1015–1021. doi: 10.1172/JCI102968. [DOI] [PMC free article] [PubMed] [Google Scholar]
- 28.Hsieh J, Hayashi AA, Webb J, et al. Postprandial dyslipidemia in insulin resistance: mechanisms and role of intestinal insulin sensitivity. Atheroscler. 2008;9:7–13. doi: 10.1016/j.atherosclerosissup.2008.05.011. [DOI] [PubMed] [Google Scholar]
- 29.Nakamura H, Ikewaki K, Nishiwaki M, et al. Postprandial hyperlipemia and coronary artery disease. Annals of the New York Academy of Sciences. 1995;748:441–446. doi: 10.1111/j.1749-6632.1994.tb17340.x. [DOI] [PubMed] [Google Scholar]
- 30.Cohn JS. Postprandial lipemia: emerging evidence for atherogenicity of remnant lipoproteins. Can J Cardiol. 1998;14:18B–27B. [PubMed] [Google Scholar]
- 31.Havel RJ. Postprandial hyperlipidemia and remnant lipoproteins. Curr Op Lipid. 1994;5:102–9. doi: 10.1097/00041433-199404000-00006. [DOI] [PubMed] [Google Scholar]
- 32.Harris JA, Benedict FG. Biometric study of basal metabolism in man. Carnegie Institute; Washington DC: 1919. [Google Scholar]
- 33.Mattes RD. Oral exposure alters postprandial lipid metabolism in humans. Am J Clin Nutr. 1996;63:911–917. doi: 10.1093/ajcn/63.6.911. [DOI] [PubMed] [Google Scholar]
- 34.Parks EJ, Krauss RM, Christiansen MP, et al. Effects of a low-fat, high-carbohydrate diet on VLDL-triglyceride assembly, production and clearance. J Clin Invest. 1999;104:1087–1096. doi: 10.1172/JCI6572. [DOI] [PMC free article] [PubMed] [Google Scholar]
- 35.Mattes RD. Oral exposure to butter, but not fat replacers elevates postprandial triacylglycerol concentration in humans. J Nutr. 2001;131:1491–1496. doi: 10.1093/jn/131.5.1491. [DOI] [PubMed] [Google Scholar]
- 36.Robertson MD, Mason AO, Frayn KN. Timing of vagal stimulation affects postprandial lipid metabolism in humans. Amer J Clin Nutr. 2002;76:71–77. doi: 10.1093/ajcn/76.1.71. [DOI] [PubMed] [Google Scholar]
- 37.Whitley HA, Humphreys SM, Samra JS, et al. Metabolic responses to isoenergetic meals containing different proportions of carbohydrate and fat. British J Nutr. 1997;78:15–26. doi: 10.1079/bjn19970115. [DOI] [PubMed] [Google Scholar]
- 38.Cummings DE. Endocrine mechanisms mediating remission of diabetes after gastric bypass surgery. Int J Obes. 2009;(Suppl 1):S33–40. doi: 10.1038/ijo.2009.15. [DOI] [PubMed] [Google Scholar]
- 39.Calder PC, Deckelbaum RJ. CD36: taste the difference. Curr Opin in Clinical Nutr and Metabolic Care. 2006;9:77–78. doi: 10.1097/01.mco.0000214562.14074.fa. [DOI] [PubMed] [Google Scholar]
- 40.Gilbertson TA, Damak S, Margolskee RF. The molecular physiology of taste transduction. Curr Opin in Neurobiology. 2000;10:519–527. doi: 10.1016/s0959-4388(00)00118-5. [DOI] [PubMed] [Google Scholar]
- 41.Mattes RD. Is there a fatty acid taste? Ann Rev Nutr. 2009;29:7.1–7.23. doi: 10.1146/annurev-nutr-080508-141108. [DOI] [PMC free article] [PubMed] [Google Scholar]
- 42.Ravikumar B, Carey PE, Snaar JEM, et al. Real-time assessment of postprandial fat storage in liver and skeletal muscle in health and type 2 diabetes. Amer J Physiol. 2005;288:E789–E797. doi: 10.1152/ajpendo.00557.2004. [DOI] [PubMed] [Google Scholar]
- 43.Renuka KD, Silva R, Wright JW, et al. Meal ingestion provokes entry of lipoproteins containing fat from the previous meal: possible metabolic implications. Eur J Nutr. 2005;44:377–383. doi: 10.1007/s00394-004-0538-3. [DOI] [PubMed] [Google Scholar]
- 44.Timlin MT, Barrows BR, Parks EJ. Increased dietary substrate delivery alters hepatic fatty acid recycling in healthy men. Diabetes. 2005;54:2694–2701. doi: 10.2337/diabetes.54.9.2694. [DOI] [PubMed] [Google Scholar]
- 45.Dubois C, Beaumier G, Juhel C, et al. Effects of graded amounts (0-50 g) of dietary fat on postprandial lipemia and lipoproteins in normolipidemic adults. Amer J Clin Nutr. 1998;67:31–38. doi: 10.1093/ajcn/67.1.31. [DOI] [PubMed] [Google Scholar]
- 46.Parks E. International Atherosclerosis Society; 2002. The origin of the lipids present in triacylglycerol-rich lipoproteins in the postprandial state. Commentary at Athero.org. [Google Scholar]
- 47.Fielding BA, Callow J, Owen RM, et al. Postprandial lipemia: the origin of an early peak studied by specific dietary fatty acid intake during sequential meals. Amer J Clin Nutr. 1996;63:36–41. doi: 10.1093/ajcn/63.1.36. [DOI] [PubMed] [Google Scholar]
- 48.Evans K, Kuusela PJ, Cruz ML, et al. Rapid chylomicron clearance following sequential meals: effects of second meal composition. Brit J Nutr. 1998;79:425–429. doi: 10.1079/bjn19980072. [DOI] [PubMed] [Google Scholar]
- 49.Robertson MD, Henderson RA, Vist GE, et al. Extended effects of evening meal carbohydrate-to-fat ratio on fasting and postprandial substrate metabolism. Amer J Clin Nutr. 2002;75:505–510. doi: 10.1093/ajcn/75.3.505. [DOI] [PubMed] [Google Scholar]
- 50.Randle PJ, Garland PB, Newsholm EA. The glucose-fatty acid cycle: its role in insulin sensitivity and the metabolic disturbances of diabetes mellitus. Lancet. 1963;1:785–9. doi: 10.1016/s0140-6736(63)91500-9. [DOI] [PubMed] [Google Scholar]
- 51.Duez H, Lamarche B, Valero R, et al. Both intestinal and hepatic production are stimulated by an acute elevation in plasma free fatty acids in humans. Circulation. 2008;117:2369–2376. doi: 10.1161/CIRCULATIONAHA.107.739888. [DOI] [PMC free article] [PubMed] [Google Scholar]
- 52.Jackson KG, Robertson DM, Fielding BA, et al. Second meal effect: modified sham feeding does not provoke release of stored triacylglycerol from a previous high-fat meal. Br J Nutr. 2001;85:149–156. doi: 10.1079/bjn2000226. [DOI] [PubMed] [Google Scholar]
- 53.Robertson MD, Mason AO, Frayn KN. Oro-sensory stimulation prior to fat ingestion impairs postprandial fat tolerance. Int J Obes. 2000;24:S55. [Google Scholar]
- 54.Tittelbach TJ, Matttes RD. Effect of orosensory stimulation on postprandial thermogenesis in humans. Phys and Behavior. 2002;75:71–81. doi: 10.1016/s0031-9384(01)00644-8. [DOI] [PubMed] [Google Scholar]
- 55.Mattes RD. Oral fat exposure pattern and lipid loading effects on the serum triacylglycerol concentration of humans. Chemosensory Perception. 2009 doi: 10.1007/s12078-009-9062-4. (in press) [DOI] [PMC free article] [PubMed] [Google Scholar]
- 56.Parks EJ. Recent findings in the study of postprandial lipemia. Current Atherosclerosis Reports. 2001;3:462–470. doi: 10.1007/s11883-001-0036-5. [DOI] [PubMed] [Google Scholar]
- 57.Pedersen A, Marckmann P, Sandstrom B. Postprandial lipoprotein, glucose and insulin responses after two consecutive meals containing rapeseed oil, sunflower oil or palm oil with or without glucose at the first meal. British J Nutrition. 1999;82:97–104. [PubMed] [Google Scholar]
- 58.Sakr SW, Attia N, Haourigui M, et al. Fatty acid composition of an oral load affects chylomicron size in human subjects. Brit J Nutr. 1997;77:19–31. doi: 10.1017/s0007114500002853. [DOI] [PubMed] [Google Scholar]
Associated Data
This section collects any data citations, data availability statements, or supplementary materials included in this article.