

Abstract
Objectives
To estimate the proportion of all-cause adult patient attrition from antiretroviral therapy (ART) programs in service delivery settings in sub-Saharan Africa through 36 months on treatment.
Methods
We identified cohorts within Ovid Medline, ISI Web of Knowledge, Cochrane Database of Systematic Reviews and four conference abstract archives. We summarized retention rates from studies describing observational cohorts from sub-Saharan Africa reporting on adult HIV 1- infected patients initiating first-line three-drug ART. We estimated all-cause attrition rates for 6, 12, 18, 24, or 36 months after ART initiation including patients who died or were lost to follow-up (as defined by the author), but excluding transferred patients.
Results
We analysed 33 sources describing 39 cohorts and 226 307 patients. Patients were more likely to be female (median 65%) and had a median age at initiation of 37 (range 34–40). Median starting CD4 count was 109 cells/mm3. Loss to follow-up was the most common cause of attrition (59%), followed by death (41%). Median attrition at 12, 24 and 36 months was 22.6% (range 7%–45%), 25% (range 11%–32%) and 29.5% (range 13%–36.1%) respectively. After pooling data in a random-effects meta-analysis, retention declined from 86.1% at 6 months to 80.2% at 12 months, 76.8% at 24 months and 72.3% at 36 months. Adjusting for variable follow-up time in a sensitivity analysis, 24 month retention was 70.0% (range: 66.7%–73.3%), while 36 month retention was 64.6% (range: 57.5%–72.1%).
Conclusions
Our findings document the difficulties in retaining patients in care for lifelong treatment, and the progress being made in raising overall retention rates.
Keywords: antiretroviral therapy, attrition, retention, sub-Saharan Africa, systematic review, human immuno-deficiency virus
Introduction
Although a great deal of research on daily adherence to antiretroviral therapy (ART) in sub-Saharan Africa has been published, long-term retention of patients in treatment programs has received comparatively less attention. ART has clearly been shown to be effective in reducing mortality among those who remain in treatment and adhere to therapy (Egger et al. 2002; Coetzee et al. 2004; Ivers et al. 2005; Laurent et al. 2005; Lawn et al. 2005), but under programmatic conditions, not all patients remain in treatment. In addition to known mortality while in care, some proportion of patients drop out of treatment programs and do not restart care elsewhere (Brinkhof et al. 2009; Fox et al. 2010). These patients are at high risk of morbidity and death within a short time. A valid measure for assessing the long-term success of ART programs should thus incorporate both mortality and loss to follow-up. In recent years, this measure has often been reported as the rate of retention, or the proportion of patients remaining alive and on ART at various time points after treatment initiation.
In 2007 we published the first systematic review of retention rates in cohorts in non-research settings in sub-Saharan Africa. In that review we demonstrated that, among over 74 000 patients representing 13 countries, the proportion of patients alive and on ART 2 years after initiation was approximately 60% (Rosen et al. 2007). The findings raised concern about high rates of attrition under programmatic conditions and suggested that more attention was needed to maintaining high rates of patient retention in both the months immediately following initiation when mortality is known to be high (Lawn et al. 2008), as well as over the whole course of patients’ lives.
Since 2007, a number of publications have reported retention experience in cohorts not included in the earlier systematic review or reported on a longer duration of follow-up of cohorts previously included. In this paper, we present an updated systematic review of information published between mid-2007 and mid-2009. We reviewed recent data on retention and estimated the rate of all-cause adult patient attrition from ART programs implemented in service delivery settings in sub-Saharan Africa to determine whether rates of retention have changed since our initial estimates and to extend the previous estimates, which covered 24 months of follow-up, through 36 months.
Methods
To allow comparison between this review and the previous one, we maintained a similar methodology for this analysis as in our earlier review.
Search strategy
The current analysis included studies describing the results of observational cohort data from sub-Saharan Africa which reported on all adult HIV 1- infected patients who initiated first-line three drug combination ART, including those who discontinued treatment for any reason. We included cohorts from any facility, whether public, nongovernmental, or private, as long as they treated the general population using standard therapy. We excluded clinical trials and clinics serving specialized populations, such as workforces. To avoid double-counting, we excluded reports of pooled data where it appeared that there was substantial overlap with patients also included in single-cohort reports. We required information beginning at ART initiation and a minimum, mean, or median follow-up of 6 full months (26 weeks). In some cases the average follow-up was not clearly specified but it could either be calculated from information provided or determined that it must be greater than 6 months. In cases where a cohort reported >50% retention at the last time point reported to, but no median duration of follow-up, the last time point reported to was used as the median. Reports had to include all-cause attrition rates for at least one of 6, 12, 18, 24, or 36 months after ART initiation. Studies that did not report on these time points but did provide enough information to calculate one of these rates were also included. When possible, children and non-naïve patients were excluded.
To identify studies for the current analysis, we searched Ovid Medline 2007-week 2, August 2009, ISI Web of Knowledge 2007-August 26, 2009 and Cochrane Database of Systematic Reviews 2nd quarter 2009) and four conference abstract archives (Conference on Retroviruses and Opportunistic Infections 2008–2009 International AIDS Conference 2007–2009, HIV Implementers Meeting 2008–2009 and International Association of Physicians in AIDS Care 3rd Conference on Treatment Adherence). The search in Medline, ISI, and the Cochrane Database combined the terms ‘antiretroviral’ and ‘Africa’ with any one of the following: retention/attrition/adherence/mortality/loss to follow-up/efficacy/evaluation or the term ‘antiretroviral’ and ‘developing country’ with either ‘adherence’ or ‘mortality’. Conference abstracts were searched for any of the terms ‘attrition’‘retention’ or ‘lost to follow-up’ except for the IAPAC conference in which all abstracts were scanned.
SR identified the eligibility of all abstracts and journal articles that met our initial search terms and MF confirmed eligibility. For each study identified for inclusion we used a standard data extraction form to collect the relevant data. In cases where multiple reports described the same cohort, the one reporting to the longest time point or with the most complete information was used.
Definitions
We defined attrition from ART programs to include patients who died or were lost to follow-up. We defined retention to be the opposite of attrition (i.e. 1 – attrition). As reporting of patients who were still in care but had stopped taking ARVs was variable, we did not exclude these patients from the total retained in care. We accepted the varying definitions used in the reports for loss to follow-up and provide these definitions in Table 1. We excluded patients who were transferred to another facility from both the numerator and denominator of calculations of retention as we could not assess their outcomes.
Table 1.
Characteristics of reports, cohorts, and patients included in this review of attrition rates from ART Programs in sub-Saharan Africa
| Study Code | Reference | Country | Eligibility criteria (; = ‘or’)* | LTFU definition | Facilities (n) | Sector | Payment by patient required? | Dates of cohort observation | Cohort size (n) | Median age (years) | Female (%) | Median starting CD4 count (Cells/mm3) |
|---|---|---|---|---|---|---|---|---|---|---|---|---|
| Botswana 1 (Bisson et al. 2008) | Bisson 2008 | Botswana | CD4 < 200; OI | 30 days late for last scheduled appt | 1 | Public | No | Feb 2003 – Mar 2004 | 410 | 37† | 60 | 81 |
| Botswana 2 (Bussmann et al. 2008) | Bussman 2008 | Botswana | CD4 < 200; ADOI | Not reported | 1 | Public | No | Jan 2002 – Apr 2007 | 633 | 35 | 60 | 67 |
| Cameroon 1 (Sieleunou et al. 2009) | Sieleunou 2009 | Cameroon‡ | CD4 < 200; WHO 3 or 4 | >3 months late for last visit | 1 | NGO | Partial | Jul 2001 – Jun 2007 | 1,187 | 35 | 44 | 105 |
| Congo 1 (O’Brien et al. 2009) | O’Brien 2009 | Congo§ | ‘WHO recommendations’ (cites 2006 WHO guidelines) | Not reported | 2 | NGO | No | Mar 2005 – Dec 2007 | 222 | 37 | 69 | 104 |
| Cote d’Ivoire1 (Toure et al. 2008) | Toure 2008 | Cote d’Ivoire | CD4 < 200; WHO 4; WHO 3 + CD4 200–350 | >3 months since last contact with clinic | Multiple | NGO | Partial | May 2004 – Feb 2007 | 10,211 | 36 | 70 | 123 |
| DRC 1 (Culbert et al. 2007) | Culbert 2007 | DRC Congo | ‘WHO guidelines’ (cites 2003 guidelines) | Not reported | 2 | NGO | No | Oct 2003 – Jan 2006¶ | 494 | 37 | 66 | 123 |
| Ethiopia 1 (Gugsa 2008) | Gugsa 2008 | Ethiopia | Not reported | Not reported | 1 | Public | – | Sep 2005 – Sep 2006¶ | 321 | – | 59 | 102** |
| Ghana 1 (Chiliade 2008) | Chiliade 2008 | Ghana | Not reported | Not reported | Multiple | NGO | – | – | 5,844 | – | 63 | 114 |
| Ghana 2 (Collini et al. 2009) | Collini 2009 | Ghana‡ | CD4 < 250; WHO 3 or 4 | Not reported | 1 | Public | Partial | Jan 2004 – | 237 | 40 † | 59 | 120† |
| Kenya 1 (Unge et al. 2009) | Unge 2009 | Kenya‡ | WHO stage (not specified) | > 90 days after last prescribed dose | 1 | NGO | Free | Jan 2005 – Sep 2007¶ | 830 | 35 | 65 | 203 |
| Malawi 1 (Jahn 2008) | Jahn 2008 | Malawi†† | Not reported | Not reported | 146 | Public | – | Jun 2004 – Jul 2007¶ | 114,375 | – | 61 | – |
| Mozambique 1 (Auld 2009) | Auld 2009 | Mozambique‡‡ | Not reported | Not reported | 30 | Public | – | 2004 – 2007¶ | 2,596 | 34 | 62 | – |
| Multiple 1 (Marazzi et al. 2008) | Marazzi 2008 | Mozambique, Tanzania, Malawi | CD4 < 200 + WHO 3 or 4; CD4 200–350 + viral load >55,000 | Not reported | 12 | NGO | – | Jan 2003 – Jun 2006 | 3,456 | 37 | 60 | 166† |
| Multiple 2 (Palombi et al. 2009) | Palombi 2009 | Mozambique, Malawi, Guinea‡ | Not reported | >3 months since last contact | 5 | NGO | – | –Jun 2007 | 3,749 | 34 | 62 | 192 |
| Nigeria 1 (DeSilva et al. 2009) | DeSilva 2009 | Nigeria | Not reported | No visit for > 3 months before data collection | 1 | NGO | – | Jan 2005 – Dec 2006 | 1,552 | 34 | 71 | 112 |
| Rwanda 1 (Chiliade 2008) | Chiliade 2008 | Rwanda | Not reported | Not reported | Multiple | NGO | – | – | 1,707 | – | 64 | 150 |
| Rwanda 2 (Lowrance et al. 2009) | Lowrance 2009 | Rwanda‡‡ | WHO 4; WHO 3 + CD4 < 350; WHO 1 or 2 + CD4 < 200 | >90 days since last contact | 30 | Public | – | Jan 2004 – Dec 2005 | 3,194 | 37 | 65 | 141 |
| SA 1 (Boulle et al. 2008) | Boulle 2008 | South Africa | WHO 4 excluding EPTB; CD4 < 200 | >90 days since last contact | Multiple | Public | – | May 2001 – Mar 2006 | 12,587 | – | 70 | – |
| SA 2 (Barth et al. 2009) | Barth 2008 | South Africa | Not reported | Not reported | 1 | NGO | – | – | 735 | 34 | 72 | 68 |
| SA 3 (Dahab 2008) | Dahab 2008 | South Africa | Not reported | >1 month late for six–month visit | 1 | Public | No | – | 267 | 37 | 67 | – |
| SA 4a (Grimwood A 2008) | Grimwood 2008 | South Africa | Not reported | Not reported | – | Public | No | Jan 2003 – Dec 2007¶ | 6,469 | – | – | 117 |
| SA 4b (Grimwood A 2008) | Grimwood 2008 | South Africa | Not reported | Not reported | – | Public | No | Jan 2003 – Dec 2007¶ | 1,135 | – | – | 127 |
| SA 5 (Khan 2009) | Khan 2009 | South Africa§§ | Not reported | ‘Failure to collect ARV’ | 1 | Public | – | Jul 2004 – Jun 2005¶ | 684 | – | 73 | – |
| SA 6 (Kaplan et al. 2008) | Kaplan 2008 | South Africa¶¶ | Not reported | No clinic visit > 12 weeks | 1 | Public | No | Sep 2002 – Sep 2007¶ | 1,677 | – | 100 | – |
| SA 7 (MacPherson et al. 2009) | MacPherson 2009 | South Africa | CD4 < 200 + WHO 4 + ‘psychosocial preparedness to undertake therapy’ | >1 day late for appointment, could not be traced, and did not come back during study period | 1 | Public | No | Oct 2005 – Sept 2007¶ | 1,353 | 37 | 67 | 93 |
| SA 8 (Nachega et al. 2008) | Nachega 2008 | South Africa*** | Two CD4s<350; confirmed ADOI | Leaving medical insurance fund or AID for AIDS program | Multiple | Private | Yes | Jan 1998 – Sep 2004¶ | 2,817 | 37† | 63 | 147 |
| SA 9 (Ojikutu et al. 2008) | Ojikutu 2008 | South Africa††† | CD4 < 200; WHO 4 | No clinic visit within 6 months of end of study | 1 | NGO | Yes | Jan 1999 – Feb 2004¶ | 309 | 38† | 56 | 65 |
| SA 10a (Rosen et al. 2008) | Rosen 2008 | South Africa | CD4 < 200 | >3 months late for last visit | 1 | Public | Partial | Jan 2005 – Dec 2006 | 100 | – | – | 97‡‡‡ |
| SA 10b (Rosen et al. 2008) | Rosen 2008 | South Africa | CD4 < 200 | >3 months late for last visit | 1 | Private | No | Jan 2005 – Dec 2006 | 100 | – | – | 84‡‡‡ |
| SA 10c (Rosen et al. 2008) | Rosen 2008 | South Africa | CD4 < 200 | >3 months late for last visit | 1 | NGO | Partial | Jan 2005 – Dec 2006 | 100 | – | – | 60‡‡‡ |
| SA 10d (Rosen et al. 2008) | Rosen 2008 | South Africa | CD4 < 200 | >3 months late for last visit | 1 | NGO | Partial | Jan 2005 – Dec 2006 | 100 | – | – | 104‡‡‡ |
| Tanzania 1 (Chalamilla 2008) | Chalamilla 2008 | Tanzania | Not reported | Not reported | – | – | – | Nov 2004 – Apr 2007¶ | 6,893 | 37 | 71 | 133 |
| Tanzania 2 (Johannessen et al. 2008) | Johannessen 2008 | Tanzania | CD4 < 200; WHO 4; WHO 3 + CD4 200–350 | >3 months late for last appt and could not be traced | 1 | NGO | No | Oct 2003 – May 2007 | 320 | 35 | 70 | – |
| Uganda 1a (Ahoua et al. 2009) | Ahoua 2009 | Uganda | WHO guidelines (cites 2003 guidelines) | >2 months late for last appt | 1 | Public | No | Sept 2004 – May 2006 | 967 | 37 | 65 | 100 |
| Uganda 1b (Ahoua et al. 2009) | Ahoua 2009 | Uganda | WHO guidelines (cites 2003 guidelines) | >2 months late for last appt | 1 | Public | No | Sept 2003 – May 2006 | 556 | 37 | 62 | 93 |
| Uganda 2 (Chang et al. 2009) | Chang 2009 | Uganda | CD4 < 250; WHO 3 or 4 | >90 days since last visit and on ART | 1 | NGO | No | Oct 2003 – Apr 2006 | 360 | 38§§§ | 66§§§ | 100§§§ |
| Uganda 3 (Bajunirwe et al. 2007) | Bajunirwe 2007 | Uganda | Not reported | Not reported | 1 | Public | – | Dec 2004 – Dec 2006¶ | 398 | – | – | – |
| Uganda 4 (Martin 2008) | Martin 2008 | Uganda | Not reported | ‘Where abouts unknown for 6 months or more’ | 1 | – | No | – | 323 | 35 | 71 | 124 |
| Zambia 1 (Chi et al. 2009) | Chi 2009 | Zambia | CD4 < 200; WHO 4; WHO 3 + CD4 200–350 | >30 days late for last medication pickup and can not be traced | 18 | Public | No | Apr 2004 – Nov 2008 | 37,039 | 35¶¶¶ | 61¶¶¶ | 126¶¶¶ |
| Total or weighted average | 226,307**** | 36†††† | 63†††† | 128†††† |
“—” indicates information not reported in study.
NGO, nongovernmental organization, ADOI, AIDS defining opportunistic infection, EPTB, extra-pulmonary tuberculosis.
Many public sector ART programs that did not report eligibility criteria likely followed national guidelines, which are typically consistent with WHO recommendations.
Median not reported, mean reported instead.
Required at least one follow-up visit.
Includes non-naïve patients.
Period during which study participants initiated ART; follow-up extends beyond dates shown.
Weighted the medians for those lost, died or retained by sample size.
Sampled entire national program (adults).
Representative sample of the national program.
Includes 75 children.
Rate from KM estimates only. Weighted average of pregnant and non-pregnant subjects.
Study compared EFV and NVP; rates shown are for combined cohort.
Includes non-naïve patients. Patients with missing records excluded.
Weighted average of outcome groups.
Weighted averages of those on treatment and those not on treatment.
Weighted averages of those on treatment at 12 months and those not.
Total.
Weighted by sample size.
Statistical methods
We first described each cohort and summarized its demographic and clinical characteristics by weighting the reported values by the sample size. We plotted the reported crude retention rates from each study at up to five time points: 6, 12, 18, 24 and 36 months. When retention rates were reported at time points different from those listed above or only for the median duration of follow-up, we applied the reported rates to the time point to which they were closest. For each study we calculated simple retention proportions (%RT) at each time point t as:
where I0 is all patients initiated on ART at the site; Tt is all patients transferred out of care by time t; Dt is all patients who died by time t; and LTFUt is all patients lost to follow-up by time t. This is the proportion of all patients initiated who did not transfer out of care who are still alive and in care at the end of the follow-up period.
In cases where the first time point for which a study reported retention rates was later than 6 months after treatment initiation (25 studies representing 42 observations) we imputed the earlier missing time points. Because rates of attrition are unlikely to be constant over time (i.e. a linear decline), but rather likely to show a sharp decline over the first 6-months in care and level out sometime after 1 year, we first fit a linear random-effects regression model using all the data available on current retention as a function of time, time squared, and time cubed with a random intercept for each study. The cubic form had a better fit than linear, quadratic, or half root forms. We then took the resulting predicted curve and calculated the proportion of the total 36-month attrition that was expected to have occurred by each time period, with the constraint that retention could not increase over time. In this model, of total retention by 36 months, cumulatively 56% occurred by 6 months, 83% occurred by 12 months, 91% occurred by 18 months, 96% occurred by 24 months and 100% occurred by 36 months. This information was used to calculate the % retention at earlier missing time points as:
where %RTi is the missing retention rate at month ti, 100% and %RT1 are the two reported retention rates at baseline and time t1 that bound %RTi (i.e. 0 < ti < t1), and %TATi is the % of total attrition up to the first time period reported (i.e. %RT1) that occurred by time ti. For example, if the first retention proportion reported was 80% at 12 months, the percent of total attrition up to 12 months that occurred by 6 months would be:
meaning that 67.5% of the total 20% attrition by 12 months occurred by 6-months. We would then estimate the 6- month retention proportion to be:
For all time periods after the first reported retention proportion, if at least two non-consecutive time points of interest were reported but the study did not give retention proportions at one or more of the time points in between, we interpolated proportions (%RTi) for the missing time points as a linear decline:
where %RTi is the interpolated retention proportion at month ti and %RT1 and %RT2 are the two reported retention proportions at months t1 and t2 that bound %RTi (i.e. t1 < ti < t2). This was carried out for seven of the studies representing eight imputations.
As we previously demonstrated a relationship between duration of follow-up and reported retention rates (Rosen et al. 2007) (e.g. studies reporting only 6 months of follow-up on average reported lower retention at 6 months than the reported 6 month retention in studies reporting to 12 or 24 months), we first described retention rates in the current dataset by plotting them over time grouped by duration of reporting. We display retention rates at 6, 12, 24 and 36 months using forest plots to allow for visualization of the distribution of retention rates at each time point. We then summarized these rates using random-effects meta-analysis (Egger et al. 2001) using a Freeman & Tukey (1950) arc-sin transformation of the retention proportions and standard errors and presented point estimates of retention and corresponding 95% confidence intervals.
To explore the impact of duration of reporting on overall retention, we projected the path of retention rates by extrapolating retention rates through 3 years (36 months) for all studies from their time of last reporting using three methods. We calculated a best-case scenario using last observation carried forward from the last time point reported through 3 years. We calculated a worst-case scenario by assuming that the attrition rates continued along the linear slope calculated between the first and last time point reported, with retention truncated at 0%. We calculated a midpoint scenario as the average of the two. In all scenarios, results were weighted by cohort size.
Finally, we looked for predictors of retention using linear regression. Potential predictors included median age in years (<36 vs.≥36), % female (<60%vs.≥60%), median baseline CD4 count (<100 vs.≥100), duration of follow-up (≤12 months vs. >12 months), patient payment required (yes vs. no), sector (public/private/other), and year of initiation of the cohort (<2004 vs.≥2004). Because we had only 39 observations, all missing data were coded as unknown and included in regression analyses, but inferences were only drawn comparing the groups for which we had data.
Two other potential, program-level predictors of retention are whether or not the treatment provider undertook active tracing of patients who were lost and made attempts to return them to care and how much pre-ART counseling was given to prepare patients for initiating and maintaining ART. Practices for preparing patients for ART and tracing those lost to follow up were not consistently reported, however, and therefore could not be included in the current analysis.
Results
Our search identified 632 papers and abstracts after removing duplicates. Of these, 491 were excluded on the basis of title or abstract, and an additional 108 were excluded after a full text screen and removal of overlapping cohorts and reports that contained insufficient information. Thirty-three sources remained that met our eligibility criteria (Figure 1), including 22 full text journal articles and 11 abstracts. These described outcomes for a total of 39 cohorts and 226 307 patients.
Figure 1.
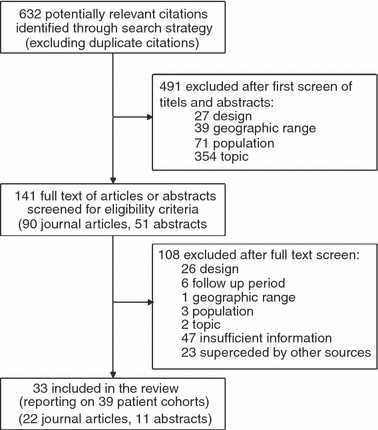
Literature Search and Application of Eligibility Criteria in a Systematic Review of Retention in Antiretroviral Therapy Programs in Sub-Saharan Africa.
Several exclusions from the review and censoring of data should be noted. First, we omitted reports from the International epidemiological Databases to Evaluate AIDS (IeDEA) group that pools data from HIV/AIDS treatment programs. We excluded these reports because many of the cohorts included in IeDEA’s analyses are described in more detail in the individual papers and abstracts in our review. Second, two studies, SA 1 and SA 2, reported outcomes to 48 months, and two studies, Botswana 2 and Cameroon 1, reported outcomes to 60 months. As these were the only cohorts reporting to time periods beyond 36 months, we censored data from these cohorts at the last time period reported to before 60 months (12 months for Cameroon 1 and 36 months for the remaining 3). And finally, we excluded several publications reporting data for cohorts from Malawi because the most recent report for Malawi, a conference abstract from July 2009 (Malawi 1), included data for the entire Malawian national ART program, thus encompassing the cohorts described in the other papers.
Table 1 describes the characteristics of the cohorts. Nearly half the cohorts (49%, 19/39), representing 81% of the patients (183,486/226,307), were in southern Africa. The majority of treatment sites were either public sector (53%) or NGO (41%) facilities. About 35% of the 25 cohorts that provided information on payment reported that patients had to pay to receive care. The median years in which cohorts were enrolled for observation and in which observation ended were 2004 (range 1998–2005) and 2006 (range 2002–2007).
Table 1 also reports median patient characteristics for each cohort. Patients were more likely to be female (median 65%, range 44%–100%) and had a median age at initiation of ART of 37 (range 34–40). All cohorts that reported starting CD4 count except one (Kenya 1) had a median below 200 cells/mm3 (median 113, range 60–203). For the studies that reported it, the median of the reported follow-up times was 12 months.
The proportion of patients lost from each cohort at the end of that cohort’s follow-up stratified by the cause of attrition, as well as the total proportion retained at each site, is shown in Table 2. After weighting for cohort size, loss to follow-up (LTFU) was the most common cause of attrition, followed by death (59% and 41% of total attrition respectively).
Table 2.
Rates of Patient Attrition and Retention from Antiretroviral Treatment Programs in Sub-Saharan Africa, as reported
| Study Code | Median follow-up (months) | Died (A) | Lost to follow-up (B) | Total attrition from ART (C)* | Total retained (D)* | Transferred care (E) | Total retained at original site (F)* |
|---|---|---|---|---|---|---|---|
| Botswana 1† | 10.1 | 16.8% | 5.4% | 22.2% | 77.8% | 0.0% | 77.8% |
| Botswana 2 | 41.9 | 19.0% | 16.1% | 35.1% | 64.9% | 19.1% | 45.8% |
| Cameroon 1 | 49.0 | 28.5% | 5.0% | 33.4% | 66.6% | 18.5% | 48.0% |
| Congo 1 | 9.0¶ | 9.0% | 13.1% | 22.1% | 77.9% | 0.0% | 77.9% |
| Cote d’Ivoire 1 | 7.7 | 11.2% | 13.6% | 24.7% | 75.3% | 3.0% | 72.3% |
| DRC 1 | 6.0‡ | 7.9% | 5.5% | 13.4% | 86.6% | 0.0% | 86.6% |
| Ethiopia 1 | 6.0‡ | 18.4% | 8.1% | 26.5% | 73.5% | 1.3% | 72.2% |
| Ghana 1 | 24.0‡ | – | – | – | – | – | – |
| Ghana 2 | 36.0‡ | 0.0% | 30.8% | 30.8% | 69.2% | 3.4% | 65.8% |
| Kenya 1 | 15.2§ | 0.0% | 29.4% | 29.4% | 70.6% | 0.0% | 70.6% |
| Malawi 1 | 36.0‡ | – | – | – | – | – | – |
| Mozambique 1 | 12.0‡ | 5.0% | 15.0% | 20.0% | 80.0% | 0.0% | 80.0% |
| Multiple 1 | 12.0 | 7.5% | 1.2% | 8.7% | 91.3% | 0.0% | 91.3% |
| Multiple 2 | 14.5¶ | 10.5% | 2.8% | 13.3% | 86.7% | 0.0% | 86.7% |
| Nigeria 1 | 14.6¶ | 6.7% | 8.8% | 15.5% | 84.5% | 0.0% | 84.5% |
| Rwanda 1 | 24.0‡ | – | – | – | – | – | – |
| Rwanda 2 | 14.9¶ | 4.3% | 4.5% | 8.8% | 91.2% | 4.0% | 87.2% |
| SA 1 | –** | – | – | – | – | – | – |
| SA 2 | 37.0¶ | 23.3% | 12.0% | 35.2% | 64.8% | 6.4% | 58.4% |
| SA 3 | 6.0‡ | 6.7% | 8.6% | 15.4% | 84.6% | 1.1% | 83.5% |
| SA 4a | 24.0‡ | 9.0% | 11.4% | 20.4% | 79.6% | 0.0% | 79.6% |
| SA 4b | 36.0‡ | 6.0% | 7.0% | 13.0% | 87.0% | 0.0% | 87.0% |
| SA 5 | 36.0‡ | 18.0% | 5.3% | 23.2% | 76.8% | 3.9% | 72.8% |
| SA 6 | –** | – | – | – | – | – | – |
| SA 7 | 8.6¶ | 9.2% | 2.6% | 11.8% | 88.2% | 4.7% | 83.6% |
| SA 8 | 24.0 | 2.0% | 11.2% | 13.2% | 86.8% | 0.0% | 86.8% |
| SA 9 | 8.4¶ | 15.9% | 7.4% | 23.3% | 76.7% | 0.0% | 76.7% |
| SA 10a | 12.0 | 2.1% | 23.9% | 26.0% | 74.0% | 0.0% | 74.0% |
| SA 10b | 12.0 | 18.9% | 26.1% | 45.0% | 55.0% | 0.0% | 55.0% |
| SA 10c | 12.0 | 12.9% | 15.1% | 28.0% | 72.0% | 0.0% | 72.0% |
| SA 10d | 12.0 | 7.0% | 6.0% | 13.0% | 87.0% | 0.0% | 87.0% |
| Tanzania 1 | 7.9¶ | 2.5% | 12.1% | 14.6% | 85.4% | 0.0% | 85.4% |
| Tanzania 2 | 10.9 | 29.7% | 9.7% | 39.4% | 60.6% | 10.9% | 49.7% |
| Uganda 1a | 12.0‡ | 5.0% | 19.3% | 24.3% | 75.7% | 0.0% | 75.7% |
| Uganda 1b | 24.0‡ | 14.7% | 17.1% | 31.8% | 68.2% | 0.0% | 68.2% |
| Uganda 2 | 24.0‡ | 18.3% | 7.8% | 26.1% | 73.9% | 0.6% | 73.3% |
| Uganda 3 | –** | – | – | – | – | – | – |
| Uganda 4 | 8.3 | 5.0%†† | 4.0% | 9.0% | 91.0% | 0.0% | 91.0% |
| Zambia 1 | 12.0‡ | 9.9% | 16.9% | 26.8% | 73.2% | 0.0% | 73.2% |
| Simple averages | 18.3 | 10.9% | 11.6% | 22.5% | 77.5% | 2.3% | 75.1% |
| Weighted averages‡‡ | 26.3 | 9.1% | 13.0% | 22.1% | 77.9% | 1.1% | 76.8% |
“—” indicates that these data could not be determined from the report.
Calculations: C = A+B; D = 1 – C; F = D–E.
Rates are based on results after active tracing of patients.
Median not reported but estimated as last time period reported to as >50% of cohort was still retained.
Median not reported; weighted mean for those lost and those retained by sample size.
Median not reported; table shows mean follow-up instead.
Not reported but > 6 months.
Estimated from KM curve.
Weighted by cohort size.
Total retention rates at each time point reported are presented in Table 3. For the 39 cohorts, attrition rates were reported at only one time point for 24 (61%); the median time point for these cohorts was 18 months (IQR 12–24 months). Total attrition at 12 months was quite variable, with a median of 22.6% and a range from 7 to 45% (Rwanda 1 and SA 10b respectively). There was little change in median attrition (27%) by 24 months, but the range narrowed slightly, from 11% to 35% in Rwanda 1 and Kenya 1 respectively. By 36 months median attrition increased to 29.6%, with estimates ranging from 13.0% to 36.1% (in SA 4b and Botswana 2 respectively).
Table 3.
Retention of Patients at 6, 12, 18, 24 and 36 months after initiation of antiretroviral therapy in sub-Saharan Africa
| Percentage of patients retained at month | ||||||
|---|---|---|---|---|---|---|
| Study code | 6 | 12 | 18 | 24 | 36 | Notes |
| Botswana 1 | – | 77.8% | – | – | – | 12 month value is at a median of 10.1 months |
| Botswana 2 | – | 73.8% | – | – | 63.9% | Values estimated from KM estimates of LTFU and death |
| Cameroon 1 | – | 65.0% | – | – | – | Values estimated from KM curves counting LTFU as an event |
| Congo 1 | 94.0% | 89.0% | – | – | – | Survival reported as combined LTFU and death |
| Cote d’Ivoire 1 | – | – | 64.0% | – | – | 18 month estimate of death and LTFU summed |
| DRC 1 | – | 86.7% | – | – | – | |
| Ethiopia 1 | 72.3% | – | – | – | – | |
| Ghana 1 | 87.0% | 81.0% | 77.0% | 68.0% | – | |
| Ghana 2 | – | 82.5% | 74.7% | – | 68.1% | Estimated based on number of patients reporting for follow-up visits; no deaths reported |
| Kenya 1 | 83.0% | 74.0% | – | 65.0% | – | Estimated using survival analysis. No deaths reported |
| Malawi 1 | – | 77.0% | – | 70.0% | 68.0% | Includes stopping ART as attrition |
| Mozambique 1 | 86.0% | 79.0% | – | – | – | |
| Multiple 1 | – | 91.3% | – | – | – | Attributed total death and LTFU to 12 months |
| Multiple 2 | – | – | 86.7% | – | – | 18 months value based on mean 15 months follow-up |
| Nigeria 1 | – | – | 84.5% | – | – | 18 months value based on mean 15 months follow-up |
| Rwanda 1 | 94.0% | 93.0% | 91.0% | 89.0% | – | |
| Rwanda 2 | 93.0% | 91.0% | – | – | – | Excluded transfers and stopping ART from reported attrition |
| SA 1 | 89.1% | 84.9% | 81.3% | 80.9% | 77.0% | Estimates are from nested cohorts |
| SA 2 | 76.0% | 71.0% | 70.0% | 68.0% | 64.0% | Estimated from KM curves; includes patients transferred as attrition |
| SA 3 | 83.5% | – | – | – | – | |
| SA 4a | – | – | – | 79.6% | – | |
| SA 4b | – | – | – | – | 87.0% | |
| SA 5 | 87.4% | 84.1% | – | 77.6% | 72.8% | Includes patients transferred as attrition |
| SA 6 | – | – | – | – | 74.3% | Rate from KM estimates. Weighted average of pregnant and non-pregnant subjects. |
| SA 7 | – | – | – | 83.6% | – | |
| SA 8 | – | – | – | 86.8% | – | Study compared EFV and NVP; rates shown are for combined cohort. |
| SA 9 | 76.7% | – | – | – | – | 6 month estimate at 8 months |
| SA 10a | – | 74.0% | – | – | – | |
| SA 10b | – | 55.0% | – | – | – | |
| SA 10c | – | 72.0% | – | – | – | |
| SA 10d | – | 87.0% | – | – | – | |
| Tanzania 1 | – | 85.4% | – | – | – | |
| Tanzania 2 | – | 60.6% | – | – | – | 12 month estimate at 11 months |
| Uganda 1a | – | 75.7% | – | – | – | Data are from retrospective cohort analysis; excluded transfers and stopping ART from reported attrition |
| Uganda 1b | – | – | – | 68.2% | – | Data is from retrospective cohort analysis; excluded transfers and stopping ART from reported attrition |
| Uganda 2 | 85.0% | 77.0% | – | 73.0% | – | Includes those who stopped treatment |
| Uganda 3 | – | 76.0% | – | 71.0% | – | |
| Uganda 4 | 91.0% | – | – | – | – | 6 month estimate at 8.3 months |
| Zambia 1 | – | 73.2% | – | – | – | |
| Simple averages | 85.6% | 78.3% | 78.6% | 75.4% | 71.9% | |
KM, Kaplan-Meier.
To account for the variable times reported to, in all analyses presented below we interpolated retention rates at any time point where an estimate of retention was missing but a later time point was reported. Fifty estimates of attrition were interpolated, most at 6, 12, or 18 months (n = 25, 9, and 11, respectively).
Figure 2a–d show the variation in retention rates at 6, 12, 24 and 36 months using forest plots. Using random effects meta-analysis to pool the data including the interpolated time points, we estimated the retention at 6 months to be 86.1% (95% CI: 84.6%–87.4%), at 12 months to be 80.2% (95% CI: 78.0%–82.4%), at 24 months to be 76.1% (95% CI: 72.4%–79.7%) and at 36 months to be 72.3% (95% CI: 67.4%–76.9%).
Figure 2.
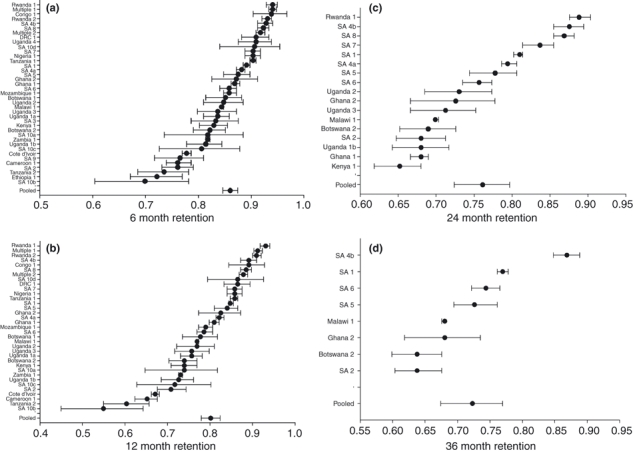
a–d Forest Plots of Reported Retention at 6, 12, 24 and 36 Months after Initiation of Antiretroviral Therapy in Sub-Saharan Africa*. *Pooled estimates were created using random-effects meta-analysis. Data include both actual reported rates for studies that reported to each time point and linear interpolation for studies which reported to a later time point but not the current time point.
We were concerned that studies reporting only to shorter time points would have higher attrition at those time points than would studies that reported longer follow-up. Figure 3 shows retention rates stratified by last reported time point. Each time point shows variation in retention rates, but there is no clear picture of studies reporting at later time points having higher overall retention at earlier time points compared to studies reporting only to earlier time points. While the cohorts reporting only to 6 and 12 months show lower attrition with duration of time reported to, suggesting some bias may exist, the 8 cohorts reporting to 36 months show sharper declines in the first 6–12 months than cohorts reporting to 24 months.
Figure 3.
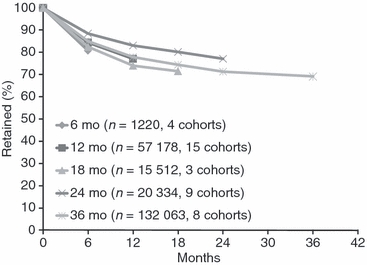
Weighted Average Retention Rates Over Time in Antiretroviral Therapy Programs in Sub-Saharan Africa*. *Studies reporting later time points and not earlier ones had the earlier attrition rates interpolated as described in the methods section and then weighted by cohort size.
Using linear regression we found that median starting CD4 count <100 (−5.8%; 95% CI: −8.9% to −2.7%), median age <36 (5.7%; 95% CI: −9.2% to −2.2%), and having <60% females (−9.4%; 95% CI: −13.9% to −4.9%) were predictive of lower retention rates at 6 months when also adjusting for median follow-up and year of initiating cohort. For 12 month attrition rates, only median age <36 (−12.8%; 95% CI: −19.9% to −5.6%), median CD4 < 100 (−8.8%; 95% CI: −14.5% to −3.1%) and cohort follow-up ≤12 months (−8.6%; 95% CI: −16.9% to −0.4%) were predictive of lower retention rates. The finding that median cohort follow-up of ≤12 months is associated with lower 12 month retention rates again suggests that while we did not observe a strong trend towards studies with longer duration reporting higher retention rates at comparable time points, some bias may exist.
To project the potential paths of retention over time, we conducted three analyses to extrapolate what would have happened to retention rates at later time points for cohorts reporting only to earlier time points (Figure 4). The first set of bars shows the best case scenario, in which the latest observation is carried forward with no further attrition, while the last set of bars shows a worst case scenario which assumes that retention continued at a linear rate. There was little variation in the estimates through 24 months as the retention midpoint between the two cases is 70.0% (best-case–worst-case range: 66.7%–73.3%). By 36 months, the retention midpoint between the two cases is 64.8% (best case-worst case range: 57.5%–72.1%).
Figure 4.
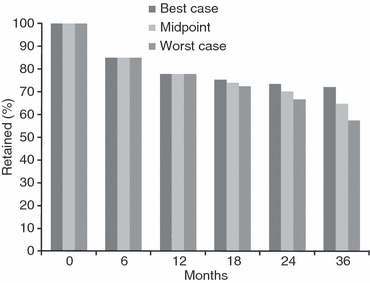
Projected Retention Rates Over Time in Antiretroviral Therapy Programs in Sub-Saharan Africa Using Varying Assumptions*. *Best-case scenario uses last observation carried forward and assumes no additional attrition after the last time point reported to. Worst-case scenario assumes a continued linear decline from the last time point reported to through 36 months. The mid-point scenario is the average of the best and worst-case scenarios. Studies are weighted by their sample size.
Discussion
The global response to scaling up access to antiretroviral therapy in resource-limited settings has been rapid and dramatic and represents one of the largest public health successes in history. By the end of 2008, more than 4 million HIV infected patients had been initiated on life saving ART (Souteyrand et al. 2009). Even before the global economic crisis, however, the very large number of patients seeking treatment had begun to stretch resources and budgets. Now, as donors and governments face new pressure to reduce spending, difficult choices may have to be made about whether to use limited funds to initiate new patients on ART or to target funds towards keeping those already on ART alive and in care.
Our findings document both the difficulties in retaining patients in care for lifelong treatment, but also the progress being made in raising overall retention rates. Our analysis of data from more than 22 500 patients initiated on ART in sub-Saharan Africa shows that in the period since our previous analysis, overall retention in ART programs 3 years after initiating patients on treatment averaged roughly 70% using a random effects meta-analysis of reported results. This finding, while not ideal, is notable in that most of the attrition occurred in the first 2 years on treatment, when both mortality (Lawn et al. 2008) and loss to follow-up are known to be high. After the first 24 months, attrition averaged about 5% per year.
The retention rate at 24 months we estimated in this analysis, 76% using meta-analysis, was higher than that estimated in our earlier review, which only analysed studies through 2 years. In that analysis we estimated 62% retention by 2 years. That analysis did not use a meta-analysis approach as was performed here but instead used a weighted average approach. This suggests that overall attrition by 2 years may be slowing as experience of scaling up ART accumulates and treatment programs mature and are better able to track patients. The greater attention to measuring and understanding loss to follow-up that is reflected in the large number of publications on this topic in recent years may be paying off as programs invest in interventions to track missing patients and return them to care.
We found substantial variation in retention rates reported over time but few predictors of overall retention that explain these differences and provide guidance on what determines attrition rates. While we were only able to estimate predictors of attrition in the first year after treatment initiation, we found that low median CD4 count and having fewer females as part of the cohort were predictive of higher attrition. Programmes with low median CD4 count would be expected to have more overall attrition because of mortality. As ART programmes expand, initiating patients with higher CD4 counts could lead to both improved outcomes on treatment as well as less overall attrition. Indeed, while our current analysis showed a very similar median initiating CD4 count to our previous analysis (128 in the current analysis vs. 132 in the previous analysis), others have found an increasing starting CD4 count over time (Keiser et al. 2008). Our analysis suggests that any such increases in baseline CD4 count may also be associated with increases in retention.
Loss to follow-up constituted the highest contributor to overall attrition, as was the case in our previous report. As the number of facilities offering ART expands, more of the patients reported as lost to follow-up may in fact have transferred informally to another facility. In our analysis, among studies which reported any transfers, about 7% of all patients who initiated care transferred to another facility. While most countries find it difficult to track patients from one facility to another, developing reliable referral systems that document transfers is essential to evaluating overall programmatic effectiveness.
For those patients who are lost but do not seek care elsewhere, mortality is expected to be high (Mocroft et al. 1997; Morgan et al. 2002; Badri et al. 2006). Brinkhof et al. (2009) conducted a systematic review of outcomes among patients lost from treatment programmes and estimated that about 40% (95% CI: 33%–48%) of LTFU patients had died, with much of the mortality occurring in the first 6 months after being lost to follow-up. Making efforts to get these patients back into care is important to the overall success of ART programmes, and developing ways to track and locate lost patients is essential to proper programme evaluation (Bisson et al. 2007). To further evaluate programmes, when available, method such as cross referencing with vital registration systems (Anglaret et al. 2004; Fairall et al. 2008) or adjusting mortality estimates statistically (Geng et al. 2008; Yiannoutsos et al. 2008; Fox et al. 2010) should allow for better estimates of programme impact as well as appropriate targeting of resources towards patient retention.
Our findings should be interpreted in the light of several limitations. First, we used data collected and reported by ART programs. Some misclassification of treatment outcomes likely existed, although we have little reason to believe these misclassifications would be anything more than random. Second, we integrated information from studies that reported at many different time points, and not all reported at a time point we were interested in. In these cases we applied the retention rate to the nearest time point, but this may have caused some bias in our overall estimates. Third, we were not able to determine whether the definition of LTFU used in specific studies influenced overall retention rates because of the variability in definitions, which made it impossible in many cases to determine how long patients were absent from the clinic before being classified as lost.
Fourth, systematic reviews can be subject to publication bias. Programmes managing cohorts with higher attrition rates might be less interested in publishing their results, and this would likely lead to an underestimation of overall attrition. At the same time, better-resourced programs may be both better able to retain patients in care and to conduct and publish research, particularly long-term analyses requiring consistent data collection and strong data analysis capacity. Both of these phenomena would lead to the bias that we found in our previous analysis, in which cohorts with higher attrition rates are more likely to publish outcomes only at earlier time points. We saw some evidence for this in the current analysis, as the average 6-month retention rates were lowest for studies that only reported to 6 months compared to the average 6-month retention rates from cohorts also reporting to later time periods. Our sensitivity analysis shows that if cohorts reporting only to earlier time points had continued along at the same rate of attrition as they reported at those earlier points, overall retention would be as low as 67% at 24 months and as low as 58% by the end of 36 months. While this sensitivity analysis may overestimate attrition, even our midpoint scenario (averaging the best- and worst- case scenarios) showed that overall attrition by 36 months is likely underestimated when using only published information.
Finally, our data were not extracted in duplicate as is recommended by the Cochrane Collaboration. We instead used single data extraction. This could have resulted in some studies being missed that potentially could have met the inclusion criteria.
In conclusion, we found that overall attrition by 24 months has likely decreased slightly since our earlier report, with overall retention by 24 months averaging 70%–77% and overall retention by 36 months averaging 65%–72%. Programmes initiating patients at lower CD4 counts also had higher rates of attrition than those initiating patients with higher CD4 counts. Active tracing of lost patients to return them to care and determine their vital status if not returned should be prioritized so as to keep overall retention high and to appropriately evaluate treatment programmes.
Acknowledgments
Funding was provided by the United States Agency for International Development (USAID) under the terms of agreement 674-A-00-08-00007-00 with Right to Care (RTC), and by the Doris Duke Charitable Foundation through a grant to Boston University. The project was also supported by Award Number K01AI083097 from the National Institute of Allergy And Infectious Diseases. The content is solely the responsibility of the authors and does not necessarily represent the official views of the National Institute of Allergy and Infectious Diseases, the National Institutes of Health, USAID, or other parties.
Conflicts of interest
The authors have declared that they have no conflicts of interest.
References
- Ahoua L, Guenther G, Pinoges L, et al. Risk factors for virological failure and subtherapeutic antiretroviral drug concentrations in HIV-positive adults treated in rural northwestern Uganda. BMC Infectious Diseases. 2009;9:81. doi: 10.1186/1471-2334-9-81. [DOI] [PMC free article] [PubMed] [Google Scholar]
- Anglaret X, Toure S, Gourvellec G, et al. Impact of vital status investigation procedures on estimates of survival in cohorts of HIV-infected patients from Sub-Saharan Africa. Journal of Acquired Immune Deficiency Syndromes. 2004;35:320–323. doi: 10.1097/00126334-200403010-00015. [DOI] [PubMed] [Google Scholar]
- Auld AF. Treatment Outcomes of HIV-Infected Adults Enrolled in the National Antiretroviral Therapy Program -Mozambique, 2004-2007. Namibia: HIV/AIDS Implementers' Meeting Windhoek; 2009. (Abstract 1608) [Google Scholar]
- Badri M, Cleary S, Maartens G, et al. When to initiate highly active antiretroviral therapy in sub-Saharan Africa? A South African cost-effectiveness study. Antiviral Therapy. 2006;11:63–72. [PubMed] [Google Scholar]
- Bajunirwe F, Arts EJ, Tisch DJ, Debanne SM, Sethi AK. Survival, Adherence to Care and Antiretroviral Treatment (ART) Among HIV-Infected Adults in Rural Western Uganda. 2007. 4th IAS Conference on HIV Pathogenesis, Treatment and Prevention WEPEB049.
- Barth RE, Tempelman HA, Hoepelman AIM. Long-Term Follow Up of HIV-Infected Adults in Rural South Africa; Good Virological Results in Spite of Early Mortality. South Africa: IAS 2009 Cape Town; 2009. (Abstract CDB084) [Google Scholar]
- Bisson G, Ndwapi N, Rollins C, et al. High Rates of Death Among Patients Lost to Follow-Up in Botswana's National Art Program: Implications for Monitoring and Evaluation. Los Angeles: 14th Conference on Retroviruses and Opportunistic Infections (CROI); 2007. Abstract 537(no poster) [Google Scholar]
- Bisson GP, et al. Overestimates of survival after HAART: implications for global scale-up efforts. PLoS ONE. 2008;3:e1725. doi: 10.1371/journal.pone.0001725. [DOI] [PMC free article] [PubMed] [Google Scholar]
- Boulle A, Bock P, Osler M, et al. Antiretroviral therapy and early mortality in South Africa. Bulletin of the World Health Organization. 2008;86:678–687. doi: 10.2471/BLT.07.045294. [DOI] [PMC free article] [PubMed] [Google Scholar]
- Brinkhof MW, Pujades-Rodriguez M, Egger M. Mortality of patients lost to follow-up in antiretroviral treatment programmes in resource-limited settings: systematic review and meta-analysis. PLoS ONE. 2009;4:e5790. doi: 10.1371/journal.pone.0005790. [DOI] [PMC free article] [PubMed] [Google Scholar]
- Bussmann H, Wester CW, Ndwapi N, et al. Five-year outcomes of initial patients treated in Botswana’s National Antiretroviral Treatment Program. AIDS. 2008;22:2303–2311. doi: 10.1097/QAD.0b013e3283129db0. [DOI] [PMC free article] [PubMed] [Google Scholar]
- Chalamilla G. Predictors of Clinical and Immunological Outcomes among HIV-infected Subjects on ART in Tanzania. 2008. 15th Conference on Retroviruses and Opportunistic Infections Abstract 824.
- Chang LVW, Alamo S, Guma S, et al. Two-Year Virologic Outcomes of an Alternative AIDS Care Model: evaluation of a Peer Health Worker and Nurse-Staffed Community-Based Program in Uganda. Journal of Acquired Immune Deficiency Syndromes. 2009;50:276–282. doi: 10.1097/QAI.0b013e3181988375. [DOI] [PMC free article] [PubMed] [Google Scholar]
- Chi BH, Cantrell RA, Zulu I, et al. Adherence to first-line antiretroviral therapy affects non-virologic outcomes among patients on treatment for more than 12 months in Lusaka, Zambia. International Journal of Epidemiology. 2009;38:746–756. doi: 10.1093/ije/dyp004. [DOI] [PMC free article] [PubMed] [Google Scholar]
- Chiliade P. Long-term immunologic outcomes of patients started on antiretroviral therapy in 2 Sub-Saharan resource-limited countries. 2008. XVII International AIDS Conference CDB0233.
- Coetzee D, Hildebrand K, Boulle A, et al. Outcomes after two years of providing antiretroviral treatment in Khayelitsha, South Africa. AIDS. 2004;18:887–895. doi: 10.1097/00002030-200404090-00006. [DOI] [PubMed] [Google Scholar]
- Collini P, Schwab U, Sarfo S, et al. Sustained immunological responses to highly active antiretroviral therapy at 36 months in a Ghanaian HIV cohort. Clinical Infectious Diseases. 2009;48:988–991. doi: 10.1086/597353. [DOI] [PubMed] [Google Scholar]
- Culbert H, Tu D, O’Brien DP, et al. HIV treatment in a conflict setting: outcomes and experiences from Bukavu, Democratic Republic of the Congo. PLoS Medicine. 2007;4:e129. doi: 10.1371/journal.pmed.0040129. [DOI] [PMC free article] [PubMed] [Google Scholar]
- Dahab M. Off the radar screen: comparing reasons for treatment default in a workplace ART programme and a public sector clinic in South Africa. 2008. XVII International AIDS Conference THPE0123.
- DeSilva MB, Merry SP, Fischer PR, et al. Youth, unemployment, and male gender predict mortality in AIDS patients started on HAART in Nigeria. Aids Care-Psychological and Socio-Medical Aspects of Aids/HIV. 2009;21:70–77. doi: 10.1080/09540120802017636. [DOI] [PMC free article] [PubMed] [Google Scholar]
- Egger M, Davey Smith G, Altman DG. Systematic Reviews in Health Care: Meta-analysis in Context. 2nd edn. London: BMJ Books; 2001. [Google Scholar]
- Egger M, May M, Chene G, et al. Prognosis of HIV-1-infected patients starting highly active antiretroviral therapy: a collaborative analysis of prospective studies. Lancet. 2002;360:119–129. doi: 10.1016/s0140-6736(02)09411-4. [DOI] [PubMed] [Google Scholar]
- Fairall LR, Bachmann MO, Louwagie GM, et al. Effectiveness of antiretroviral treatment in a South African program: a cohort study. Archives of Internal Medicine. 2008;168:86–93. doi: 10.1001/archinternmed.2007.10. [DOI] [PubMed] [Google Scholar]
- Fox MP, Brennan A, Maskew M, et al. Using Vital Registration Data to Update Mortality among Patients Lost to Follow-up from ART Programs: Evidence from the Themba Lethu Clinic, South Africa. Tropical Medicine and International Health. 2010;15:405–413. doi: 10.1111/j.1365-3156.2010.02473.x. [DOI] [PMC free article] [PubMed] [Google Scholar]
- Freeman MF, Tukey JW. Transformations related to the angular and the square root. Annals of the Institute of Statistical Mathematics. 1950;21:607–611. [Google Scholar]
- Geng EH, Emenyonu N, Bwana MB, Glidden DV, Martin JN. Sampling-based approach to determining outcomes of patients lost to follow-up in antiretroviral therapy scale-up programs in Grimwood A (2008) 2008. Public-private partnership achieves long-term ARV adherence in South Africa. XVII International AIDS Conference CDB0221. [DOI] [PMC free article] [PubMed]
- Gugsa S. Determinants of retention and mortality during 6-month follow-up after initiation of HAART in an Ethiopian public HIV treatment program. 2008. XVII International AIDS Conference CDB0246.
- Ivers LC, Kendrick D, Doucette K. Efficacy of antiretroviral therapy programs in resource-poor settings: a meta-analysis of the published literature. Clinical Infectious Diseases. 2005;41:217–224. doi: 10.1086/431199. [DOI] [PubMed] [Google Scholar]
- Jahn A. Antiretroviral regimen substitutions and switches due to drug toxicity and treatment failure: a national survey three years after the start of antiretroviral therapy roll-out in Malawi. 2008. XVII International AIDS Conference MOPE0044.
- Johannessen A, Naman E, Ngowi BJ, et al. Predictors of mortality in HIV-infected patients starting antiretroviral therapy in a rural hospital in Tanzania. BMC Infectious Diseases. 2008;8:52. doi: 10.1186/1471-2334-8-52. [DOI] [PMC free article] [PubMed] [Google Scholar]
- Kaplan R, Orrell C, Zwane E, Bekker LG, Wood R. Loss to follow-up and mortality among pregnant women referred to a community clinic for antiretroviral treatment. AIDS. 2008;22:1679–1681. doi: 10.1097/QAD.0b013e32830ebcee. [DOI] [PMC free article] [PubMed] [Google Scholar]
- Keiser O, Anastos K, Schechter M, et al. Antiretroviral therapy in resource-limited settings 1996 to 2006: patient characteristics, treatment regimens and monitoring in sub-Saharan Africa, Asia and Latin America. Tropical Medicine and International Health. 2008;13:870–879. doi: 10.1111/j.1365-3156.2008.02078.x. [DOI] [PMC free article] [PubMed] [Google Scholar]
- Khan MSH. Retention and Attrition of Patients Commenced on HAART at Ladysmith Provincial Hospital in South Africa. South Africa: IAS 2009 Cape Town; 2009. (Abstract MOPEB045) [Google Scholar]
- Laurent C, Ngom Gueye NF, Ndour CT, et al. Long-term benefits of highly active antiretroviral therapy in Senegalese HIV-1-infected adults. Journal of Acquired Immune Deficiency Syndromes. 2005;38:14–17. doi: 10.1097/00126334-200501010-00003. [DOI] [PubMed] [Google Scholar]
- Lawn SD, Myer L, Wood R. Efficacy of antiretroviral therapy in resource-poor settings: are outcomes comparable to those in the developed world? Clinical Infectious Diseases. 2005;41:1683–1684. doi: 10.1086/498030. [DOI] [PubMed] [Google Scholar]
- Lawn SD, Harries AD, Anglaret X, Myer L, Wood R. Early mortality among adults accessing antiretroviral treatment programmes in sub-Saharan Africa. AIDS. 2008;22:1897–1908. doi: 10.1097/QAD.0b013e32830007cd. [DOI] [PMC free article] [PubMed] [Google Scholar]
- Lowrance DW, Ndamage F, Kayirangwa E, et al. Adult clinical and immunologic outcomes of the national antiretroviral treatment program in Rwanda during 2004–2005. Journal of Acquired Immune Deficiency Syndromes. 2009;52:49–55. doi: 10.1097/QAI.0b013e3181b03316. [DOI] [PubMed] [Google Scholar]
- MacPherson P, Moshabela M, Martinson N, Pronyk P. Mortality and loss to follow-up among HAART initiators in rural South Africa. Transactions of the Royal Society of Tropical Medicine and Hygiene. 2009;103:588–593. doi: 10.1016/j.trstmh.2008.10.001. [DOI] [PubMed] [Google Scholar]
- Marazzi MC, Liotta G, Germano P, et al. Excessive early mortality in the first year of treatment in HIV type 1-infected patients initiating antiretroviral therapy in resource-limited settings. AIDS Research and Human Retroviruses. 2008;24:555–560. doi: 10.1089/aid.2007.0217. [DOI] [PubMed] [Google Scholar]
- Martin J. Initial Treatment Outcomes from a Rural-based ART Scale-up Program in East Africa: The UARTO Cohort. 2008. 15th Conference on Retroviruses and Opportunistic Infections Abstract 816.
- Mocroft AJ, Lundgren JD, d’Armino MA, et al. Survival of AIDS patients according to type of AIDS-defining event. The AIDS in Europe Study Group. International Journal of Epidemiology. 1997;26:400–407. doi: 10.1093/ije/26.2.400. [DOI] [PubMed] [Google Scholar]
- Morgan D, Mahe C, Mayanja B, et al. HIV-1 infection in rural Africa: is there a difference in median time to AIDS and survival compared with that in industrialized countries? AIDS. 2002;16:597–603. doi: 10.1097/00002030-200203080-00011. [DOI] [PubMed] [Google Scholar]
- Nachega JB, Hislop M, Dowdy DW, et al. Efavirenz versus nevirapine-based initial treatment of HIV infection: clinical and virological outcomes in Southern African adults. AIDS. 2008;22:2117–2125. doi: 10.1097/QAD.0b013e328310407e. [DOI] [PMC free article] [PubMed] [Google Scholar]
- O’Brien DP, Mills C, Hamel C, Ford N, Pottie K. Universal access: the benefits and challenges in bringing integrated HIV care to isolated and conflict affected populations in the Republic of Congo. Conflict and Health. 2009;3:1. doi: 10.1186/1752-1505-3-1. [DOI] [PMC free article] [PubMed] [Google Scholar]
- Ojikutu BO, Zheng H, Walensky RP, et al. Predictors of mortality in patients initiating antiretroviral therapy in Durban, South Africa. South African Medical Journal. 2008;98:204–208. [PMC free article] [PubMed] [Google Scholar]
- Palombi L, Marazzi MC, Guidotti G, et al. Incidence and Predictors of Death, Retention, and Switch to Second-Line Regimens in Antiretroviral-Treated Patients in Sub-Saharan African Sites with Comprehensive Monitoring Availability. Clinical Infectious Diseases. 2009;48:115–122. doi: 10.1086/593312. [DOI] [PubMed] [Google Scholar]
- Rosen S, Fox MP, Gill CJ. Patient retention in antiretroviral therapy programs in sub-Saharan Africa: a systematic review. PLoS Medicine. 2007;4:e298. doi: 10.1371/journal.pmed.0040298. [DOI] [PMC free article] [PubMed] [Google Scholar]
- Rosen S, Long L, Sanne I. The outcomes and outpatient costs of different models of antiretroviral treatment delivery in South Africa. Tropical Medicine and International Health. 2008;13:1005–1015. doi: 10.1111/j.1365-3156.2008.02114.x. [DOI] [PubMed] [Google Scholar]
- Sieleunou I, Souleymanou M, Schonenberger AM, Menten J, Boelaert M. Determinants of survival in AIDS patients on antiretroviral therapy in a rural centre in the Far-North Province, Cameroon. Tropical Medicine and International Health. 2009;14:36–43. doi: 10.1111/j.1365-3156.2008.02183.x. [DOI] [PubMed] [Google Scholar]
- Souteyrand Y, Akwara P, Warner Smith M, et al. Scaling up access to antiretroviral therapy (ART) in low- and middle-income countries: global and regional progress in 2008. 2009. International AIDS Society Conference WELBD105.
- Toure S, Kouadio B, Seyler C, et al. Rapid scaling-up of antiretroviral therapy in 10000 adults in Cote d’Ivoire: 2-year outcomes and determinants. AIDS. 2008;22:873–882. doi: 10.1097/QAD.0b013e3282f768f8. [DOI] [PMC free article] [PubMed] [Google Scholar]
- Unge C, Sodergard B, Ekstrom AM, et al. Challenges for scaling up ART in a resource-limited setting: a retrospective study in kibera, Kenya. Jaids-Journal of Acquired Immune Deficiency Syndromes. 2009;50:397–402. doi: 10.1097/QAI.0b013e318194618e. [DOI] [PubMed] [Google Scholar]
- Yiannoutsos CT, An MW, Frangakis CE, et al. Sampling-based approaches to improve estimation of mortality among patient dropouts: experience from a large PEPFAR-funded program in Western Kenya. PLoS ONE. 2008;3:e3843. doi: 10.1371/journal.pone.0003843. [DOI] [PMC free article] [PubMed] [Google Scholar]