

Abstract
The diagnosis of influenza is often missed in older adults and illness presentation may be modified by prior vaccination. We evaluated the symptoms and immunologic markers predicting laboratory-confirmed influenza (LCI) among vaccinated older adults. In subjects with influenza-like illness (ILI), fever distinguished subjects with laboratory-confirmed influenza (LCI) from those with other ILI (39% vs. 12.5%, p=0.009). In LCI subjects who did not seroconvert to influenza infection, pre-infection levels of the cytolytic mediator, granzyme B, correlated with fever (r=1.00; p=0.01) and the IFN-γ:IL-10 ratio (r=0.99; p=0.03), and increased following influenza infection in LCI vs. ILI subjects (p=0.03). The cell-mediated immune response to influenza distinguishes A/H3N2 LCI from other ILI in older adults, and suggests a link between cell-mediated immunity and influenza illness severity in vaccinated older adults.
Keywords: influenza, granzyme B, interferon-γ, interleukin-10, elderly
1. Introduction
Influenza is a febrile respiratory illness affecting 5% – 20% of the US population each year. There were more than 200,000 annual hospitalizations estimated from 1979–2001 and at least 36,000 annual deaths during 1990–1999 [1, 2]. Mortality rates are highest among older adults especially with cardiovascular and pulmonary disorders [3]. Most of the surveillance data describing influenza in the community includes only small numbers of older adults [4, 5]. This study evaluated different symptoms and immunologic markers for predicting influenza in vaccinated older adults (≥60 years) presenting with respiratory symptoms during the influenza season.
Studies of the immune response to influenza vaccination and infection are often limited to measures of antibody titers. The contribution of cytotoxic T lymphocyte (CTL) to the defense mechanisms against influenza in people has long been understood [6]. Since aging is primarily associated with a severe reduction in CD8+ memory T cells that contribute to the CTL response [7], we have been interested in studying the effect of declining CTL activity on the response to influenza in older adults. Granzyme B (GzmB) has been shown to be the earliest and main contributor to CTL-mediated killing of influenza virus-infected cells in the mouse [8, 9], and GzmB activity has also been shown to correlate with traditional 51Cr-release assays of CTL activity in influenza-stimulated human peripheral blood mononuclear cells (PBMC) [10, 11]. In a study of well-characterized older adults with LCI using a validated assay of different immunologic markers, we show that interferon-γ (IFN-γ), interleukin-10 (IL-10) and GzmB levels in influenza-stimulated PBMC complement serologic measures of the immune response to influenza vaccination and infection.
2. Materials and Methods
2.1. Study design and participants
This was a prospective cohort study of 315 subjects (recruited by written, informed consent) to evaluate T cell responses as correlates of protection against influenza following vaccination in older adults conducted at the University of Connecticut Health Center (N = 140) and the Vancouver Coastal Health Research Institute (N = 175). The study enrolled subjects ≥ 60 years of age from the community with 11% recruited from heart function and 6% from pulmonary clinics. The study excluded patients with any immunocompromised state or who did not receive influenza vaccination in the previous year. The Institutional Review Board (IRB) at both participating institutions approved the study.
2.2. Procedures
Study participants were characterized according to demographics, presence or absence of CHF, medications including HMG CoA reductase inhibitors (statins), and functional capacity according to performance on the 6-Minute Walk Test (6-MWT). All participants were vaccinated at the first study visit in the fall of 2007 with influenza vaccine containing A/Solomon Islands/3/2006-like (H1N1), A/Wisconsin/67/2005-like (H3N2), and B/Malaysia/2506/2004-like strains and with subsequent study visits at 4, 10 and 20 weeks post-vaccination. Blood samples were drawn at each study visit for influenza serology and isolation and stimulation of PBMC with live influenza virus.
2.3. Influenza surveillance
Participants received weekly phone calls during the influenza season (early January through mid April, 2008), which started after the 10-week post-vaccination visits, and reported influenza-like illness (ILI) symptoms. ILI was defined by the presence of two respiratory symptoms (cough, sore throat, shortness of breath, and nasal stuffiness) or one respiratory and one systemic symptom (headache, malaise, oral temperature >99° F or feverishness and muscle aches). When reported symptoms met the ILI criteria and were within 5 days of onset, a nasal swab for detection of influenza virus was obtained during a home visit or a clinic visit; subjects were urged to call their primary care physician to report the illness and seek medical attention as needed. A laboratory diagnosis of influenza illness was confirmed by the detection of influenza virus in a polymerase chain reaction (PCR) assay of the nasal swabs or a 4-fold or greater rise in the antibody titer after the illness. Subjects that met both clinical and at least one of the laboratory criteria were identified as laboratory-confirmed influenza (LCI).
2.4. Polymerase chain reaction (PCR)
Frozen aliquots of nasal swab samples from the Connecticut and Vancouver sites were respectively tested in the Rochester laboratory (ARF) and the British Columbia Centre for Disease Control. RNA extracted from nasal samples using RNA STAT - 50 LS (Tel-Test, Friendswood, TX) was transcribed to cDNA and then amplified using proprietary primers and probes sequences (I-007-05; supplied by Dr. Stephen Lindstrom of the Center for Disease Control and Prevention, Atlanta, GA). Similar PCR methods were used at the British Columbia Centre for Disease Control (Vancouver, Canada). After the reverse transcription step, individual amplification steps were separated for Flu A and Flu B. For the Flu A amplification, cDNA was mixed with 400nM each of forward and reverse primers and 100 nM of the FAM labeled probe (with Black Hole Quencher 1). The same concentrations were used in the Flu B amplification except that the dual labeled probe concentration was 50 nM. Samples were amplified for 42 cycles.
2.5. Hemagglutination inhibition assay
Serum antibody titers measured by hemagglutination inhibition (HAI) assays were performed as previously described [12] using 2-fold dilutions of serum from 1/10 to 1/1024 and a single stock source for each of the hemagglutinin antigens (Centers for Disease Control, Atlanta, GA) and representing the strains of virus contained in the vaccine. Geometric mean titers were calculated using log10 conversion for each dilution. Seroprotection is defined as an antibody titer ≥ 40 and seroconversion as a 4-fold or greater rise in antibody titer.
2.6. Cell culture, virus stimulation and granzyme B assay
PBMC were isolated from venous blood samples at 0, 4, 10 and 20 weeks post-vaccination by Histopaque gradient purification and stimulated in AIM V medium (GIBCO) containing 3.0 × 10⁶ lymphocytes/ml, 6 × 10⁶ TCID50/ml of influenza A/H3N2 or B strains (sucrose-gradient purified A/Aichi and B/Lee, Charles River; or cell-derived A/Wisconsin/67/2005 and B/Malaysia/2506/2004, Solvay Pharmaceuticals, The Netherlands) as previously published [13]. PBMC lysates were harvested after 20 hours of culture and frozen at −80° C until completion of the study in each year. GzmB activity was measured in PBMC lysates (20 μl) by cleavage of the substrate, IEPDpna, (BACHEM) as previously described [14] and recently validated [15]. GzmB activity was then measured against a commercially available GzmB standard (Biomol), adjusted for the amount of protein in the lysate, and reported as units per mg protein (BCA assay, Pierce) in the PBMC lysates.
2.7. Multiplex cytokine assay
Bio-plex multiplex cytokine assay kits measuring IL-1β, IL-2, IL-5, IL-6, IL-10, IL-12, IL-17, and IFN-γ, and tumor necrosis factor-α (TNF-α) were from Bio-Rad Laboratories. Briefly, 50 μl culture medium was incubated with antibody-coupled beads. Complexes were washed, then incubated with biotinylated detection antibody and, finally, with streptavidin-phycoerythrin prior to assessing cytokine concentration titers. Human recombinant cytokine standards were provided by the vendor (Bio-Rad Laboratories). Cytokine levels were determined using a multiplex array reader and software from Luminex™ Instrumentation System (Bio-Plex Workstation from Bio-Rad Laboratories). Minimum level of detection for each of the cytokines (pg/ml) is IL-1: 0.3; IL-2: 0.3; IL-5: 0.8; IL-6: 0.6; IL-10: 0.5; IL-12(p70): 0.7; IL-17: 0.5; IFN-γ: 1.5; and TNF-α: 1.4. Undetectable cytokine levels were assigned a value of 1/2 of the MLD.
2.8. ELISA assay
IFN-γ and IL-10 levels were measured in PBMC supernatants using sandwich enzyme-linked immuonosorbent assay (ELISA) kits with a minimum level of detection (MLD) of 2.0 pg/ml for IL-10 and 4.0 pg/ml for IFN-γ (eBioscience, San Diego, CA). Undetectable cytokine levels were assigned a value of 1/2 of the MLD.
2.9. Statistical analysis
The analysis included all subjects reporting ILI and compared LCI subjects to those without LCI. Pearson correlation coefficients were used to detect associations. Paired t-tests were used to detect changes over time in response to vaccination or influenza infection. Differences between subjects with influenza infection compared with those without were evaluated using analysis of variance (ANOVA). Chi square tests were used to compare dichotomous variables and to calculate positive predictive values (PPV) and negative (NPV). Sensitivity and specificity were calculated from the number of subjects reporting ILI and the number of confirmed influenza cases. Univariate logistic regression analysis was used to evaluate each symptom effect on confirmed influenza cases. Multivariate backwards stepwise logistic regression was performed including all symptoms to predict confirmed influenza cases, adjusted for age and gender. All statistics were performed using SPSS 16.0 (Chicago, IL).
3. Results
3.1. Influenza Outcomes
Three hundred and fifteen subjects (58% females, 42% males) were enrolled and vaccinated in the fall of 2007 and influenza surveillance initiated at two study sites at the start of the influenza season in January 2008. The mean age was 74 years (range 60–92). Most of the participants were healthy adults (82.5%), 14% had heart failure (HF) and 6% had chronic obstructive pulmonary disease (COPD). Of the 315 participants, 90 (25%) reported ILI during the influenza season. The predominant circulating strains in the area of Vancouver, Canada, were influenza A/H3N2, and in the Hartford, CT area were influenza B, and this was reflected in the LCI detected at the two study sites. All LCI cases were documented between 10-weeks and 20-weeks post-vaccination when influenza was circulating in the community. According to the clinical and laboratory criteria, 19 subjects had confirmed influenza (20% of those reporting ILI). Thirteen of the 19 (66%) subjects had influenza A/H3N2 infections, and six (34%) had influenza B infections. An additional two subjects seroconverted to the A/H3N2 vaccine strain, and four subjects to the B strain in the vaccine, but reported no ILI, and thus could not be classified as LCI (i.e., asymptomatic seroconverters). Three LCI subjects had influenza A/H3N2 influenza confirmed by PCR but did not seroconvert to the infection. One influenza A/H3N2 case had a medically attended acute respiratory illness, was exposed to a confirmed LCI case, and showed an almost 4-fold increase in antibody titer but was not available for a nasopharyngeal swab at the time of illness. The results for the ILI and LCI cases are summarized in Figure 1.
Figure 1.
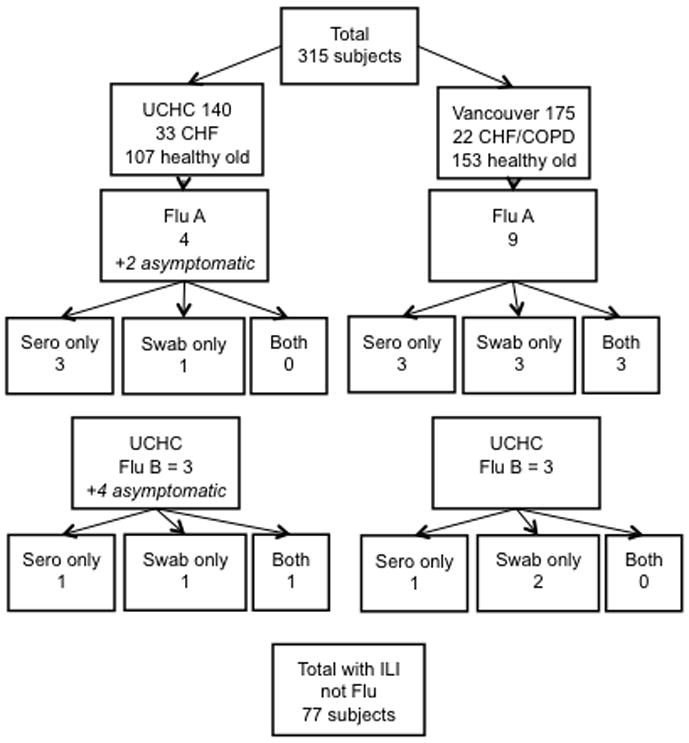
A flow chart of the results of influenza surveillance is shown for the two study sites (University of Connecticut Health Center [UCHC] and Vancouver). Laboratory confirmation for influenza A/H3N2 cases (Flu A) and influenza B (Flu B) are shown indicating the numbers of seroconverters (sero only), PCR-confirmed (swab only), or both, for subjects reporting influenza-like illness (ILI) symptoms.
3.2. ILI Symptoms Predicting Laboratory Confirmed Influenza
The most commonly reported symptoms by LCI subjects were coryza (94%), sore throat (68%) and cough (56%). Individuals with other respiratory illnesses reported coryza (89%), sore throat (71%) and malaise/fatigue (60%). Fever was the only symptom reported more frequently by the influenza cases (39% vs. 12.5%, p=0.009).
The average time from the onset of symptoms to reporting the illness was 3.7 days for subjects with influenza and 4 days for subjects with ILI without influenza (P=0.83). There was no difference between the numbers of symptoms reported by subjects with influenza A and influenza B (3.9 vs. 3.8). Flu positive subjects who seroconverted were not found to have more systemic complaints when compared to those who did not seroconvert.
As shown in Table I, fever was the best predictor of LCI with the odds ratio of 4.45 and PPV of 44% (P=0.01; 95% CI 1.37–14.4). Fever combined with coryza increased the PPV (54%) for LCI. The presence of HF and COPD was also suggestive of increased risk of influenza but it did not reach statistical significance (OR=3.2, P=0.08) probably due to the limited number of subjects. The symptom complex of fever, coryza and shortness of breath with a history of HF or COPD was strongly predictive of LCI (OR=13.9, P=0.003). None of the other symptoms, signs or subject characteristics could distinguish influenza from other respiratory illnesses.
Table I.
Clinical symptoms predicting influenza
| Symptom | N | PPV | NPV | Sensitivity | Specificity | Odds Ratio | 95% CI | P value |
|---|---|---|---|---|---|---|---|---|
| Headache | 22 | 23 | 81 | 28 | 76 | 1.24 | 0.39–3.99 | 0.71 |
| Fatigue/Malaise | 51 | 16 | 74 | 44 | 40 | 0.54 | 0.19–1.53 | 0.25 |
| Myalgia | 12 | 17 | 79 | 11 | 86 | 0.78 | 0.15–3.89 | 0.76 |
| Cough | 50 | 20 | 80 | 55 | 44 | 1.00 | 0.35–2.82 | 1.00 |
| Fever | 16 | 44 | 85 | 39 | 88 | 4.45 | 1.37–14.46 | 0.01 |
| Sore Throat | 63 | 19 | 78 | 67 | 29 | 0.82 | 0.27–2.48 | 0.73 |
| Dyspnea | 16 | 19 | 80 | 17 | 82 | 0.91 | 0.23–3.60 | 0.90 |
| Coryza | 81 | 21 | 89 | 94 | 11 | 2.12 | 0.25–18.18 | 0.49 |
| Fever + Coryza | 13 | 54 | 86 | 39 | 92 | 7.00 | 1.98–24.77 | 0.003 |
N = number of subjects who reported the symptom
PPV= Positive predictive value
NPP= Negative Predictive Value
CI= Confidence interval
p < 0.05 defined statistical significance using logistic regression models
Website for calculating sensitivity and specificity: http://www.chestxray.com/Statistics/TwobyTwo.html
Subjects with LCI due to influenza A/H3N2 or influenza B were separated in stepwise logistic regression model to identify clinical predictors. For influenza A, both coryza (OR=7.78, P=0.005; 95% CI, 2.0–56.7) and fever (OR 16.3, P=0.0001; 95% CI, 6.8–253) were strong predictors of influenza. For influenza B, only the history of HF or COPD was predictive of influenza illness when compared to the ILI not due to influenza (OR=5.4, P=0.02; 95% CI, 1.4–53). Three of the six LCI due to influenza B had CHF or COPD, while overall only 20% of subjects had CHF or COPD.
3.3. Granzyme B and cytokine responses to influenza infection
To determine the specificity of immune response to influenza, we compared the subset of LCI subjects with influenza A/H3N2 (N=13), to the rest of the ILI subjects including those with influenza B (N=77); as there is no immunologic cross-reactivity between influenza A and influenza B strains, LCI due to influenza B were combined with ILI due to other viral etiologies as the controls for this analysis. A similar analysis for the influenza B LCI group could not be conducted due to the limited number of cases and, thus, the subsequent analysis was restricted to the H3N2 LCI group, and cytokine and GzmB levels in A/H3N2-stimulated PBMC. Table II provides the antibody titers for the H3N2 LCI subjects, showing that three of the 13 subjects did not seroconvert to the A/H3N2 infection as determined by the change in antibody titers from 10-weeks to 20-weeks post-vaccination.
Table II.
Antibody titers for all LCI subjects*
| Flu Type | Group | Seroconversion | Titer 0 wks | Titer 4 wks | Titer 10 wks | Titer 20 wks |
|---|---|---|---|---|---|---|
| A/H3N2 | OLD | Yes | 5 | 5 | 5 | 80 |
| A/H3N2 | OLD | Yes | 5 | 20 | 10 | 1280 |
| A/H3N2 | OLD | No but PCR+ | 5 | 20 | 10 | 5 |
| A/H3N2 | OLD | Yes | 5 | 80 | 320 | 320 |
| A/H3N2 | OLD | Yes† | 40 | 113 | 113 | 320 |
| A/H3N2 | COPD | Yes | 5 | 20 | 20 | 160 |
| A/H3N2 | OLD | No but PCR+ | 5 | 20 | 10 | 10 |
| A/H3N2 | OLD | Yes | 40 | 40 | 40 | 160 |
| A/H3N2 | OLD | No but PCR+ | 113 | 160 | 160 | 160 |
| A/H3N2 | OLD | Yes | 5 | 10 | 5 | 20 |
| A/H3N2 | OLD | Yes | 160 | 320 | 320 | 2560 |
| A/H3N2 | HF | Yes | 10 | 20 | 20 | 160 |
| B | COPD | Yes | 5 | 20 | 20 | 80 |
| B | OLD | No but PCR+ | 453 | 320 | 320 | 640 |
| B | OLD | No but PCR+ | 40 | 160 | 80 | 160 |
| B | OLD | Yes | 5 | 20 | 20 | 80 |
| B | HF | No but PCR+ | 80 | 80 | 57 | 160 |
| B | HF | Yes | 20 | 40 | 40 | 640 |
Antibody titers measure pre- (0) and 4-, 10-, and 20-weeks post-vaccination. All ILI for the LCI cases were reported between 10-weeks and 20-weeks post-vaccination
Seroconversion: 4-fold rise in antibody titer from pre-infection (10-weeks) to post-infection (20 weeks)
Subject with ILI exposed to H3N2 LCI case but not available for nasopharyngeal swab was classified as seroconverter to A/H3N2
To determine the predictive value of cytokine and GzmB levels, we analyzed the absolute levels of GzmB, cytokines, and the IFN-γ:IL-10 ratio prior to A/H3N2 infection (10-weeks post-vaccination), and the response to infection (change in level from 10-weeks to 20-weeks post-vaccination) in A/H3N2-stimulated PBMC. GzmB levels in influenza A/H3N2-stimulated PBMC from A/H3N2 LCI cases were lower compared to the other ILI subjects but this difference was not statistically significant (Figure 2). As shown in Table III, the change in GzmB levels from pre-infection (10-weeks post-vaccination) to post-infection (20-weeks post-vaccination) with influenza A/H3N2 distinguished those older adults with confirmed influenza A/H3N2 infection from those with ILI due to other viruses. GzmB levels were measured using the same validated assay of GzmB activity in both study laboratories [15]. Mean GzmB activity significantly increased from 581.9 to 878.2 U/mg protein in response to influenza A/H3N2 infection (p=0.02) with a significantly greater increase in GzmB levels in LCI subjects with A/H3N2 compared to the rest of the ILI subjects (p=0.02) in whom no significant change in GzmB levels occurred (P=0.63).
Figure 2.
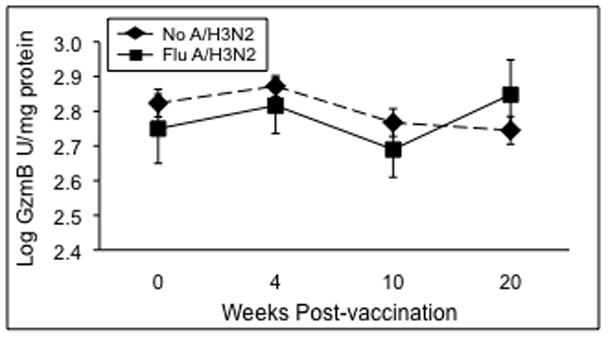
PBMC stimulated 20 hours with live influenza virus and granzyme B (GzmB) activity measured in PBMC lysates stimulated with the A/H3N2 strain. Geometric mean GzmB levels represent combined data for the two study sites are shown for the pre- (0 wks) and post-vaccination (4- and 10-wks) time points in ILI subjects without laboratory confirmed A/H3N2 (No A/H3N2, n=77) and subjects who subsequently developed influenza after the 10-week time point (Flu A/H3N2, n=13). Error bars represent standard error of the mean.
Table III.
Changes in Granzyme B among ILI subjects with or without H3N2 LCI
| ILI with H3N2 LCI (n=13) | ILI without H3N2 LCI (n=68) | ||||||
|---|---|---|---|---|---|---|---|
| Influenza infection (post-vacc)^ | Pre (10 wk) | Post (20 wk) | p value* | Pre (10 wk) | Post (20 wk) | p value* | 3•YDOXH‚ |
| Granzyme B | 581.9 | 878.2 | 0.02 | 740.4 | 710.9 | 0.63 | 0.02 |
| U/mg protein§ | ± 345.8 | ± 599.9 | ± 589.3 | ± 481.9 | |||
Granzyme B reported as geometric mean Units (Biomol standard)/mg protein ± standard error for all values are reported.
Pre- and Post-infection samples obtained at 10 and 20 weeks post-vaccination, respectively
p values based on paired t tests comparing means over time within each group
p values based on independent t tests comparing means between groups
In contrast to the GzmB results, the change in the IFN-γ:IL-10 ratio from pre- to post-infection, reflecting the T helper type 1 (IFN-γ) relative to the T helper type 2/3 (IL-10) response, was not significantly different between the two groups. These results may be explained by the different methods for the cytokine assays used at the two sites. Cytokine levels were measured by a validated multiplex bead array assay method in the Vancouver laboratory, and ELISA-based assays in the Connecticut laboratory. We have previously reported that the limited dynamic range of the ELISA-based assays often necessitates dilution of the sample, which also dilutes any inhibitors in the sample and may contribute to an inflation of the calculated cytokine levels [16]. The increased dynamic range of multiplex bead arrays minimizes the issues of sample dilution and affords the evaluation of multiple cytokines in a relatively small sample volume. Multiplex vs. ELISA-based assay techniques may account for the lack of difference in the IFN-:IL-10 ratio between H3N2 LCI and the rest of the ILI subjects when the results for the two laboratories were combined.
3.4. Fever correlates with low levels of GrzB and IFN-γ:IL-10 ratios
The next analyses were performed to establish linkages between the different immunologic measures and the clinical profile of LCI due to A/H3N2 infection. Due to the issues with the ELISA-based assays from the Connecticut site, we limited our analysis to the nine A/H3N2 cases from the Vancouver site. We postulated that fever was a sign of more severe influenza illness and analyzed the association between pre-infection levels of GzmB and cytokines (measured at 10-weeks post-vaccination, and the immune response to the infection (the change in levels from 10-weeks to 20 weeks post-vaccination). As shown in Figure 3, H3N2 LCI subjects who seroconverted to the A/H3N2 infection (Sero), compared to H3N2 LCI subjects who were PCR+ but did not seroconvert to the infection (PCR+), showed a significant increase from pre- to post-infection in both IFN-γ and IL-10 levels in A/H3N2-stimulated PBMC (p=0.056 and p=0.04, respectively). H3N2 LCI subjects who were PCR+ had a lower IFN-γ:IL-10 ratio at the pre- and 4-week post-vaccination but the ratio was not statistically different from the rest of the subjects. However, A/H3N2 PCR+ subjects appeared to be a unique subset of the H3N2 LCI cases in that there was a statistically significant correlation between low levels of GzmB in A/H3N2-stimulated PBMC prior to infection (10 weeks post-vaccination) and the report of fever (vs. no fever) during influenza A/H3N2 infection, only in the A/H3N2 PCR+ group (r=1.000, p=0.01). In addition, these low GzmB levels were highly correlated with the IFN-γ:IL-10 ratio (r=0.999, p=0.03). Thus, illness severity (presence of fever) in the A/H3N2 PCR+ group compared to the A/H3N2 Sero group, may correspond to the low levels of GzmB and the IFN-γ:IL-10 ratio and the inability to mount an antibody response to infection.
Figure 3.
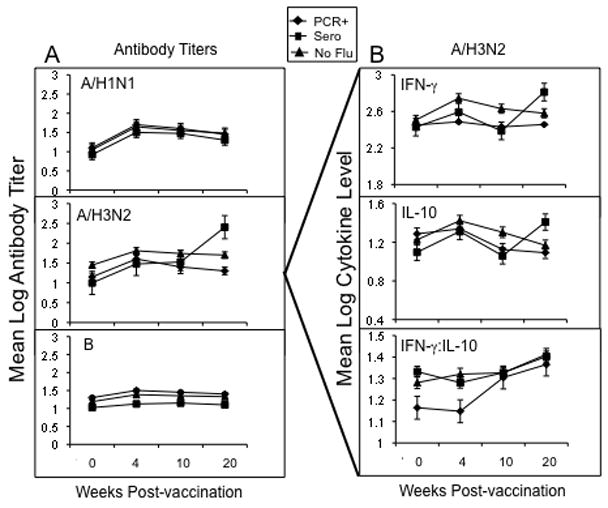
Serum antibody titers to the three vaccine strains and IFN-γ and IL-10 levels in PBMC stimulated with A/H3N2 virus pre- (0 wks) and post-vaccination (4-, 10- and 20-wks) are shown for the Vancouver site. In subjects who developed influenza illness (between 10 and 20 weeks post-vaccination), subjects who were PCR+ only (PCR+, n=3) and those who seroconverted ± PCR+ (Sero, n=6) were compared to ILI subjects that did not develop influenza A/H3N2 (n=54). (A) serum antibody titers to the three vaccine strains, and (B) IFN-γ and IL-10 levels, and the IFN-γ:IL-10 ratio in A/H3N2-stimulated PBMC are shown. Error bars represent standard error of the mean.
3.5 Other cytokines do not show a response to influenza infection
The analysis of other cytokine levels in influenza-stimulated PBMC supernatants by multiplex bead arrays was explored to determine which cytokine levels changed in response to influenza vaccination and infection in older adults. The IFN-γ and IL-10 response from pre- to 4-weeks post-vaccination was statistically significant (p<0.001 for both) but the IFN-γ:IL-10 ratio did not significantly change over this time period (Figure 3). As shown in Figure 4, a significant response from pre- to 4-weeks vaccination could be demonstrated for IL-1β, IL-2, IL-5, IL-6, IL-12, IL-17, and TNF-γ (p≤ 0.01) but a clear increase from pre-infection (10-weeks post-vaccination) to post-infection (20-weeks post-vaccination) with A/H3N2 could not be demonstrated with the limited number of A/H3N2 cases available for this analysis.
Figure 4.
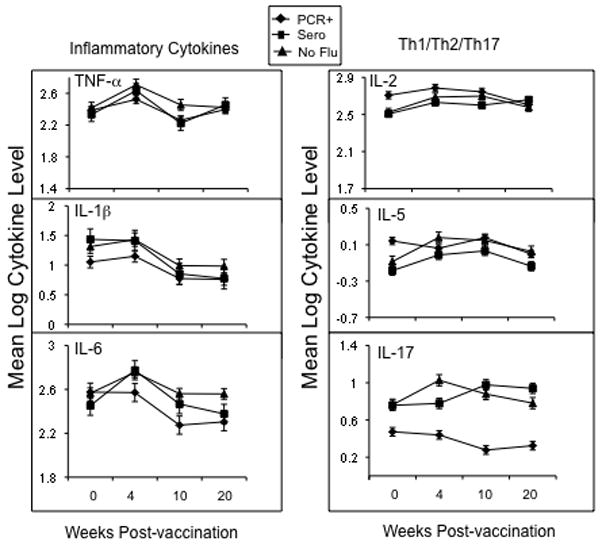
Cytokine levels in PBMC stimulated with A/H3N2 virus pre- (0 wks) and post-vaccination (4-, 10- and 20-wks) are shown for the Vancouver site. In subjects who developed influenza illness, subjects who were PCR+ only (PCR+, n=3) and those who seroconverted ± PCR+ (Sero, n=6) were compared to subjects that did not develop influenza. Error bars represent standard error of the mean.
4. Discussion
Influenza surveillance in vaccinated older adults suggests that it is very difficult to predict influenza illness based on different clinical signs and symptoms. Fever has been identified as a predictor of influenza illness along with cough, rhinorrhea and acuity of symptoms in the published literature representing all ages [4, 17–19]. Studies evaluating older adults in the community have slightly mixed results. In study by Govaert et al., the combination of fever, cough and acute onset of symptoms had the highest predictive value (30.3%) [17]. Nicholson et al. suggested that in the elderly population, the symptom complex of myalgia, respiratory symptoms and feverishness or sweats had a sensitivity of 29% with PPV of 33% [20, 21]. Our results are consistent with these studies with fewer predictors identified due to the smaller numbers of LCI cases identified in this study.
We present data to show a very high correlation between low GzmB levels prior to influenza A/H3N2 infection, the development of fever, and the lack of seroconversion to the infection, suggesting a link between cell-mediated immunity and influenza illness severity. Our results also show that GzmB levels specifically increase in response to influenza A/H3N2 infection independent of the serologic response. We have previously shown that the T cell memory that is established by an influenza infection, can be re-stimulated with a subsequent vaccination in older adults suggesting that new influenza vaccines could be designed to stimulate a more robust T cell response and enhance protection [13]. We have also shown that the GzmB response to influenza infection can be detected by approximately one week after the onset of illness [14, 22]. Since not all older adults seroconvert to influenza infection, GzmB may serve as an alternate marker of infection in this population, which tends to have atypical presentations. In contrast, IFN-γ and IL-10 levels only appear to increase in those who seroconvert to the infection, and thus may not add to what can more easily be detected by changes in antibody titers.
GzmB levels in ex vivo influenza stimulated PBMC may increase in the absence of a cytokine response following an influenza infection because CTL memory is directly stimulated by influenza epitopes expressed with MHC I on infected cells of the respiratory epithelium. The amount of GzmB activity produced ex vivo by these recently stimulated memory CTL, would thus be expected to increase over GzmB levels observed prior to influenza infection. In contrast, helper T cells are stimulated by influenza-peptide-MHC II complexes on antigen presenting cells in the lymph nodes adjacent to the lungs. The resulting helper T cell memory may not translate to increased cytokine levels or the ratio of IFN-γ:IL-10 in ex vivo influenza-stimulated PBMC, relative to the levels obtained prior to infection. When there are low levels of CTL activity (GzmB) at the onset of infection and no change in ex vivo cytokine levels or the IFN-γ:IL-10 ratio in response to infection, the lack of a T-dependent antibody response (i.e., seroconversion) to influenza infection and an increased severity of illness may be predicted.
The limitations of this study are the small number of cases influenza A/H3N2 within the different LCI subsets. However, a strong association between fever and pre-infection levels of GzmB and IFN-γ:IL-10 ratios was detected in subjects who did not mount an antibody response. These results provide a model that could test the hypothesis that GzmB levels and potentially IFN-γ:IL-10 ratios correspond to influenza illness severity as a measure of vaccine-mediated protection in older adults. Given that validated assays of GzmB and cytokine were used in this study [15], these results could be reproduced across different laboratories and further develop this assay as a method to stratify illness severity related to influenza infection in different risk groups such as those with COPD or HF. It should also be highlighted that the 20-hour time point for harvesting these PBMC cultures was selected for the early peak of GzmB, IFN-γ and IL-10 production, and may not represent the optimal time for measuring peak levels of the other cytokines that were included in the multiplex assays.
In summary, we have identified different profiles of the immune response to infection with influenza A/H3N2 causing illness in older adults. Changes in the levels of GzmB, IFN-γ and IL-10 as a result of influenza infection appear to be specific for the infecting influenza subtype, and can distinguish those with influenza A/H3N2 confirmed illness from those older adults who have ILI due to influenza B or other respiratory viruses. Validated ex vivo assays of these cellular immune markers present new insights into the response to influenza infection and opportunities to better understand the determinants of disease severity in older adults with influenza.
Acknowledgments
Dr Falsey has received research funding from sanofi pasteru and GSK and consulting fees for astra Zeneca and Medimmune.
Financial support: This work was supported by NIH R01 AI68265 (University of Connecticut Health Center, J.E. McElhaney, PI) and an investigator-initiated contract (J.E. McElhaney) with GSK Canada.
The research was funded by a grant from the National Institutes of Health, National Institute of Allergy and Infectious Diseases (R01 AI68265) at the University of Connecticut Health Center, and an investigator-initiated research contract from GSK in Vancouver, Canada. The Network of Centres of Excellence in Vaccines and Immunotherapeutics (CANVAC) in Canada supported the development of the GzmB assay, and a grant from the Canadian Institutes of Health Research supported the validation of the GzmB and cytokine assays. The study was conducted through the Lowell P. Weicker, Jr. General Clinical Research Center funded by the NIH, National Center for Research Resources (Grant Number MO1 RR06192) at the UCHC, in collaboration with the UConn Center on Aging, and at the VITALiTY Research Unit, Vancouver, BC. We thank Dr. Ernst Soethut for his review of the manuscript, Gale Tedder, Nancy Dean and Lisa Kenyon-Pesce for their outstanding commitment to study recruitment and co-ordination, and Yen Lemire and Lindsey Ferraria for excellent technical assistance.
Footnotes
Conflict of interest: Dr. McEhaney has received funding for this study under an investigated-initiated research contract with GSK. She has also received funding for the following (alphabetical order): CSL (honoraria), Dynavax (honoraria), GSK (consultancy, honoraria and research funding), Merck (consultancy, honoraria, participation in clinical research study and trial), Novartis (honoraria), Novavax (consultancy), Sanofi Pasteur (consultancy and honoraria), and Solvay (consultancy and honoraria).
Publisher's Disclaimer: This is a PDF file of an unedited manuscript that has been accepted for publication. As a service to our customers we are providing this early version of the manuscript. The manuscript will undergo copyediting, typesetting, and review of the resulting proof before it is published in its final citable form. Please note that during the production process errors may be discovered which could affect the content, and all legal disclaimers that apply to the journal pertain.
References
- 1.Thompson WW, Shay DK, Weintraub E, Brammer L, Cox N, Anderson LJ, et al. Mortality associated with influenza and respiratory syncytial virus in the United States. Jama. 2003;289(2):179–86. doi: 10.1001/jama.289.2.179. [DOI] [PubMed] [Google Scholar]
- 2.Thompson WW, Shay DK, Weintraub E, Brammer L, Bridges CB, Cox NJ, et al. Influenza-associated hospitalizations in the United States. Jama. 2004;292(11):1333–40. doi: 10.1001/jama.292.11.1333. [DOI] [PubMed] [Google Scholar]
- 3.Glezen WP. Serious morbidity and mortality associated with influenza epidemics. Epidemiol Rev. 1982;4:25–44. doi: 10.1093/oxfordjournals.epirev.a036250. [DOI] [PubMed] [Google Scholar]
- 4.Carrat F, Tachet A, Rouzioux C, Housset B, Valleron AJ. Evaluation of clinical case definitions of influenza: detailed investigation of patients during the 1995–1996 epidemic in France. Clin Infect Dis. 1999;28(2):283–90. doi: 10.1086/515117. [DOI] [PubMed] [Google Scholar]
- 5.van Elden LJ, van Essen GA, Boucher CA, van Loon AM, Nijhuis M, Schipper P, et al. Clinical diagnosis of influenza virus infection: evaluation of diagnostic tools in general practice. Br J Gen Pract. 2001;51(469):630–4. [PMC free article] [PubMed] [Google Scholar]
- 6.McMichael AJ, Gotch FM, Noble GR, Beare PA. Cytotoxic T-cell immunity to influenza. N Engl J Med. 1983;309(1):13–7. doi: 10.1056/NEJM198307073090103. [DOI] [PubMed] [Google Scholar]
- 7.Pawelec G, Akbar A, Caruso C, Solana R, Grubeck-Loebenstein B, Wikby A. Human immunosenescence: is it infectious? Immunological reviews. 2005 Jun;205:257–68. doi: 10.1111/j.0105-2896.2005.00271.x. [DOI] [PubMed] [Google Scholar]
- 8.Johnson BJ, Costelloe EO, Fitzpatrick DR, Haanen JB, Schumacher TN, Brown LE, et al. Single-cell perforin and granzyme expression reveals the anatomical localization of effector CD8+ T cells in influenza virus-infected mice. Proc Natl Acad Sci U S A. 2003;100(5):2657–62. doi: 10.1073/pnas.0538056100. Epub 003 Feb 24. [DOI] [PMC free article] [PubMed] [Google Scholar]
- 9.Lawrence CW, Ream RM, Braciale TJ. Frequency, specificity, and sites of expansion of CD8+ T cells during primary pulmonary influenza virus infection. J Immunol. 2005 May 1;174(9):5332–40. doi: 10.4049/jimmunol.174.9.5332. [DOI] [PubMed] [Google Scholar]
- 10.Ewen C, Kane KP, Shostak I, Griebel PJ, Bertram EM, Watts TH, et al. A novel cytotoxicity assay to evaluate antigen-specific CTL responses using a colorimetric substrate for Granzyme B. J Immunol Methods. 2003;276(1–2):89–101. doi: 10.1016/s0022-1759(03)00073-5. [DOI] [PubMed] [Google Scholar]
- 11.McElhaney JE, Pinkoski MJ, Upshaw CM, Bleackley RC. The cell-mediated cytotoxic response to influenza vaccination using an assay for granzyme B activity. J Immunol Methods. 1996;190(1):11–20. doi: 10.1016/0022-1759(95)00235-9. [DOI] [PubMed] [Google Scholar]
- 12.WHO Collaborating Center for Influenza BPD. The hemagglutination inhibition test for influenza viruses. Atlanta, GA: DHEW, PHS, CDC, Center for Infectious Disease; 1981. pp. 1–21. revised. [Google Scholar]
- 13.McElhaney JE, Ewen C, Zhou X, Kane KP, Xie D, Hager WD, et al. Granzyme B: Correlates with protection and enhanced CTL response to influenza vaccination in older adults. Vaccine. 2009;27:2418–25. doi: 10.1016/j.vaccine.2009.01.136. [DOI] [PMC free article] [PubMed] [Google Scholar]
- 14.McElhaney JE, Xie D, Hager WD, Barry MB, Wang Y, Kleppinger A, et al. T cell responses are better correlates of vaccine protection in the elderly. J Immunol. 2006 May 15;176(10):6333–9. doi: 10.4049/jimmunol.176.10.6333. [DOI] [PubMed] [Google Scholar]
- 15.Gijzen K, Liu WM, Visontai I, Oftung F, van der Werf S, Korsvold GE, et al. Standardization and validation of assays determining cellular immune responses against influenza. Vaccine. Mar 4; doi: 10.1016/j.vaccine.2010.02.076. In Press. [DOI] [PubMed] [Google Scholar]
- 16.Leng SX, McElhaney JE, Walston JD, Xie D, Fedarko NS, Kuchel GA. ELISA and multiplex technologies for cytokine measurement in inflammation and aging research. J Gerontol A Biol Sci Med Sci. 2008 Aug;63(8):879–84. doi: 10.1093/gerona/63.8.879. [DOI] [PMC free article] [PubMed] [Google Scholar]
- 17.Govaert TM, Dinant GJ, Aretz K, Knottnerus JA. The predictive value of influenza symptomatology in elderly people. Fam Pract. 1998;15(1):16–22. doi: 10.1093/fampra/15.1.16. [DOI] [PubMed] [Google Scholar]
- 18.Monto AS, Gravenstein S, Elliott M, Colopy M, Schweinle J. Clinical signs and symptoms predicting influenza infection. Arch Intern Med. 2000;160(21):3243–7. doi: 10.1001/archinte.160.21.3243. [DOI] [PubMed] [Google Scholar]
- 19.Heilly SJ, Janoff EN, Nichol P, Nichol KL. Rapid diagnosis of influenza infection in older adults: Influence on clinical care in routine clinical setting. J Clin Virol. 2008;42:124–8. doi: 10.1016/j.jcv.2007.12.014. [DOI] [PubMed] [Google Scholar]
- 20.Nicholson KG, Kent J, Hammersley V, Cancio E. Acute viral infections of upper respiratory tract in elderly people living in the community: comparative, prospective, population based study of disease burden. Bmj. 1997;315(7115):1060–4. doi: 10.1136/bmj.315.7115.1060. [DOI] [PMC free article] [PubMed] [Google Scholar]
- 21.Boivin G, Hardy I, Tellier G, Maziade J. Predicting influenza infections during epidemics with use of a clinical case definition. Clin Infect Dis. 2000;31(5):1166–9. doi: 10.1086/317425. Epub 2000 Nov 06. [DOI] [PubMed] [Google Scholar]
- 22.McElhaney JE, Gravenstein S, Krause P, Hooton JW, Upshaw CM, Drinka P. Assessment of markers of the cell-mediated immune response after influenza virus infection in frail older adults. Clin Diagn Lab Immunol. 1998;5(6):840–4. doi: 10.1128/cdli.5.6.840-844.1998. [DOI] [PMC free article] [PubMed] [Google Scholar]