

Abstract
The green alga Chlorella protothecoides has received considerable attention because it accumulates neutral triacylglycerols, commonly regarded as an ideal feedstock for biodiesel production. In order to gain a better understanding of its metabolism, tracer experiments with [U-13C]/[1-13C]glucose were performed with heterotrophic growth of C. protothecoides for identifying the metabolic network topology and estimating intracellular fluxes. Gas chromatography-mass spectrometry analysis tracked the labeling patterns of protein-bound amino acids, revealing a metabolic network consisting of the glycolysis, the pentose phosphate pathway, and the tricarboxylic acid cycle with inactive glyoxylate shunt. Evidence of phosphoenolpyruvate carboxylase, phosphoenolpyruvate carboxykinase, and malic enzyme activity was also obtained. It was demonstrated that the relative activity of the pentose phosphate pathway to glycolysis under nitrogen-limited environment increased, reflecting excess NADPH requirements for lipid biosynthesis. Although the growth rate and cellular oil content were significantly altered in response to nitrogen limitation, global flux distribution of C. protothecoides remained stable, exhibiting the rigidity of central carbon metabolism. In conclusion, quantitative knowledge on the metabolic flux distribution of oleaginous alga obtained in this study may be of value in designing strategies for metabolic engineering of desirable bioproducts.
Due to the energy shortage, rising petroleum prices, and the environmental impact of fossil energy-based industries, oleaginous microalgae are receiving increasing attention as a potential feedstock for providing a large source of renewable fuel materials. Biofuel from microalgae (the third-generation biofuel) offers obvious environmental benefits because the process can be coupled with photosynthetic carbon dioxide mitigation (Wang et al., 2008; Brune et al., 2009). Besides this, other eco-friendly behaviors of microalgae also garner interest, including that some algal species can remove nitrogen oxide from combustion gases, grow well in brackish habitats, use far less water than traditional oilseed crops, and double their numbers within 1 d, resulting in increased biomass yield (Li et al., 2008).
The economical and environmental benefits of microalgal biofuel prompted research and development of algal strains that synthesize a high proportion of oil. The green alga Chlorella protothecoides is one of the best oil-producing species ever reported (Rosenberg et al., 2008). Under heterotrophic culture conditions, it rapidly transforms carbohydrates into triacylglycerols (more than 50% of dry cell weight), which can be further transesterified with alcohol (Miao and Wu, 2006; Xu et al., 2006; Xiong et al., 2008). These processes open a promising and highly efficient pathway for biodiesel production. A crucial point affecting biodiesel refinery is the oil productivity of heterotrophic Chlorella, which primarily relies on carbon flow from sugar to oil. Since the backbone of biomass components and by-products (e.g. proteins, CO2) besides triacylglycerols are also derived from carbon substrate, the final yield of oil is determined by the intracellular distribution of carbon flux. In our previous work (Miao and Wu, 2006), carbon flux targeting into lipid synthesis was severely affected by the nutrient environment of the medium. Oil accumulation tends to occur under carbon-sufficient but nitrogen-limited conditions (Rosenberg et al., 2008), reflecting a unique way in which metabolic networks of Chlorella respond to environmental perturbations. However, until now, in-depth knowledge of the metabolic network in green alga was limited by the lack of quantitative data. Thus, it is urgently required to gain metabolic information on microalgae to better understand the intracellular distribution of carbon fluxes in response to environmental stimuli.
On the basis of 13C-labeling experiments, metabolic flux analysis (MFA) emerged as an integrated experimental/computational tool to identify the biochemical network of active reactions and to provide quantitative insight into the in vivo distribution of molecular fluxes throughout central carbon metabolism (Zamboni et al., 2009). The general principle of this cutting-edge methodology is based on 13C-tracer study, which can distinguish fluxes through different pathways when these fluxes lead to different positional isotopic enrichments. These labeling patterns are imprinted in metabolic intermediates (e.g. protein-bound amino acids) and can be analyzed by gas chromatography-mass spectrometry (GC-MS) or NMR spectroscopy. Fluxomic information then can be quantified from the isotope data by mathematical modeling. For instance, an alternative approach, named metabolic flux ratio analysis (Fischer and Sauer, 2003), is to utilize algebraic equations for determining strictly local ratios of converging fluxes. Absolute intracellular fluxes may be further assessed by implementing such flux partitioning ratios to a linear equation system, which results from material balances (e.g. 13C constraint flux analysis; Fischer et al., 2004). Following these procedures, 13C MFA has the ability to resolve parallel, cyclic, and reversible fluxes, making it a powerful technique not only for quantifying metabolic fluxes but also for identifying novel or unexpected metabolic pathways. In recent years, the successful application of the 13C-flux method for determining the in vivo reaction velocities in model microorganisms, such as Escherichia coli (Yang et al., 2003), Bacillus subtilis (Fischer and Sauer, 2005), Corynebacterium glutamicum (Hoon Yang et al., 2006), and Saccharomyces cerevisiae (Blank et al., 2005), has been widely reported. Moreover, the 13C-flux method also demonstrated its value in tracking metabolic profiles in plant and animal cells. For example, recent research on heterotrophic cell suspension cultures of Arabidopsis (Arabidopsis thaliana) highlighted the stability of the flux distribution under different oxygenation conditions (Williams et al., 2008), while work on breast tumor cells revealed widespread changes to central metabolism upon cellular transformation (Yang et al., 2008). Nevertheless, to our knowledge, this approach has yet to be applied to eukaryotic alga grown heterotrophically.
In recent decades, heterotrophic fermentation of photosynthetic microorganisms was raised as an important strategy to improve the efficiency and reduce the cost of alga-based biorefinery. Particularly, the heterotrophic growth of Chlorella is of wide concern for commercial production of high-value carotenoid (Sansawa and Endo, 2004), lutein (Shi et al., 2002), astaxanthin (Del Campo et al., 2004), and even biofuels (Xiong et al., 2008). Nevertheless, compared with other photosynthetic organisms, Chlorella grown on organic substrates is less understood due to the smaller data set of accurate genomic and biochemical information than is typically available for model plants. Here, we demonstrate that by using well-designed 13C-tracer experiments and highly sensitive isotopomer analysis, quantitative metabolic knowledge in not fully characterized species can be obtained. We adopted GC-MS to analyze the labeling patterns of the amino acids in biomass hydrolysates of Chlorella grown in a chemically defined medium with different carbon-nitrogen (C/N) ratios. Two-dimensional 1H-13C NMR spectroscopy was further utilized to confirm flux ratios in key nodes of the Chlorella metabolic network. By integrating these labeling measurement data with metabolite balancing, the intracellular flux distributions in Chlorella were thus quantitated. This article is, to our knowledge, the first 13C MFA study for identifying and quantifying the intracellular metabolic fluxes in oleaginous alga.
RESULTS AND DISCUSSION
Batch Culture-Based Labeling System and Isotopic Steady State
To be a photosynthetic organism, C. protothecoides also has a natural capacity to grow heterotrophically in the dark. Sugar metabolism of C. protothecoides without light can be stringently independent of the energy and carbon derived from photosynthesis. Thus, the labeling enrichment of metabolites will not be diluted by uninvited 12C from air, and it is feasible to utilize [13C]Glc as a tracer for tracking C. protothecoides metabolism quantitatively.
In terms of 13C MFA on plant cells, the actual attainment of steady state is crucial. Labeling should continue long enough in plant cell suspension cultures for metabolic pools to turn over several times while changes in metabolism are minimal (Schwender, 2008). In our study, we adopted batch culture in the absence of light on exogenous Glc for carbon-labeled cell growth. Through batch cultures, Chlorella cells suspended in a chemically defined medium took up [13C]Glc for growth, and the fractional labeling (FL) values of target metabolites (proteinogenic amino acids) during the log growth phase can be measured quantitatively. When cells were exponentially grown on 10% [U-13C]Glc and 90% unlabeled Glc (Supplemental Fig. S1), most protein-bound amino acids have uniform FLs with those of input labeling substrate. These results suggest that although a lag phase emerges at the beginning of the batch, its effect on isotopic steady state is negligible in protein-bound amino acids and the labeling culture reaches isotopic steady state during the exponential phase, which provides valid assumptions for 13C metabolic flux analysis.
Influence of Nitrogen Concentration on Chlorella Metabolism and Corresponding Stoichiometric Models
Concentrations of Gly in culture medium were investigated as a key nutrient factor that affects cell growth and lipid synthesis of C. protothecoides. The experimentally determined growth parameters of C. protothecoides with two levels of nitrogen are summarized in Table I. As can be seen, both environments allow Chlorella cells to convert Glc quantitatively to biomass without any significant by-product formation. The biomass yields on Glc were 0.382 g dry weight g−1 Glc in the medium with high concentration of Gly and 0.273 g dry weight g−1 Glc in nitrogen-limited conditions. Not surprisingly, nitrogen limitation resulted in a decreased cell growth rate at 0.038 h−1, which was 30.9% lower than that obtained under nitrogen-sufficient conditions.
Table I. Growth parameters of exponentially growing Chlorella.
Data are determined at an OD540 between 1 and 2. μ, Specific cell growth rate; YX/S, biomass yield on Glc; qglc, specific Glc consumption rate.
| Nitrogen | μ | YX/S | qglc |
| h−1 | g g−1 | mmol g−1 h−1 | |
| Low | 0.038 | 0.273 | 0.652 |
| High | 0.055 | 0.382 | 0.803 |
The macromolecular composition of biomass is known to vary with environmental conditions. Hence, we determined the quantitative change in macromolecular composition with different C/N ratios. The biomass was subdivided into five major components: carbohydrate, lipid, protein, DNA, and RNA, which together accounted for more than 85% of dry cell weight. C/N ratio of culture medium was found to have no significant impact on the content of DNA, RNA, and carbohydrate (Fig. 1). However, changes in the content of protein and lipid were apparent. The Chlorella cells cultivated in low-C/N medium contained 25.8% protein and 25.2% lipid. In sharp contrast to this, high-C/N environment resulted in the synthesis of more lipids, which accounted for 53.8% dry cell weight. Simultaneously, protein content decreased to 10.5% of dry cell weight. This result indicated that carbon flux was redistributed and accumulation of large amounts of lipids occurred in the cell when oleaginous algae were placed into a nitrogen-limited environment. It is likely that Chlorella cells prepare reserve materials (oil) in anticipation of improved environments at the expense of rapid growth.
Figure 1.

Structural units for biomass formation in C. protothecoides under different nitrogen concentrations. The numbers represent percentages of the corresponding components in biomass (g g−1 dry weight).
To quantitatively evaluate the impact of nitrogen starvation stimulus to biomass formation, construction of a detailed stoichiometric model of C. protothecoides is required. For this purpose, the composition of every component, its biosynthetic precursors, and cofactor demands were comprehensively considered. Supplemental Table S1 summarizes the composition of macromolecules for biomass construction in C. protothecoides. RNA and DNA compositions of Chlorella biomass were estimated with accessible genome data. Amino acid and fatty acid compositions were calculated from experimental measurements. According to the experimental analysis, despite the obvious changes in oil and protein contents, the nitrogen concentration in culture medium had no significant impact on amino acid composition of protein and fatty acid profiles. Table II subsequently summarizes biosynthetic building blocks and cofactor requirements for C. protothecoides cell components. These data, which were calculated on the basis of standard textbook knowledge, provided insight into the stoichiometry of C. protothecoides for the following flux estimation.
Table II. Requirements of cofactors and building blocks per gram of component.
The negative values indicate consumption and the positive values indicate formation. All quantities were calculated on the basis of the relative proportion of macromolecular components in C. protothecoides and the standard biochemical stoichiometry. AcCoA, Acetyl-CoA; AKG, α-ketoglutarate; 1C, methyl group bound to tetrahydrofolate; E4P, erythrose-4-phosphate; P5P, pentose-5-phosphate pool; T3P, triose-3-phosphate pool; G6P, Glc-6-P.
| Compartment | Requirements of Cofactors and Building Blocks | ||||||||||||||||
| ATP | NADPH | AcCoA | CO2 | AKG | CoA | Pyr | PGA | NADH | 1C | OAA | NH3 | PEP | E4P | P5P | T3P | G6P | |
| μmol g−1 component | |||||||||||||||||
| Protein | −44,571.6 | −16,999.5 | −707.7 | 2,878.5 | −1,639.4 | 707.7 | −4,294.8 | −1,486.6 | 3,242.5 | 547.6 | −2,132.8 | −10,935 | −954.4 | −477.2 | −173.1 | 15.4 | 0 |
| RNA | −31,515.7 | −5,178.7 | 0 | −5,178.7 | 0 | 0 | 0 | −1,446.1 | 6,838.6 | 0 | 2,892.1 | −11,384 | −3,732.6 | 0 | −3,116.5 | 0 | 0 |
| DNA | −36,886.2 | −10,404.4 | 0 | −5,382.5 | 0 | 0 | 0 | −1,503 | 4,101.7 | 0 | 3,005.9 | −11,831.9 | −3,879.5 | 0 | −3,239.1 | 0 | 0 |
| Lipid | −22,517.3 | −45,034.6 | −25,404.2 | 0 | 0 | 25,404.2 | 0 | 0 | 0 | 0 | 0 | 0 | 0 | 0 | 0 | −1,443.4 | 0 |
| Carbohydrates | −6,172.8 | 0 | 0 | 0 | 0 | 0 | 0 | 0 | 0 | 0 | 0 | 0 | 0 | 0 | 0 | 0 | −6,172.8 |
GC-MS Results
In recent years, GC-MS was developed as a sensitive and useful tool for 13C-flux estimation. To track the mass isotopomer patterns of proteinogenic amino acids in Chlorella biomass, cells grown on 13C-labeled Glc were harvested from the midexponential growth phase under high/low-nitrogen cultivations and subjected to hydrolysis and derivatization for GC-MS measurement. Since 13C MFA requires exclusive mass isotope distribution of the carbon skeleton, raw mass data were corrected for natural isotope abundances in all N-tert-butyldimethylsilyl-N-methyltrifluoroacetamide (TBDMS) atoms and all amino acid heteroatoms. Table III shows the corrected abundance of the mass isotopomers in [U-13C]Glc labeling experiments. The resulting electron impact ionization mass spectral data are sets of ion clusters caused by partial fragmentation of the analyzed amino acids. For example, the mass spectrum of TBDMS-derivatized Ala included two ion clusters, M_ala_057 and M_ala_085, which represented C1-C2-C3 and C2-C3 of Ala, respectively. As shown in Table III, such data provide abundant information that allows diagnosis of the consistency of the labeling experiment and GC-MS measurement. To check whether the obtained mass distribution vector (MDV) can be utilized in the following analysis, the fractional enrichment of each fragment is calculated according to Equation 4 (see “Materials and Methods”). Since the mixture of 10% [U-13C]Glc and 90% unlabeled Glc was used as substrate, all metabolites were expected to have identical FLs of around 0.1, and those fragments that did not have FLs between 0.09 and 0.11 might reflect major experimental errors. As shown in Table III, most fragments demonstrate consistent FL values with input substrate, confirming the reliability and availability of the MS data. There are also a few fragments that have inconsistent FLs. For example, those fragments from Gly and Ser are shown to have lower FLs (less than 0.09). This indicates that the labeling enrichments of these two amino acids are severely diluted by unlabeled Gly in the medium.
Table III. Mass isotopomer distribution of TBDMS-derivatized protein-bound amino acids (corrected).
The symbols of fragments denote the cracking patterns of TBDMS-derivatized amino acids: (M-15)+, (M-57)+, (M-85)+, (M-159)+, f302, and side chain (sc) fragments.
| Fragments | Low-Nitrogen Cultivation | High-Nitrogen Cultivation | ||||||||||||||||||
| m | m+1 | m+2 | m+3 | m+4 | m+5 | m+6 | m+7 | m+8 | m+9 | m | m+1 | m+2 | m+3 | m+4 | m+5 | m+6 | m+7 | m+8 | m+9 | |
| M_ala_057 | 0.870 | 0.047 | 0.009 | 0.073 | 0.000 | 0.000 | 0.000 | 0.000 | 0.000 | 0.000 | 0.863 | 0.056 | 0.016 | 0.065 | 0.000 | 0.000 | 0.000 | 0.000 | 0.000 | 0.000 |
| M_ala_085 | 0.871 | 0.034 | 0.095 | 0.000 | 0.000 | 0.000 | 0.000 | 0.000 | 0.000 | 0.000 | 0.867 | 0.046 | 0.087 | 0.000 | 0.000 | 0.000 | 0.000 | 0.000 | 0.000 | 0.000 |
| M_asx_057 | 0.746 | 0.139 | 0.088 | 0.024 | 0.003 | 0.000 | 0.000 | 0.000 | 0.000 | 0.000 | 0.759 | 0.140 | 0.070 | 0.028 | 0.003 | 0.000 | 0.000 | 0.000 | 0.000 | 0.000 |
| M_asx_085 | 0.784 | 0.142 | 0.058 | 0.016 | 0.000 | 0.000 | 0.000 | 0.000 | 0.000 | 0.000 | 0.792 | 0.138 | 0.054 | 0.015 | 0.000 | 0.000 | 0.000 | 0.000 | 0.000 | 0.000 |
| M_asx_302 | 0.863 | 0.085 | 0.052 | 0.000 | 0.000 | 0.000 | 0.000 | 0.000 | 0.000 | 0.000 | 0.863 | 0.084 | 0.054 | 0.000 | 0.000 | 0.000 | 0.000 | 0.000 | 0.000 | 0.000 |
| M_glx_057 | 0.694 | 0.157 | 0.120 | 0.021 | 0.007 | 0.001 | 0.000 | 0.000 | 0.000 | 0.000 | 0.707 | 0.153 | 0.112 | 0.022 | 0.005 | 0.001 | 0.000 | 0.000 | 0.000 | 0.000 |
| M_glx_085 | 0.726 | 0.162 | 0.090 | 0.018 | 0.004 | 0.000 | 0.000 | 0.000 | 0.000 | 0.000 | 0.740 | 0.155 | 0.090 | 0.012 | 0.003 | 0.000 | 0.000 | 0.000 | 0.000 | 0.000 |
| M_glx_302 | 0.805 | 0.165 | 0.030 | 0.000 | 0.000 | 0.000 | 0.000 | 0.000 | 0.000 | 0.000 | 0.784 | 0.181 | 0.034 | 0.000 | 0.000 | 0.000 | 0.000 | 0.000 | 0.000 | 0.000 |
| M_gly_057 | 0.904 | 0.046 | 0.050 | 0.000 | 0.000 | 0.000 | 0.000 | 0.000 | 0.000 | 0.000 | 0.913 | 0.053 | 0.034 | 0.000 | 0.000 | 0.000 | 0.000 | 0.000 | 0.000 | 0.000 |
| M_gly_085 | 0.936 | 0.064 | 0.000 | 0.000 | 0.000 | 0.000 | 0.000 | 0.000 | 0.000 | 0.000 | 0.944 | 0.056 | 0.000 | 0.000 | 0.000 | 0.000 | 0.000 | 0.000 | 0.000 | 0.000 |
| M_his_057 | 0.711 | 0.158 | 0.019 | 0.063 | 0.016 | 0.026 | 0.006 | 0.000 | 0.000 | 0.000 | 0.743 | 0.126 | 0.040 | 0.041 | 0.014 | 0.035 | 0.001 | 0.000 | 0.000 | 0.000 |
| M_his_159 | 0.720 | 0.145 | 0.087 | 0.013 | 0.035 | 0.000 | 0.000 | 0.000 | 0.000 | 0.000 | 0.738 | 0.130 | 0.071 | 0.023 | 0.034 | 0.004 | 0.000 | 0.000 | 0.000 | 0.000 |
| M_his_302 | 0.869 | 0.058 | 0.073 | 0.000 | 0.000 | 0.000 | 0.000 | 0.000 | 0.000 | 0.000 | 0.884 | 0.024 | 0.093 | 0.000 | 0.000 | 0.000 | 0.000 | 0.000 | 0.000 | 0.000 |
| M_ile_015 | – | – | – | – | – | – | – | – | – | – | 0.686 | 0.141 | 0.112 | 0.034 | 0.015 | 0.000 | 0.012 | 0.000 | 0.000 | 0.000 |
| M_ile_085 | 0.719 | 0.142 | 0.110 | 0.023 | 0.006 | 0.002 | 0.000 | 0.000 | 0.000 | 0.000 | 0.719 | 0.135 | 0.115 | 0.025 | 0.005 | 0.001 | 0.000 | 0.000 | 0.000 | 0.000 |
| M_leu_015 | – | – | – | – | – | – | – | – | – | – | 0.721 | 0.066 | 0.179 | 0.016 | 0.013 | 0.005 | 0.000 | 0.000 | 0.000 | 0.000 |
| M_leu_085 | 0.719 | 0.121 | 0.133 | 0.019 | 0.007 | 0.000 | 0.000 | 0.000 | 0.000 | 0.000 | 0.726 | 0.121 | 0.129 | 0.017 | 0.006 | 0.001 | 0.000 | 0.000 | 0.000 | 0.000 |
| M_lys_057 | 0.648 | 0.135 | 0.084 | 0.039 | 0.014 | 0.000 | 0.080 | 0.000 | 0.000 | 0.000 | 0.699 | 0.134 | 0.091 | 0.060 | 0.011 | 0.005 | 0.000 | 0.000 | 0.000 | 0.000 |
| M_lys_159 | 0.702 | 0.168 | 0.098 | 0.022 | 0.010 | 0.000 | 0.000 | 0.000 | 0.000 | 0.000 | 0.717 | 0.131 | 0.119 | 0.023 | 0.006 | 0.004 | 0.000 | 0.000 | 0.000 | 0.000 |
| M_lys_302 | 0.733 | 0.249 | 0.018 | 0.000 | 0.000 | 0.000 | 0.000 | 0.000 | 0.000 | 0.000 | 0.780 | 0.202 | 0.018 | 0.000 | 0.000 | 0.000 | 0.000 | 0.000 | 0.000 | 0.000 |
| M_met_057 | 0.709 | 0.185 | 0.070 | 0.025 | 0.011 | 0.000 | 0.000 | 0.000 | 0.000 | 0.000 | 0.717 | 0.174 | 0.060 | 0.034 | 0.013 | 0.001 | 0.000 | 0.000 | 0.000 | 0.000 |
| M_met_085 | 0.733 | 0.184 | 0.056 | 0.023 | 0.005 | 0.000 | 0.000 | 0.000 | 0.000 | 0.000 | 0.760 | 0.160 | 0.051 | 0.028 | 0.001 | 0.000 | 0.000 | 0.000 | 0.000 | 0.000 |
| M_phe_057 | 0.604 | 0.123 | 0.098 | 0.100 | 0.046 | 0.013 | 0.011 | 0.000 | 0.004 | 0.001 | 0.626 | 0.121 | 0.081 | 0.103 | 0.044 | 0.012 | 0.008 | 0.003 | 0.001 | 0.000 |
| M_phe_085 | 0.628 | 0.116 | 0.139 | 0.056 | 0.040 | 0.008 | 0.011 | 0.001 | 0.002 | 0.000 | 0.638 | 0.114 | 0.134 | 0.053 | 0.042 | 0.010 | 0.007 | 0.001 | 0.001 | 0.000 |
| M_phe_302 | 0.875 | 0.041 | 0.083 | 0.000 | 0.000 | 0.000 | 0.000 | 0.000 | 0.000 | 0.000 | 0.891 | 0.032 | 0.077 | 0.000 | 0.000 | 0.000 | 0.000 | 0.000 | 0.000 | 0.000 |
| M_phe_sc | 0.558 | 0.181 | 0.064 | 0.052 | 0.044 | 0.024 | 0.041 | 0.035 | 0.000 | 0.000 | 0.582 | 0.164 | 0.000 | 0.095 | 0.054 | 0.048 | 0.032 | 0.025 | 0.000 | 0.000 |
| M_pro_057 | 0.748 | 0.147 | 0.104 | 0.000 | 0.000 | 0.002 | 0.000 | 0.000 | 0.000 | 0.000 | 0.743 | 0.131 | 0.099 | 0.022 | 0.004 | 0.001 | 0.000 | 0.000 | 0.000 | 0.000 |
| M_pro_085 | 0.767 | 0.130 | 0.088 | 0.011 | 0.003 | 0.000 | 0.000 | 0.000 | 0.000 | 0.000 | 0.756 | 0.134 | 0.098 | 0.010 | 0.003 | 0.000 | 0.000 | 0.000 | 0.000 | 0.000 |
| M_ser_057 | 0.832 | 0.099 | 0.043 | 0.026 | 0.000 | 0.000 | 0.000 | 0.000 | 0.000 | 0.000 | 0.849 | 0.100 | 0.034 | 0.017 | 0.000 | 0.000 | 0.000 | 0.000 | 0.000 | 0.000 |
| M_ser_085 | 0.855 | 0.114 | 0.031 | 0.000 | 0.000 | 0.000 | 0.000 | 0.000 | 0.000 | 0.000 | 0.874 | 0.108 | 0.018 | 0.000 | 0.000 | 0.000 | 0.000 | 0.000 | 0.000 | 0.000 |
| M_ser_302 | 0.895 | 0.042 | 0.063 | 0.000 | 0.000 | 0.000 | 0.000 | 0.000 | 0.000 | 0.000 | 0.901 | 0.050 | 0.049 | 0.000 | 0.000 | 0.000 | 0.000 | 0.000 | 0.000 | 0.000 |
| M_thr_057 | 0.761 | 0.164 | 0.054 | 0.020 | 0.000 | 0.000 | 0.000 | 0.000 | 0.000 | 0.000 | 0.767 | 0.132 | 0.066 | 0.030 | 0.006 | 0.000 | 0.000 | 0.000 | 0.000 | 0.000 |
| M_thr_085 | 0.726 | 0.167 | 0.093 | 0.014 | 0.000 | 0.000 | 0.000 | 0.000 | 0.000 | 0.000 | 0.800 | 0.132 | 0.051 | 0.017 | 0.000 | 0.000 | 0.000 | 0.000 | 0.000 | 0.000 |
| M_thr_sc | 0.735 | 0.222 | 0.043 | 0.000 | 0.000 | 0.000 | 0.000 | 0.000 | 0.000 | 0.000 | 0.718 | 0.226 | 0.055 | 0.000 | 0.000 | 0.000 | 0.000 | 0.000 | 0.000 | 0.000 |
| M_val_057 | 0.789 | 0.056 | 0.078 | 0.068 | 0.004 | 0.006 | 0.000 | 0.000 | 0.000 | 0.000 | 0.783 | 0.068 | 0.077 | 0.063 | 0.003 | 0.005 | 0.000 | 0.000 | 0.000 | 0.000 |
| M_val_085 | 0.795 | 0.056 | 0.133 | 0.009 | 0.007 | 0.000 | 0.000 | 0.000 | 0.000 | 0.000 | 0.792 | 0.060 | 0.133 | 0.009 | 0.006 | 0.000 | 0.000 | 0.000 | 0.000 | 0.000 |
| M_val_302 | 0.877 | 0.034 | 0.089 | 0.000 | 0.000 | 0.000 | 0.000 | 0.000 | 0.000 | 0.000 | 0.885 | 0.038 | 0.077 | 0.000 | 0.000 | 0.000 | 0.000 | 0.000 | 0.000 | 0.000 |
| M_tyr_057 | 0.613 | 0.116 | 0.101 | 0.106 | 0.028 | 0.009 | 0.013 | 0.009 | 0.000 | 0.005 | 0.625 | 0.106 | 0.087 | 0.103 | 0.048 | 0.016 | 0.006 | 0.006 | 0.001 | 0.002 |
| M_tyr_085 | 0.610 | 0.107 | 0.136 | 0.057 | 0.049 | 0.008 | 0.001 | 0.016 | 0.015 | 0.000 | 0.602 | 0.110 | 0.135 | 0.054 | 0.041 | 0.030 | 0.010 | 0.018 | 0.001 | 0.000 |
| M_tyr_302 | 0.887 | 0.037 | 0.076 | 0.000 | 0.000 | 0.000 | 0.000 | 0.000 | 0.000 | 0.000 | 0.885 | 0.033 | 0.082 | 0.000 | 0.000 | 0.000 | 0.000 | 0.000 | 0.000 | 0.000 |
Another strategy to check the data consistency of GC-MS is to compare the MDVs of different fragments that derived from same precursor. For example, Phe and Tyr are generally synthesized from phosphoenolpyruvate (PEP), so the redundant information for both amino acids should be identical. Based on this principle, it can be found in Table III that those fragments from Phe (M_phe_057, M_phe_085, and M_phe_302) have very similar MDVs to their counterparts from Tyr (M_tyr_057, M_tyr_085, and M_tyr_302), and no discrepancies were detected within the labeling patterns of the redundant amino acids.
Identification of an Active Metabolic Network and Silent Pathways in Heterotrophic Chlorella
On the basis of GC-MS measurement and amino acid biosynthesis schemes, the labeling patterns of both amino acids and their carbon backbone precursors in central metabolism were subsequently acquired. These mass distribution data offer new insight into cellular metabolism, including not only silent pathways but also flux indications of the network assembled with active reactions. Comprehensive analysis of such data provides critical information for the quantification of absolute metabolic flux rates.
In this study, we adopted a methodology named metabolic flux ratio analysis (Nanchen et al., 2007) to directly reveal an active metabolic network of Chlorella. Flux ratios obtained from labeling experiments and GC-MS analysis represent the fractional contribution of a pathway to a target metabolite pool. Thereby, the network structure, which relies on in vivo activities of different metabolic pathways, can be unraveled. All of these flux ratios inferred from labeling results are summarized in Figure 2. In these ratios, “pyruvate through the pentose phosphate [PP] pathway” was obtained from [1-13C]Glc labeling data and other ratios from the [U-13C]Glc labeling experiment. Together, they were in accordance with a metabolic network consisting of the Embden-Meyerhof pathway (EMP), the PP pathway, and the tricarboxylic acid (TCA) cycle. This suggests an intermediate metabolism in which anabolic and respiratory reactions are commonly assembled. The quantitative interpretations of these pathways are presented in the next section. Here, we provide local evidence for some inactive pathways. This information is essential to help minimize network complexity for net flux calculation.
Figure 2.

Origin of metabolic intermediates in C. protothecoides during nitrogen-limited (white bars) and nitrogen-sufficient (black bars) growth. Asterisks indicate results obtained from 100% [1-13C]Glc labeling experiments. Other results were from 10% U-13C-labeled and 90% unlabeled Glc cultures. In certain cases, the MS data permit the determination only of upper bounds (ub) or lower bounds (lb) on the origin of intermediates. Mean relative split ratios ± sd are given for parallel incubations. E4P, Erythrose-4-phosphate; G6P, Glc-6-P; GOX, glyoxylate shunt; Mal, malate; P5P, pentose-5-phosphate; tkt, transketolase.
Malic Enzyme
As shown in Figure 2, the fraction of pyruvate (Pyr) from malate via malic enzyme is below the detection limit whether growing Chlorella with high or low nitrogen concentrations. Malic enzyme plays a key role in controlling the extent of lipid accumulation in oleaginous yeast (Botham and Ratledge, 1979) and filamentous fungi (Wynn et al., 1999). In oleaginous species, NADP+-dependent malic enzyme is located in the cytoplasm (Holdsworth et al., 1988; Wynn et al., 1999; Ratledge, 2002) and is proposed to be physically attached to fatty acid synthase as part of the lipogenic metabolon; thus, it acts as the sole source of NADPH for fatty acid synthase. From the 13C-labeling data, the lack of malic enzyme activity in C. protothecoides can be concluded because the labeling pattern of the C2-C3 fragment in Pyr was unchanged when compared with that in PEP. Since the C2-C3 bond of malate is reconnected in the TCA cycle, the active malic enzyme is expected to result in differences of mass distribution between PEP2–3 and Pyr2–3. Therefore, it could be reasoned that the identical mass distribution between PEP2–3 and Pyr2–3 obtained in our experiment is the result of little or no activity of malic enzyme in heterotrophic Chlorella. This notion was further supported with NMR analysis (data not shown). Holdsworth et al. (1988) reported that in oleaginous yeast, malic enzyme activity was high under nitrogen-limited conditions, which were favorable to oil accumulation. In contrast to this, even though C. protothecoides demonstrated robust lipid-producing capacity under nitrogen-poor environments, enhanced malic enzyme activity, which provides NADPH for increased lipid synthesis, is not detected. This suggests that algal oil accumulation recruits reducing equivalents from other sources than from malic enzyme, reflecting a unique metabolic mechanism for algal lipid genesis.
Glyoxylate Shunt
The mass distribution of ion clusters also provided evidence of the in vivo activity of the glyoxylate shunt. The glyoxylate shunt bypasses the metabolic steps in the TCA cycle from isocitrate to malate. It serves an anaplerotic function for cell growth on acetate or fatty acids and replenishes the carbon skeletons withdrawn from the TCA cycle for biosynthesis. This pathway was generally considered to be active in the green alga Chlamydomonas reinhardtii grown on acetate (Boyle and Morgan, 2009). Besides, it also shows activity in both heterotrophic and mixotrophic metabolism of the cyanobacterium Synechocystis species PCC6803 (Yang et al., 2002). In our research, the activity of the glyoxylate shunt in C. protothecoides can be discerned from the fact that no excess intact C1-C2 and C3-C4 connectivities in oxaloacetate (OAA) via the glyoxylate shunt were found in both culture conditions. These results indicate that the glyoxylate shunt, which is generally considered to be required for heterotrophic growth of algae, is inactive in Chlorella grown on Glc.
Global Net-Flux Analysis for Active Reactions of Heterotrophic C. protothecoides
From the identified network topology and stoichiometric model of C. protothecoides, absolute flux rates were estimated. First, a metabolic reaction model (Supplemental Appendix S1) was established, and flux ratios were then implemented into the model as additional constraints to resolve this linear equation system that results from metabolite balancing. These flux ratios include Pyr through the PP pathway, OAA originating from PEP, PEP originating from OAA, OAA originating from glyoxylate, and the lower and upper bounds of Pyr originating from malate. Combining these ratios with biomass composition and extracellular rates, the stoichiometric matrix is overdetermined; thus, high-resolution net-flux maps of Chlorella cells are obtained by a least-squares parameter-fitting approach (Fig. 3).
Figure 3.

Flux maps of central carbon metabolism of C. protothecoides under sufficient (left) and limited (right) nitrogen conditions. The estimated net fluxes were percentages of the relative rates normalized to the Glc uptake rates, which were 0.80 mmol g−1 dry weight h−1 in the nitrogen-sufficient culture and 0.65 mmol g−1 dry weight h−1 in the nitrogen-limited culture. Directions of net fluxes are represented by arrows. The gray arrows indicate flux related to biomass formation. The flux distributions were obtained from the best fit to the quantitative physiological data and the constraints derived from the MS measurements. F6P, Fru-6-P; T3P, triose-3-phosphate; AcCoA, acetyl-CoA; ICT, isocitrate; AKG, α-ketoglutarate; S7P, sedoheptulose-7-phosphate. [See online article for color version of this figure.]
As shown in Figure 3, 40.5% of the Glc-6-P entered the PP pathway and 53.3% was catabolized through glycolysis in the high C/N ratios. The flux through PEP carboxylase was estimated to be 18.7% of the Glc uptake, which accounted for 19.7% of the OAA synthesized. The backward flux from the TCA cycle to glycolysis by PEP carboxykinase was found to be 18.1%. In comparison, it was observed that the carbon flux through the PP pathway accounted for 33.3% of the Glc input flux in the low C/N ratios. The carbon flux through PEP carboxylase and PEP carboxykinase was found to be 29.2% and 23.7%, respectively. In addition, in both conditions, high exchange rates in the phosphofructokinase-, aldolase-, and glyceraldehyde-3-phosphate-to-PEP conversions were observed, while Fru bisphosphatase and PEP synthase were demonstrated to be inactive during heterotrophic growth on Glc. For better understanding of net flux data, we provide more interpretation of key pathways below.
PP Pathway and Glycolysis
There are multiple clues indicating local activity of the oxidative PP pathway. As shown in Figure 2, the activity of transketolase and transaldolase in the PP pathway was reflected by boundary values of several flux ratios, such as PEP from transketolase, PEP from PP, pentose-5-phosphate from Glc-6-P, and erythrose-4-phosphate from pentose-5-phosphate. These ratios were calculated using U-13C-labeling data and are based upon specific principles described by Fischer and Sauer (2003). More exact information on carbon flow into glycolysis and the PP pathway can also be quantitatively calculated by using cells grown exclusively on [1-13C]Glc. It was demonstrated that 38.5% of the triose-3-phosphate was generated from the PP pathway and 61.5% was catabolized through glycolysis during nitrogen-poor cultivation. In comparison, the triose-3-phosphate originating from the PP pathway accounted for 28.9% of the input flux during nitrogen-sufficient growth. Noticeably, these results were based on labeling pattern analysis of Pyr. In standard methodology (Nanchen et al., 2007), Ser is adopted for calculating the fractional enrichment and partitioning ratio from glycolysis and that through the PP pathway, because it is derived from phosphoglycerate, which is the first 3C acid in the glycolytic route. However, as mentioned above, unlabeled Gly was added into the medium as a nitrogen source for growing Chlorella and thus diluted the 13C-labeling enrichments of both proteinogenic Gly and Ser. For these reasons, Ser was no longer suitable to be used as a labeling probe for distinguishing the PP pathway and the EMP pathway. In our analysis, Pyr was used instead. Since data from the U-13C-labeling experiment demonstrated that in vivo flux via PEP carboxylase is roughly equivalent to the backflow via PEP carboxykinase, the exchange flux between OAA and PEP has very little impact on the labeling enrichment of Pyr. Pyr is consequently considered to be derived from two pools: (1) triose-3-phosphate from the PP pathway or the EMP pathway; and (2) the gluconeogenic pathway via malic enzyme. The latter is ignored because U-13C data revealed low activity of Chlorella malic enzyme in both culture conditions. Hence, the labeling pattern of Pyr is merely affected by the relative split ratio of the PP pathway and glycolysis. Accordingly, Equation 5 (see “Materials and Methods”) was established, and net flux rates of glycolysis and the PP pathway were quantified under both high- and low-C/N environments, respectively.
PEP Carboxylase and PEP Carboxykinase
It can be seen that under nitrogen-limited conditions, there is a great interchange flux between PEP and OAA. The anaplerotic reaction catalyzed by PEP carboxylase replenished the TCA cycle with a carbon flux of 20.9%, while the backflow through PEP carboxykinase was up to 26.5% (Fig. 2). In comparison, the carbon flux through PEP carboxylase and PEP carboxykinase was increased to 29.6% and 30.2%, respectively, in nitrogen-sufficient conditions. These results indicate that due to the absence of the glyoxylate shunt in C. protothecoides grown on Glc, the anaplerotic function that converts metabolites to replenish the metabolic pools of the TCA cycle was exclusively fulfilled by PEP carboxylase. In addition, it can be concluded that C. protothecoides possesses PEP carboxykinase instead of malic enzyme to catalyze the gluconeogenic conversion of C4 to C3 metabolites. At the same time, ATP generated from this reaction could be utilized to satisfy the energy demand for various metabolic processes.
Cellular Energetics and Precursor Requirement for Lipid Metabolism
From the flux maps, the amount of carbon flow targeting into fatty acid pools can be clearly revealed. Under nitrogen-sufficient conditions, such flux via acetyl-CoA was identified to be 54.2% of the Glc input flux. In comparison, nitrogen limitation led de novo synthesis of fatty acids to account for 81.0% of the Glc input flux, which is much higher than that in the optimal nitrogen environment. To understand the redistribution of metabolic flux in response to environmental changes, the cellular energetics and precursor requirement for lipid biosynthesis were investigated on the basis of 13C constraint flux estimation. Table IV shows the amounts of reducing equivalents consumed for biosynthetic chemistry and generated from catabolism under different nitrogen environments. As can be seen, heterotrophic growth of Chlorella in both conditions requires large amounts of NADPH for biosynthesis, especially for the fatty acid synthesis, which consumes two molecules of NADPH for one reductive elongation cycle of the carbon chain. In total, Chlorella metabolism under nitrogen limitation, which allowed the synthesis of more lipids, had a 13.7% higher requirement of NADPH than that under nitrogen-sufficient conditions. NADPH was primarily generated from two sources during heterotrophic metabolism: the oxidative PP pathway catalyzed by Glc-6-P dehydrogenase or 6-phosphogluconate dehydrogenase, or the TCA cycle via isocitrate dehydrogenase. Comparing NADPH generation between the two experimental groups, it can be found that Chlorella cells containing higher proportions of lipid generated more reductants from the PP pathway. From the flux ratio data, Chlorella metabolizes 33.3% carbon flux into the PP pathway in the nitrogen-sufficient cultures, while the percentages increased to 40.5% in response to nitrogen limitation. This indicates that more carbon flux partitioning into the PP pathway is likely due to the biosynthetic demand for the reducing equivalents. A significant amount of NADPH was also provided by isocitrate dehydrogenase due to the high activity of the TCA cycle. However, in contrast to the PP pathway, isocitrate dehydrogenase in the TCA cycle produces approximately equal amounts of NADPH in different nitrogen concentrations. It seems that NADPH from the mitochondrial TCA cycle is difficult to be trapped for lipid metabolism, which occurs in the cytoplasm.
Table IV. Yield and consumption of NADPH in C. protothecoides metabolism.
Data were obtained from the flux distribution presented in Figure 3. Values are expressed in mol NADPH mol−1 Glc consumed. zwf, gnd, and icd represent Glc-6-P dehydrogenase, 6-phosphogluconate dehydrogenase, and isocitrate dehydrogenase, respectively.
| Condition | NADPH Yield | NADPH Consumption | ||||
| PP Pathway | TCA Cycle | Biosynthesis | ||||
| zwf | gnd | icd | Lipid | Protein | Nucleic Acid | |
| Low nitrogen | 0.406 | 0.406 | 0.774 | 1.438 | 0.106 | 0.040 |
| High nitrogen | 0.333 | 0.333 | 0.731 | 0.960 | 0.371 | 0.062 |
Carbon flux targeting into fatty acid pools also depends on altered concentrations of the building block, acetyl-CoA. To elucidate such flux control, we investigated divergent fluxes locally at this node, which can be either oxidized to carbon dioxide through the TCA cycle or used as a structural unit for oil synthesis. As shown in Figure 4, the amount of acetyl-CoA for fatty acid synthesis is 37.3% of the phosphoglycerate (PGA) input flux in nitrogen-sufficient culture, while the value increases to 49.5% in response to nitrogen limitation. Flux partitioning at acetyl-CoA was inflexible, because outgoing flux for lipid synthesis was correlated with the incoming, Pyr dehydrogenase-catalyzed flux. Visual inspection of the flux map demonstrates that the difference of carbon channeled into fatty acid synthesis was mainly due to the changed flux distribution at upstream nodes. As two key precursors for the biosynthesis of amino acids (e.g. Phe, Tyr, Ala, Val, Ile, Leu, etc.), PEP and Pyr are able to partition more flux into the amino acid pool with sufficient nitrogen supply. In addition, the net flux from interchange via ppc and ppk directly bypass more PEP into the TCA cycle in a standard nitrogen environment, thus resulting in the generation of less acetyl-CoA for lipid accumulation. These results suggest that oil synthesis represents a global intracellular event in which many key nodes and reactions are involved.
Figure 4.

Flux distribution at several branch points adjacent to fatty acid synthesis. The width of arrows is proportional to the flux of carbon through a particular step calculated from the flux estimates. The top and bottom numbers represent relative flux during nitrogen-sufficient and nitrogen-limited cultivation, respectively. [See online article for color version of this figure.]
Overall, 13C-based analysis of absolute metabolic rates provides a bird’s-eye view of flux distribution when Chlorella cells undergo cultivation with different levels of nitrogen concentration. Comparing flux profiles in these two conditions, it can be observed that most relative fluxes through branch points varied less than 20%, even though the net fluxes changed significantly in absolute magnitude. A similar case has been reported in other microorganisms. For example, high-throughput 13C flux analysis of 137 B. subtilis gene deletion mutants indicates that random gene deletions often affect absolute fluxes but not their relative distribution (Fischer and Sauer, 2005). Consistent with this, our results suggest that C. protothecoides maintains the stability of the metabolic network in response to nutrient starvation.
CONCLUSION
In this study, 13C labeling in the culture of C. protothecoides and subsequent GC-MS analysis of the samples indicated little or no activity of the glyoxylate shunt in heterotrophic Chlorella. More importantly, the labeling patterns of protein-bound amino acids from this oleaginous species brought several novel and interesting results that are of potentially important consequence for understanding algal lipid metabolism and improving biofuel production. It was observed that decreasing the concentration of Gly in culture medium lowered Glc uptake flux and cell growth rate but caused an enhancement of lipid proportion in biomass. Nevertheless, net flux analysis of culture containing 13C-labeled Glc shows that the network architecture and relative flux distribution of the cells were not notably altered when cells were subjected to nitrogen-limited stress, reflecting the stability of central carbon metabolism of algal cells in response to environmental perturbation. Apart from the rigidity of the metabolic network, it was also found that the PP flux under nitrogen-limited stress was approximately 21.6% more than that under optimal growth conditions. Such an enhanced flux is likely driven by additional demand for cytoplasmic NADPH, given the fact that little or no malic enzyme activity was detected. This systems biology knowledge will highlight genetic or metabolic engineering for fine-tuning of algal properties.
MATERIALS AND METHODS
The Strain and Cultivation Conditions
Microalga strain Chlorella protothecoides 0710 originally obtained from the Culture Collection of Alga at the University of Texas in Austin was used in this study. A chemically defined growth medium was developed for the 13C-labeling experiment. The culture medium (pH 6.3) contains KH2PO4 (0.7 g L−1), K2HPO4 (0.3 g L−1), MgSO4·7H2O (0.3 g L−1), FeSO4·7H2O (3 mg L−1), vitamin B1 (0.01 mg L−1), H3BO3 (2.86 mg L−1), Na2MoO4·2H2O (0.039 mg L−1), ZnSO4·7H2O (0.222 mg L−1), MnCl2·4H2O (1.81 mg L−1), and CuSO4·5H2O (0.074 mg L−1). Glc (10 g L−1) was utilized as a carbon substrate; 1 g L−1 or 0.1 g L−1 Gly was added to culture broths for creating different C/N ratios. Cultivations were started by inoculating a loop of a plate culture into 200 mL of medium and precultivating the cells in the dark for 5 d. The labeling experiment was performed in a 0.5-L shaking flask with 100 mL of the medium containing a 10%:90% (w/w) mixture of [U-13C]Glc (99%; Cambridge Isotope Laboratories):unlabeled Glc or 100% [1-13C]Glc (99%; Cambridge Isotope Laboratories). Temperature and the shaking rate of the incubator were held constant at 28°C and 200 rpm, respectively.
Cell growth was monitored by optical density measurements at 540 nm (OD540) using a UV/visible spectrophotometer (Pharmacia Biotech Ultrospec 2000). Samples were diluted to an appropriate concentration to keep the OD540 value between 0.2 and 0.8. For the determination of dry cell weight, duplicate samples of the culture were washed with distilled water and freeze dried overnight. The cell density corresponded to OD540 by the regression equation y = 0.4155x (r2 = 0.9933, P < 0.05), where y is the cell density (g dry cell weight L−1) and x is the absorbance of the suspension at 540 nm. Glc concentration in the culture broth was measured using an enzymatic bioanalyzer (SBA-40C; Shandong Academy of Sciences).
Sample Preparation and GC-MS Measurements
Sample preparation for the GC-MS measurement was followed by standard protocols (Nanchen et al., 2007). Midexponentially growing cells (OD540 = 1) in culture suspension were harvested by centrifugation, washed with distilled water, and subsequently hydrolyzed in 6 m HCl at 110°C for 12 h. The hydrolysate was dried overnight at around 80°C and dissolved in 50 μL of water-free dimethylformamide. For the GC-MS measurement, the amino acids should be derivatized prior to analysis. The dried hydrolysate was dissolved in N,N-dimethylformamide and then derivatized by TBDMS with 1% tert-butyl-dimethylchlorosilane at 85°C for 60 min. The sample in the organic phase was loaded on a GC-MS apparatus. For NMR measurement, the dried hydrolysate was dissolved in 600 μL of 0.1 m deuterium chloride in deuterium oxide and clarified by centrifugation. The amounts of biomass used for GC-MS and NMR measurements were approximately 10 and 100 mg (dry cell weight), respectively.
GC-MS was carried out using an Agilent GC-6890 gas chromatograph equipped with an Agilent HP-5MS column (30 m × 0.25 mm × 0.25 μm) that was directly connected to an MS-5975 mass spectrometer (Agilent). The helium was used as carrier gas to maintain the pressure of the column at 8.21 p.s.i. The oven temperature was initially held at 60°C for 2 min and then reached 180°C at 5°C min−1. The temperature was then raised to 260°C at 10°C min−1 and finally held at 260°C for 5 min. Other settings were as follows: 5-mL injection volume, 1:20 split ratio, and electron impact ionization at 70 eV. The MS device was operated in selected ion monitoring mode. The amino acids analyzed by GC-MS were Asp, Glu, Gly, His, Ile, Leu, Phe, Pro, Ser, Thr, Tyr, and Val.
NMR experiments were performed at 25°C and a 13C resonance frequency of 100.6 MHz using a spectrometer (AVANCE 500S; Bruker). The method for experiments and data processing was reported previously (Yang et al., 2002).
Isotopomer Analysis for Metabolic Network Identification
For metabolic flux ratio analysis, a mass isotopomer distribution vector, MDVα, is assigned on the basis of well-developed mathematical methodology (Nanchen et al., 2007).
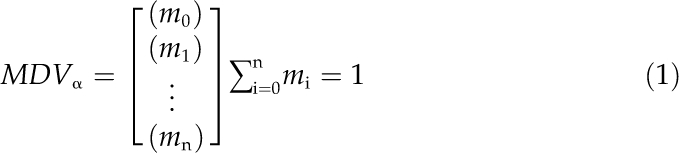 |
where m0 is the fractional abundance of molecules with monoisotopic mass and mi>0 is the abundance of fragments with heavier masses.
To obtain the exclusive mass isotope distribution of the carbon skeleton, the GC-MS data are corrected for the naturally occurring isotopes of oxygen (O), nitrogen (N), hydrogen (H), silicon (Si), sulfur (S), and carbon (C) atoms in the derivatization agent and in the amino acids using a correction matrix (Eq. 1) as described by Nanchen et al. (2007).
where MDVα* is the corrected mass isotopomer distribution vector and Ccorr,CONHSiS−1 is the correction matrix. It is produced from the correction matrices for all different atom species:
The resulting MDVα* values are used to assess the fractional labeling enrichment of each fragment using Equation 4.
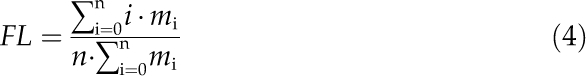 |
where n represents the number of amino acid carbon atoms in the considered fragment and i is the different mass isotopomers. The mass distribution of their precursors (DMVM) was then estimated by least-square fitting. In the case of U-13C labeling, several flux ratios, including (1) Pyr originating from malate, (2) PEP from OAA, (3) OAA from PEP, (4) PEP from transketolase, (5) PEP from the PP pathway, (6) pentose-5-phosphate from Glc-6-P, (7) OAA from the glyoxylate shunt, (8) erythrose-4-phosphate from pentose-5-phosphate, (9) Ser from Gly, and (10) Gly from Ser, were calculated from the MDVM with probabilistic equations. The calculating procedures were based on the general principle of flux ratio analysis (Fischer and Sauer, 2003; Yang et al., 2003; Nanchen et al., 2007) and were performed using a Matlab program written by us. Positional labeling pattern was also analyzed from cells grown exclusively on [1-13C]Glc to obtain precise information about the in vivo activities of the PP and EMP pathways. Pyr was used to quantify the relative contribution of the PP pathway to triose-3-phosphate synthesis with the following equation:
where FLPyr1–3 is the total fractional enrichment of Pyr with carbon C1-C2-C3, Pn is the natural abundance of the carbon atom, and f1 represents the fraction of Pyr originating from the PP pathway. f1 × Pn × 3 represents the FL that is contributed by the PP pathway. In this case, all three carbon atoms of Pyr remain unlabeled (natural enrichment). (1 − f1) × 0.5 × (1 + Pn × 5) represents the FL determined by the EMP pathway, since half a carbon atom in the C3 position is labeled with the 13C isotope. The explanation of the equation is described in “PP Pathway and Glycolysis.”
Reaction Network for Metabolite Balancing and Net-Flux Analysis
The stoichiometric model used for net-flux analysis of C. protothecoides was constructed. Network reactions in the glycolysis, PP pathway, and TCA cycle were constructed by integrating established biochemistry in the literature (Yang et al., 2000, 2002) and an internet-accessible genome database (http://genome.jgi-psf.org/ChlNC64A_1/ChlNC64A_1.home.html). In addition, the labeling results obtained throughout this work were also used to compile the network (for further details, see “Results and Discussion”). The metabolic reactions considered include 19 internal metabolites and 24 enzymatic reactions, as shown in the Supplemental Appendix S1.
The enzymes PEP carboxykinase, PEP carboxylase, and malic enzyme, which play important roles in balancing the metabolite pool between the TCA cycle and glycolysis, have been reported to be present in alga (Grotjohann and Hippe, 1993; Giordano and Bowes, 1997). Therefore, all of them are considered in the network. In addition, since the genome of Chlorella contains the genes of isocitrate lyase and malic synthase, which are responsible for the operation of the glyoxylate cycle, this pathway is also considered in the model.
For establishing respiratory reactions, 2.5 was adopted as the number of ATP produced per oxygen atom reduced (P/O ratio), according to previous reports (Yang et al., 2000). Until now, the presence of nicotinamide nucleotide transhydrogenase, which catalyzes the reversible transfer of hydride ion between NAD and NADP in Chlorella cells, was still unclear, so this reaction is omitted from the metabolic networks. In addition, since the localization of some biochemical reactions is not fully understood, subcellular compartmentation of metabolites between chloroplast, mitochondria, and cytoplasm was not taken into account in this study.
In order to construct the biomass equation, we measured the macromolecular composition of Chlorella from cell pellets. Specifically, the composition and contents of oil were measured by GC as described recently (Xiong et al., 2010). For establishing the stoichiometry of biomass components, lipids were normalized in the form of diacylglycerol, which is the key precursor in the synthesis of triacylglycerol and various other lipids.
The protein content was measured using the Lowry method (Hatate et al., 1998). The amino acid composition of Chlorella proteins was obtained by the L-8800 amino acid analyzer (Hitachi). The phenol-sulfuric acid method was utilized for determining intracellular carbohydrate and starch (Masuko et al., 2005). The percentage of nucleic acid was also calculated on the basis of experimental determination (Benthin et al., 1991).
Finally, all the above data, including (1) the stoichiometric reaction matrix, (2) the flux ratios derived from metabolic flux ratio analysis, (3) physiological data, and (4) precursor requirements for biomass synthesis, were utilized to calculate absolute fluxes in millimoles per gram of biomass per hour. Net fluxes were then estimated with Matlab by solving the stoichiometric matrix. The resulting flux distribution is the best fit to available data from both metabolite balances and tracer experiment-based flux ratios within the specified metabolic model.
Statistical Analysis
To evaluate the confidence for the intracellular flux distributions and investigate the sensitivity of the estimated values to the measurement inaccuracies, a Monte Carlo approach, which offers precise information on the error distribution of flux parameters (Mollney et al., 1999), was applied for statistical analysis. By using Matlab, normally distributed random errors were generated in the range of deviations for the triplicate MS measurements and the parallel incubations. Addition of these noises to the simulated measurement data set yielded multiple parameter estimation runs, in which the experimental data, measured mass isotopomer ratios, and extracellular fluxes were varied statistically. By this approach, the statistical analysis provides insight into confidence limits directly related to the corresponding tracer experiments and mass analysis is carried out.
Supplemental Data
The following materials are available in the online version of this article.
Supplemental Figure S1. 13C fractional labeling of proteinogenic amino acids during log phase growth.
Supplemental Table S1. Compositions of macromolecular components for C. protothecoides.
Supplemental Appendix S1. Stoichiometric reactions implemented in the central metabolic network of C. protothecoides.
Supplementary Material
References
- Benthin S, Nielsen J, Villadsen J. (1991) A simple and reliable method for the determination of cellular RNA content. Biotechnol Tech 5: 39–42 [Google Scholar]
- Blank LM, Kuepfer L, Sauer U. (2005) Large-scale 13C flux analysis reveals mechanistic principles of metabolic network robustness to null mutations in yeast. Genome Biol 6: R49. [DOI] [PMC free article] [PubMed] [Google Scholar]
- Botham PA, Ratledge C. (1979) Biochemical explanation for lipid accumulation in Candida-107 and other oleaginous microorganisms. J Gen Microbiol 114: 361–375 [DOI] [PubMed] [Google Scholar]
- Boyle NR, Morgan JA. (2009) Flux balance analysis of primary metabolism in Chlamydomonas reinhardtii. BMC Syst Biol 3: 4. [DOI] [PMC free article] [PubMed] [Google Scholar]
- Brune DE, Lundquist TJ, Benemann JR. (2009) Microalgal biomass for greenhouse gas reductions: potential for replacement of fossil fuels and animal feeds. J Environ Eng 135: 1136–1144 [Google Scholar]
- Del Campo JA, Rodriguez H, Moreno J, Vargas MA, Rivas J, Guerrero MG. (2004) Accumulation of astaxanthin and lutein in Chlorella zofingiensis (Chlorophyta). Appl Microbiol Biotechnol 64: 848–854 [DOI] [PubMed] [Google Scholar]
- Fischer E, Sauer U. (2003) Metabolic flux profiling of Escherichia coli mutants in central carbon metabolism using GC-MS. Eur J Biochem 270: 880–891 [DOI] [PubMed] [Google Scholar]
- Fischer E, Sauer U. (2005) Large-scale in vivo flux analysis shows rigidity and suboptimal performance of Bacillus subtilis metabolism. Nat Genet 37: 636–640 [DOI] [PubMed] [Google Scholar]
- Fischer E, Zamboni N, Sauer U. (2004) High-throughput metabolic flux analysis based on gas chromatography-mass spectrometry derived 13C constraints. Anal Biochem 325: 308–316 [DOI] [PubMed] [Google Scholar]
- Giordano M, Bowes G. (1997) Gas exchange and C allocation in Dunaliella salina cells in response to the N source and CO2 concentration used for growth. Plant Physiol 115: 1049–1056 [DOI] [PMC free article] [PubMed] [Google Scholar]
- Grotjohann N, Hippe C. (1993) 2 forms of phosphoenolpyruvate carboxylase in Chlorella kessleri. Z Naturforsch C Biosci 48: 556–562 [Google Scholar]
- Hatate H, Ohgai M, Murase N, Suzuki N. (1998) Estimation of protein content in marine microalgae using the Lowry method. Fish Sci 64: 168–169 [Google Scholar]
- Holdsworth JE, Veenhuis M, Ratledge C. (1988) Enzyme activities in oleaginous yeasts accumulating and utilizing exogenous or endogenous lipids. J Gen Microbiol 134: 2907–2915 [DOI] [PubMed] [Google Scholar]
- Hoon Yang T, Wittmann C, Heinzle E. (2006) Respirometric 13C flux analysis. Part II. In vivo flux estimation of lysine-producing Corynebacterium glutamicum. Metab Eng 8: 432–446 [DOI] [PubMed] [Google Scholar]
- Li Y, Horsman M, Wu N, Lan CQ, Dubois-Calero N. (2008) Biofuels from microalgae. Biotechnol Prog 24: 815–820 [DOI] [PubMed] [Google Scholar]
- Masuko T, Minami A, Iwasaki N, Majima T, Nishimura SI, Lee YC. (2005) Carbohydrate analysis by a phenol-sulfuric acid method in microplate format. Anal Biochem 339: 69–72 [DOI] [PubMed] [Google Scholar]
- Miao XL, Wu QY. (2006) Biodiesel production from heterotrophic microalgal oil. Bioresour Technol 97: 841–846 [DOI] [PubMed] [Google Scholar]
- Mollney M, Wiechert W, Kownatzki D, de Graaf AA. (1999) Bidirectional reaction steps in metabolic networks. IV. Optimal design of isotopomer labeling experiments. Biotechnol Bioeng 66: 86–103 [DOI] [PubMed] [Google Scholar]
- Nanchen A, Fuhrer T, Sauer U. (2007) Determination of metabolic flux ratios from 13C-experiments and gas chromatography-mass spectrometry data: protocol and principles. Methods Mol Biol 358: 177–197 [DOI] [PubMed] [Google Scholar]
- Ratledge C. (2002) Regulation of lipid accumulation in oleaginous micro-organisms. Biochem Soc Trans 30: 1047–1050 [DOI] [PubMed] [Google Scholar]
- Rosenberg JN, Oyler GA, Wilkinson L, Betenbaugh MJ. (2008) A green light for engineered algae: redirecting metabolism to fuel a biotechnology revolution. Curr Opin Biotechnol 19: 430–436 [DOI] [PubMed] [Google Scholar]
- Sansawa H, Endo H. (2004) Production of intracellular phytochemicals in Chlorella under heterotrophic conditions. J Biosci Bioeng 98: 437–444 [DOI] [PubMed] [Google Scholar]
- Schwender J. (2008) Metabolic flux analysis as a tool in metabolic engineering of plants. Curr Opin Biotechnol 19: 131–137 [DOI] [PubMed] [Google Scholar]
- Shi XM, Jiang Y, Chen F. (2002) High-yield production of lutein by the green microalga Chlorella protothecoides in heterotrophic fed-batch culture. Biotechnol Prog 18: 723–727 [DOI] [PubMed] [Google Scholar]
- Wang B, Li YQ, Wu N, Lan CQ. (2008) CO2 bio-mitigation using microalgae. Appl Microbiol Biotechnol 79: 707–718 [DOI] [PubMed] [Google Scholar]
- Williams TCR, Miguet L, Masakapalli SK, Kruger NJ, Sweetlove LJ, Ratcliffe RG. (2008) Metabolic network fluxes in heterotrophic Arabidopsis cells: stability of the flux distribution under different oxygenation conditions. Plant Physiol 148: 704–718 [DOI] [PMC free article] [PubMed] [Google Scholar]
- Wynn JP, Hamid ABA, Ratledge C. (1999) The role of malic enzyme in the regulation of lipid accumulation in filamentous fungi. Microbiology 145: 1911–1917 [DOI] [PubMed] [Google Scholar]
- Xiong W, Gao C, Yan D, Wu C, Wu Q. (2010) Double CO2 fixation in photosynthesis-fermentation model enhances algal lipid synthesis for biodiesel production. Bioresour Technol 101: 2287–2293 [DOI] [PubMed] [Google Scholar]
- Xiong W, Li XF, Xiang JY, Wu QY. (2008) High-density fermentation of microalga Chlorella protothecoides in bioreactor for microbio-diesel production. Appl Microbiol Biotechnol 78: 29–36 [DOI] [PubMed] [Google Scholar]
- Xu H, Miao XL, Wu QY. (2006) High quality biodiesel production from a microalga Chlorella protothecoides by heterotrophic growth in fermenters. J Biotechnol 126: 499–507 [DOI] [PubMed] [Google Scholar]
- Yang C, Hua Q, Baba T, Mori H, Shimizu K. (2003) Analysis of Escherichia coli anaplerotic metabolism and its regulation mechanisms from the metabolic responses to altered dilution rates and phosphoenolpyruvate carboxykinase knockout. Biotechnol Bioeng 84: 129–144 [DOI] [PubMed] [Google Scholar]
- Yang C, Hua Q, Shimizu K. (2000) Energetics and carbon metabolism during growth of microalgal cells under photoautotrophic, mixotrophic and cyclic light-autotrophic/dark-heterotrophic conditions. Biochem Eng J 6: 87–102 [DOI] [PubMed] [Google Scholar]
- Yang C, Hua Q, Shimizu K. (2002) Metabolic flux analysis in Synechocystis using isotope distribution from C-13-labeled glucose. Metab Eng 4: 202–216 [DOI] [PubMed] [Google Scholar]
- Yang C, Richardson AD, Osterman A, Smith JW. (2008) Profiling of central metabolism in human cancer cells by two-dimensional NMR, GC-MS analysis, and isotopomer modeling. Metabolomics 4: 13–29 [Google Scholar]
- Zamboni N, Fendt SM, Ruhl M, Sauer U. (2009) 13C based metabolic flux analysis. Nat Protoc 4: 878–892 [DOI] [PubMed] [Google Scholar]
Associated Data
This section collects any data citations, data availability statements, or supplementary materials included in this article.