Abstract
Different methods are used to assess the vasodilator ability of cerebral blood vessels; however, the exact mechanism of cerebral vasodilation, induced by different stimuli, is not entirely known. Our aim was to investigate whether the potent vasodilator agent, acetazolamide (AZ), inhibits the neurovascular coupling, which also requires vasodilation. Therefore, visually evoked flow parameters were examined by transcranial Doppler in ten healthy subjects before and after AZ administration. Pulsatility index and peak systolic flow velocity changes, evoked by visual stimulus, were recorded in the posterior cerebral arteries before and after intravenous administration of 15 mg/kg AZ. Repeated-measures ANOVA did not show significant group main effect between the visually evoked relative flow velocity time courses before and after AZ provocation (P=0.43). Visual stimulation induced significant increase of relative flow velocity and decrease of pulsatility index not only before but also at the maximal effect of AZ. These results suggest that maximal cerebral vasodilation cannot be determined by the clinically accepted dose of AZ (15 mg/kg) and prove that neurovascular coupling remains preserved despite AZ-induced vasodilation. Our observation indicates independent regulation of vasodilation during neurovascular coupling, allowing the adaptation of cerebral blood flow according to neuronal activity even if other processes require significant vasodilation.
Keywords: acetazolamide, cerebral vasodilation, neurovascular coupling, transcranial Doppler
Introduction
Different methods are used to assess the vasodilator ability of cerebral vessels, including carbon-dioxide and breath-holding tests, acetazolamide (AZ) test, investigation of neurovascular coupling, or autoregulation. Although extensively investigated, the exact mechanism of cerebral vasodilation is not entirely known in the different examination models. It is also not known exactly, whether the vasodilator effect of these methods is based on the same physiological process, or different stimuli use different pathways when cause vasodilation.
Acetazolamide is known as a potent vasodilator, which was reported to cause maximal cerebral vasodilation, allowing determination of maximal cerebrovascular reactivity (Dahl et al, 1995). However, both human (Gommer et al, 2008) and animal experiments (Démolis et al, 2000) proved that cerebral autoregulation is not totally inhibited after intravenous administration of AZ in 15 and 21-mg/kg doses, respectively, indicating that AZ in the applied doses does not exhaust cerebral autoregulation. These data suggest that cerebral vessels are still able to be dilated not only after administration of the clinically accepted dose of AZ in humans, but also after application of higher dose in animal experiments; therefore, maximal cerebrovascular reactivity cannot be determined in this way.
Neurovascular coupling is a sensitive method to test the function of cerebral vasculature. The activation–flow coupling describes a mechanism, which adapts local cerebral blood flow (CBF) in accordance with the underlying neuronal activity (Girouard and Iadecola, 2006). The adaptation of regional CBF is based on local vasodilation evoked by neuronal activation. According to the functional anatomy of the brain, neurovascular coupling can be easily and reliably examined by measurement of the visual stimulation-evoked flow changes in the posterior cerebral arteries (PCAs) (Rosengarten et al, 2003).
Since neuronal activation–CBF cerebral blood flow coupling requires vasodilation (Metea and Newman, 2006; Kitaura et al, 2007; Xu and Pelligrino, 2007), our aim was to investigate whether the potent vasodilator AZ inhibits the vasodilation during neurovascular coupling. Therefore, visually evoked flow changes were examined for 10 healthy, male subjects before and after AZ administration, using transcranial Doppler (TCD), which offers excellent temporal resolution, is noninvasive, and easily applicable for follow-up investigation. In parallel, the pulsatility index (PI) was also recorded to get information about vascular resistance.
Materials and methods
Ten healthy, male subjects between 20 and 45 years of age were included in the study. The study was approved by the local ethics committee and each subject gave written informed consent. Subjects with cerebrovascular risk factors; history of migraine, coronary, and peripheral artery diseases; or on regular medication were excluded. The included subjects did not take any medicine regularly. The study protocol included routine clinical laboratory tests, hemostasis screening test, serum lipid tests, and inflammatory marker tests. Blood was drawn after an overnight fast at 9 am, after the TCD examination. All subjects underwent complete neurological examination and extra- and intracranial duplex scans were performed to exclude neurological and vascular abnormalities.
Experimental Protocol
Transcranial Doppler probes of 2 MHz were mounted by an individually fitted headband in order to detect the flow parameters in the PCAs. In all cases, the P2 segment of the PCA was insonated on both sides at a depth of 58 mm. Peak systolic, end-diastolic, and mean blood flow velocities were recorded with a Multidop T2 Doppler device (DWL, Überlingen, Germany). Being less influenced by Doppler artifacts (Rosengarten et al, 2001), the peak systolic flow velocity index was used during the evaluation.
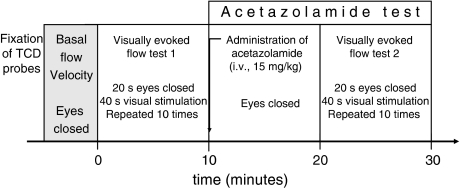
After fixation of TCD probes, basal flow parameters were recorded. The experiment was started with the first visually evoked flow test, followed by intravenous administration of AZ. To reach the maximal vasodilatory effect of the injected dose of AZ (15 mg/kg), the second visually evoked flow test was started only 10 mins after the AZ injection (Figure 1). Subjects' eyes were closed during the whole experiment except for the visual stimulation periods.
Figure 1.
The experimental protocol. After fixation of TCD probes, basal flow velocity was recorded. Visually evoked flow tests were performed before and after intravenous administration of 15 mg/kg AZ. The second visually evoked flow test was started 10 mins after AZ injection, at the maximal vasodilatory effect of AZ. The subjects' eyes were closed during the whole experiment except for the visual stimulation periods of the visually evoked flow tests.
Functional Transcranial Doppler Study
The functional TCD tests were performed in a quiet room at approximately 25°C while the subjects were sitting comfortably. All subjects had abstained from caffeine overnight before the study. Blood pressure and heart rate were measured noninvasively before the TCD examination, before and after AZ administration, and at the end of the experiment.
As a stimulation paradigm, we used a news magazine with emotionally neutral text, which the subjects could read freely. This ‘reading' test has been validated previously against a checkerboard stimulation paradigm (Rosengarten et al, 2003). The stimulation protocol consisted of 10 cycles, with a resting phase of 20 secs and a stimulation phase of 40 secs for each cycle. During the resting periods, subjects were instructed to close their eyes; during the stimulation phases, they read silently. Changes between phases were signaled acoustically with a tone.
Beat-to-beat intervals of CBF velocity data were interpolated linearly with a ‘virtual' time resolution of 50 ms for averaging procedures. For one person, flow velocity data of 10 cycles were averaged (Vascochecker software; DWL, Sipplingen, Germany). To ensure independence from the insonation angle and to allow comparisons between visually evoked flow velocity changes before and after AZ administration and between subjects, absolute data were transformed into relative changes of CBF velocity in relation to the proper baseline value. Baseline flow velocity was calculated from the blood flow velocities averaged for a time span of 5 secs at the end of the resting phase, before the beginning of the stimulation phase. Relative flow velocities were expressed as percent of baseline of the proper visually evoked flow test. Since two visually evoked flow tests were performed (before and after AZ administration), two baseline values were determined: one for the first visually evoked flow test before AZ administration (BLbef), and another for the second visually evoked flow test after AZ administration (BLaft).
Acetazolamide Test
Acetazolamide test was performed immediately after the first visually evoked flow test. AZ was administered in the sitting position intravenously at a dose of 15 mg/kg. Cerebral vasomotor reactivity was tested using TCD (Multidop T2 device, 2-MHz pulsed-wave probe) by insonating the P2 segment of both PCAs at 58-mm depth. The peak-systolic, end-diastolic, and mean flow velocities were continuously recorded. Since the peak systolic flow velocities in the PCAs were used for the measurement of the visually evoked flow changes, the AZ-induced vasoreactivity was also calculated from the changes of the peak systolic flow velocities in the PCAs, allowing comparison of vasomotor reactivity and visually evoked flow velocity changes. Relative peak systolic flow velocities during the AZ test were expressed as percent of the basal peak systolic flow velocity.
Pulsatility Index
The PI indicates the vascular resistance; therefore, PI was calculated during the whole experiment using the following equation (Lindegaard et al, 1985):
PI=(Peak systolic flow velocity−End-diastolic flow velocity)/Mean flow velocity.
Statistical Analysis
Data were expressed as means±s.d.. Results of bilateral measurements were averaged for one subject.
Repeated-measures analysis of variance (ANOVA) with Greenhouse–Geisser adjustments for the degrees of freedom was applied to compare absolute and relative changes of the visually evoked peak systolic flow velocities before and after AZ administration.
Effect of AZ was analyzed by paired t-test, comparing the basal peak systolic flow velocity before AZ with the flow velocities measured after AZ provocation. Paired t-test was used to compare the maximal increase of relative flow velocity and decrease of PI before and after AZ administration, and the blood pressure and heart rate at different time points of the experiment. A difference of P<0.05 was considered statistically significant.
Results
The mean age of participants was 33±6 years. All routine laboratory values (erythrocyte sedimentation rate, red cell count, white blood cell count, platelet number, sodium, potassium, glucose, blood urea nitrogen, creatinine level, liver enzymes, cholesterol and triglyceride) were in the normal range. Neither AZ administration nor visual stimulation had significant effect on heart rate or blood pressure (Table 1).
Table 1. Blood pressure and heart rate at different phases of the experiment.
| Before VEF1 | After VEF1 before AZ | After AZ before VEF2 | After VEF2 | |
|---|---|---|---|---|
| Systolic blood pressure | 121±6 mm Hg | 122±7 mm Hg | 123±6 mm Hg | 122±6 mm Hg |
| Diastolic blood pressure | 78±4 mm Hg | 79±4 mm Hg | 77±4 mm Hg | 77±5 mm Hg |
| Heart rate | 74±7 min−1 | 73±6 min−1 | 74±7 min−1 | 75±7 min−1 |
Abbreviations: AZ, acetazolamide; VEF, visually evoked flow.
Paired t-test did not reveal significant differences between the variables at different phases of the experiment.
VEF1: the first visually evoked flow test, before AZ administration.
VEF2: the second visually evoked flow test, after AZ administration.
Effect of Acetazolamide on the Peak Systolic Flow Velocity
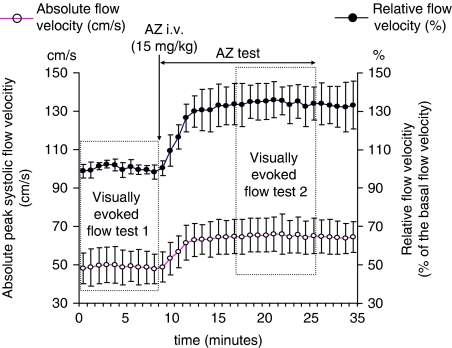
For evaluation of AZ's effect, the peak systolic flow velocity data, recorded during eye closure, were used. After administration of 15 mg/kg AZ, the peak systolic flow velocity increased already in the second minute, and remained significantly higher compared with the basal flow velocities (Figure 2). Flow velocity increase reached a plateau phase during the first 10 mins after AZ administration and did not change significantly in the remaining 10 mins, when the second visually evoked flow test was performed. The maximum increase, evoked by AZ in a 15 mg/kg dose, was 36%±9% as compared with basal flow velocity.
Figure 2.
Effect of AZ on peak systolic absolute (cm/s) and relative flow velocities (% of basal flow velocity) measured in the PCA before and during AZ test. Flow velocities were calculated every minute from the peak systolic flow velocities averaged for a time span of 5 secs when the subjects' eyes were closed. Basal flow velocity was recorded after fixation of TCD probes before the first visually evoked flow test, when the subjects' eyes were closed. Relative flow velocities were calculated in relation to the basal flow velocity, and were expressed in % of this value. Error bars indicate s.d. (Visually evoked flow test 1 and 2 indicate the time of the visually evoked flow tests.)
Visually Evoked Flow Velocity Changes Before and After Acetazolamide Administration
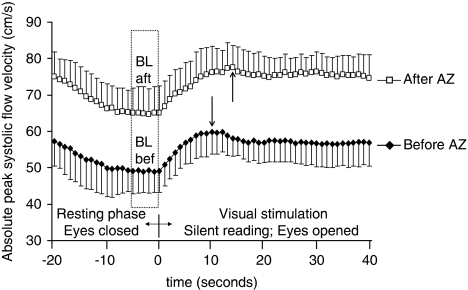
Similar increase of absolute flow velocities was observed during visual stimulation before and after AZ administration (Figure 3). The flow velocity either before or after AZ administration was significantly higher from the 2nd sec of the visual stimulation period as compared with the proper baseline value (BLbef, BLaft). Due to higher absolute flow velocities after AZ administration, the group (i.e., before and after AZ) main effect was highly significant (P<0.01) when repeated-measures ANOVA was performed. The maximum value was reached somewhat (4 secs) faster before than during AZ test (the group with time of measurement interaction was significantly different, P<0.01).
Figure 3.
Absolute peak systolic flow velocity time courses, measured during the visually evoked flow tests, before and after AZ administration. Observe the higher peak systolic flow velocity data after AZ administration. Significant increase of peak systolic flow velocities were induced by visual stimulation either before or after AZ administration. The arrows indicate the time of maximum peak systolic flow velocity during visual stimulation before (11 secs) and after (15 secs) AZ administration. Error bars indicate s.d. (The baseline was calculated from the blood flow velocities averaged for a time span of 5 secs at the end of the resting phase before /BLbef/, or after /BLaft / AZ administration.)
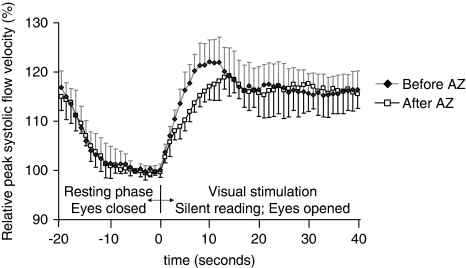
To compare the visually evoked flow velocity changes before and after AZ, relative flow velocities were calculated in relation to the proper baseline value (baseline before /BLbef/ or after AZ /BLaft/ Figures 3 and 4). Repeated-measures ANOVA did not reveal significant group (i.e., before and after AZ) main effect between the visually evoked relative flow velocity time courses (P=0.43) before and after AZ, indicating that relative flow velocities during visual stimulation were not significantly different before and after AZ provocation. The group with time of measurement interaction, however, was significant (P<0.01), which means that the pattern of flow velocity changes was different before and after AZ. Figure 4 shows that the steepness of the flow velocity increase was more pronounced before than after AZ provocation. The visually evoked maximal relative flow velocity was reached in the first half of visual stimulation. The maximal increase was 23±4% before and 19±4% after AZ administration; this difference disappeared when the flow velocity became stable at the second half of visual stimulation.
Figure 4.
Relative peak systolic flow velocity time courses, measured during the visually evoked flow tests, before and after AZ administration. Relative flow velocities were calculated in relation to the proper baseline value (baseline before /BLbef/ or after AZ /BLaft/). Repeated-measures ANOVA did not detect significant group (i.e., before and after AZ) main effect between the relative flow velocities during visual stimulation before and after AZ provocation. Error bars indicate s.d.
Visually Evoked Changes of Pulsatility Index Before and After Acetazolamide Administration
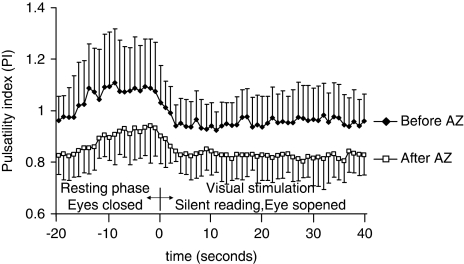
Due to the vasodilatory effect of the AZ, the PI was lower after than that before AZ administration (Figure 5). Decrease of PI was also observed during visual stimulation. The decrease of PI was significant already from the 2nd sec of the visual stimulation period, and remained significantly lower throughout the visual stimulation period as compared with that in the proper resting period, independent of being before or after AZ administration. The PI during visual stimulation decreased from 1.08±0.19 (at baseline) to 0.92±0.09 (at maximal decrease of PI) before AZ, and from 0.93±0.12 (at baseline) to 0.81±0.07 (at maximal decrease of PI) after AZ provocation. The measure of relative decrease of PI during visual stimulation was not significantly different before (15%±7%) and during (13%±4%) the AZ test (P=0.61). These data indicate that visual stimulation induced significant decrease of vascular resistance not only before but also at the maximal effect of the applied dose of AZ (15 mg/kg).
Figure 5.
Pulsatility index, measured during the visually evoked flow tests, before and after AZ administration. Significantly lower PI can be seen after AZ administration because of its vasodilatory effect. Visual stimulation caused significant decrease of PI not only before but also after AZ administration, indicating neuronal activation induced further vasodilation even at the maximal effect of AZ. Error bars indicate s.d.
Discussion
After AZ injection flow velocity increased and PI decreased significantly according to the vasodilator effect of AZ. Although AZ caused significant vasodilation at the dose used in our study, further increase of flow velocity and decrease of PI were observed during visual stimulation even at the maximal effect of the injected dose of AZ (15 mg/kg). These findings indicate further decrease of vascular resistance in the territory of PCA because of the visual stimulation-induced dilation of cerebral blood vessels. This study proves that neurovascular coupling remains preserved despite AZ-induced vasodilation; therefore, the vasodilatory mechanism during neurovascular coupling is supposed to be different from the mechanism of AZ-induced vasodilation. Our observation suggests independent regulation of vasodilation during neurovascular coupling, allowing adaptation of CBF according to neuronal activity even when other processes require significant vasodilation.
Our results are in line with the observation of Gommer et al (2008) who found that AZ at a dose of 15 mg/kg does not cause maximal cerebral vasodilation, and confirm the importance of standard circumstances during the AZ test. Although AZ tests are usually examined in the middle cerebral arteries, where the magnitude of flow velocity increase during neuronal activation is less than that in the PCA, different activities (hearing, thinking, finger movements) may influence the result of AZ test.
Dose of Acetazolamide and Time of Visual Stimulation After Acetazolamide Administration
Examination of different AZ doses between 5 and 18 mg/kg revealed significant dose-dependent AZ effect on CBF (Grossmann and Koeberle, 2000). Taking the severity of side effects into account, a 13-mg/kg AZ dose was recommended for the AZ tests. Similarly, Dahl et al (1995) also found significant correlation between maximal velocity increase and the dose and serum concentration of AZ. They concluded that the dose should probably exceed 15 mg/kg if a maximal vasodilatory response in the cerebral circulation is expected. Taking into account these two observations, we applied the dose of 15 mg/kg AZ to avoid severe side effects but to provide significant AZ reaction.
The other question was the time of the visually evoked flow test after AZ administration. As the plateau phase of the flow velocity response is reached 8 to 15 mins after AZ administration (Dahl et al, 1995), the second visually evoked flow test was decided to start 10 mins after AZ injection. In accordance with the observations of Dahl et al (1995) the plateau phase of the AZ induced flow velocity was reached within 10 mins and the maximal value after injection of 15 mg/kg AZ was recorded between 10 and 20 mins after the injection, exactly when the second visually evoked flow test was performed (Figure 2).
Independent Regulation of Neurovascular Coupling and Acetazolamide-Induced Vasodilation
The carbonic anhydrase enzyme could be detected inside the glial cells, in the choroid plexus, and is especially richly distributed in the endothelial cells of the brain capillaries, at the luminal side of the cell membrane. AZ inhibits the activity of carbonic anhydrase, which reversibly catalyses the formation of H2CO3 from CO2+H2O. It increases the concentrations of H+ and CO2, which is assumed to be the stimuli for the increase in flow; however, the exact mechanism is yet to be determined (Settakis et al, 2003).
The cellular bases of the mechanism of neurovascular coupling are also not known in details, but synaptic activity was shown to trigger an increase in the intracellular calcium concentration of adjacent astrocytes. Astrocytic Ca2+ elevations can lead to secretion of vasodilatory substances, such as epoxyeicosatrienoic acid, adenosine, nitric oxide, and cyclooxygenase-2 metabolites, from perivascular endfeet, resulting in increased local CBF (Jakovcevic and Harder, 2007). Thus, astrocytes by releasing vasoactive molecules may mediate the neuron–astrocyte–endothelial signaling pathway and play a profound role in coupling blood flow to neuronal activity (Iadecola and Nedergaard, 2007).
The different vasodilatory pathways may explain why further and significant vasodilation, and consequent flow velocity increase, may occur during neuronal activation even at the maximal vasodilatory effect of the applied dose of AZ. Our results suggest that these mechanisms are independent, allowing additional vasodilation during neurovascular coupling even when other processes already induced significant dilation of cerebral vessels.
Independent regulation of neurovascular coupling was also reported during different levels of autoregulatory challenges. Azevedo et al (2007) reported no significant changes in the visually evoked flow response at different orthostatic conditions with significant variation of blood pressure, indicating independent control of cerebral autoregulation and neurovascular coupling.
In conclusion, our study proved that the neurovascular coupling remained preserved even when the applied dose of AZ had the largest vasodilatory effect. The independent regulation of vasodilation during neurovascular coupling may allow adaptation of local CBF according to the metabolic demand of underlying neuronal activity even when other processes require significant vasodilation. Further experimental study should be performed to answer the question whether neurovascular coupling is still preserved at higher AZ doses.
Acknowledgments
This work was conducted at the Department of Neurology, University of Debrecen, Hungary.
Footnotes
Conflict of interest
The authors declare no conflict of interest.
References
- Azevedo E, Rosengarten B, Santos R, Freitas J, Kaps M. Interplay of cerebral autoregulation and neurovascular coupling evaluated by functional TCD in different orthostatic conditions. J Neurol. 2007;254:236–241. doi: 10.1007/s00415-006-0338-1. [DOI] [PubMed] [Google Scholar]
- Dahl A, Russell D, Rootwelt K, Nyberg-Hansen R, Kerty E. Cerebral vasoreactivity assessed with transcranial Doppler and regional cerebral blood flow measurements. Dose, serum concentration, and time course of the response to acetazolamide. Stroke. 1995;26:2302–2306. doi: 10.1161/01.str.26.12.2302. [DOI] [PubMed] [Google Scholar]
- Démolis P, Florence G, Thomas L, Tran Dinh YR, Giudicelli JF, Seylaz J, Alkayed NJ. Is the acetazolamide test valid for quantitative assessment of maximal cerebral autoregulatory vasodilation? An experimental study. Stroke. 2000;31:508–515. doi: 10.1161/01.str.31.2.508. [DOI] [PubMed] [Google Scholar]
- Girouard H, Iadecola C. Neurovascular coupling in the normalbrain and in hypertension, stroke, and Alzheimer disease. J Appl Physiol. 2006;100:328–335. doi: 10.1152/japplphysiol.00966.2005. [DOI] [PubMed] [Google Scholar]
- Gommer ED, Staals J, van Oostenbrugge RJ, Lodder J, Mess WH, Reulen JP. Dynamic cerebral autoregulation and cerebrovascular reactivity: a comparative study in lacunar infarct patients. Physiol Meas. 2008;29:1293–1303. doi: 10.1088/0967-3334/29/11/005. [DOI] [PubMed] [Google Scholar]
- Grossmann WM, Koeberle B. The dose-response relationship of acetazolamide on the cerebral blood flow in normalsubjects. Cerebrovasc Dis. 2000;10:65–69. doi: 10.1159/000016027. [DOI] [PubMed] [Google Scholar]
- Iadecola C, Nedergaard M. Glial regulation of the cerebral microvasculature. Nat Neurosci. 2007;10:1369–1376. doi: 10.1038/nn2003. [DOI] [PubMed] [Google Scholar]
- Jakovcevic D, Harder DR. Role of astrocytes in matching blood flow to neuronal activity. Curr Top Dev Biol. 2007;79:75–97. doi: 10.1016/S0070-2153(06)79004-4. [DOI] [PubMed] [Google Scholar]
- Kitaura H, Uozumi N, Tohmi M, Yamazaki M, Sakimura K, Kudoh M, Shimizu T, Shibuki K. Roles of nitric oxide asa vasodilator in neurovascular coupling of mouse somatosensory cortex. Neurosci Res. 2007;59:160–171. doi: 10.1016/j.neures.2007.06.1469. [DOI] [PubMed] [Google Scholar]
- Lindegaard KF, Bakke SJ, Grolimund P, Aaslid R, Huber P, Nornes H. Assessment of intracranial hemodynamics in carotid artery disease by transcranial Doppler ultrasound. J Neurosurg. 1985;63:890–898. doi: 10.3171/jns.1985.63.6.0890. [DOI] [PubMed] [Google Scholar]
- Metea MR, Newman EA. Glial cells dilate and constrict blood vessels: a mechanism of neurovascular coupling. J Neurosci. 2006;26:2862–2870. doi: 10.1523/JNEUROSCI.4048-05.2006. [DOI] [PMC free article] [PubMed] [Google Scholar]
- Rosengarten B, Aldinger C, Kaufmann A, Kaps M. Comparison of visually evoked peak systolic and end diastolic blood flow velocity using a control system approach. Ultrasound Med Biol. 2001;27:1499–1503. doi: 10.1016/s0301-5629(01)00464-1. [DOI] [PubMed] [Google Scholar]
- Rosengarten B, Aldinger C, Spiller A, Kaps M. Neurovascular coupling remains unaffected during normalaging. J Neuroimaging. 2003;13:43–47. [PubMed] [Google Scholar]
- Settakis G, Molnar C, Kerenyi L, Kollar J, Legemate D, Csiba L, Fulesdi B. Acetazolamide asa vasodilatory stimulus in cerebrovascular diseases and in conditions affecting the cerebral vasculature. Eur J Neurol. 2003;10:609–620. doi: 10.1046/j.1468-1331.2003.00675.x. [DOI] [PubMed] [Google Scholar]
- Xu HL, Pelligrino DA. ATP release and hydrolysis contribute to rat pial arteriolar dilatation elicited by neuronal activation. Exp Physiol. 2007;92:647–651. doi: 10.1113/expphysiol.2006.036863. [DOI] [PubMed] [Google Scholar]


