

Abstract
The effect of carbon dioxide (CO2) on cerebral metabolism is of tremendous interest to functional imaging. In particular, mild-to-moderate hypercapnia is routinely used in calibrated blood oxygen-level dependent (BOLD)-functional magnetic resonance imaging (fMRI)-based quantification of cerebral oxidative metabolism changes (ΔCMRO2), and relies on the assumption of a stable CMRO2 during CO2 challenges. However, this assumption has been challenged by certain animal studies, necessitating its verification in humans and under conditions customary to fMRI. We report, for the first time, on global ΔCMRO2 measurements made noninvasively in humans during graded hypercapnia and hypocapnia. We used computerized end-tidal CO2 modulation to minimize undesired concurrent changes in oxygen pressure, and our findings suggest that no significant change in global CMRO2 is expected at the levels of end-tidal CO2 changes customary to calibrated BOLD.
Keywords: BOLD, hypercapnia, CMRO2, fMRI, CO2, CBF
Introduction
Carbon dioxide (CO2) is a potent vasodilator, and its effect on cerebral metabolism is of great interest. Notably, hypercapnia is routinely used in calibrated blood oxygen-level dependent (BOLD) functional magnetic resonance imaging (fMRI) for estimating changes in cerebral oxygen metabolism (ΔCMRO2), but this methodology is contingent upon the assumption of negligible ΔCMRO2 during hypercapnia-induced cerebral blood flow (CBF) increases (Davis et al, 1998; Hoge et al, 1999). Although CMRO2 behavior under manipulations of end-tidal partial pressure of CO2 (PETCO2) has been investigated previously in animals (Hino et al, 2000; Horvath et al, 1994; Jones et al, 2005; Martin et al, 2006; McPherson et al, 1991; Yang and Krasney, 1995; Zappe et al, 2008), the wide range of anesthetic agents used, compounded by the diverging levels of PETCO2 perturbations involved, has made it difficult to draw definitive conclusions regarding the CMRO2 response during hypercapnia and hypocapnia with regard to human fMRI. Furthermore, the sampling intervals in these experiments were largely inadequate to capture the dynamic CMRO2 changes related to transient metabolic responses, and the PETCO2 manipulations were too severe to be directly interpreted for human fMRI.
In spite of this need for verification, CMRO2 invariability has yet to be established for the range of PETCO2 values relevant for functional imaging, as the corresponding experiments are technically demanding. Conventionally, human cerebral oxidative metabolism has been assessed invasively through arteriovenous blood oxygenation differences, obtained through internal jugular catheterization. In this study, we build on this well-established concept, and estimate CMRO2 changes from flow and oxygenation data using a magnetic resonance-equivalent of the Kety–Schmidt technique. In particular, we use pulsed arterial-spin labeling (PASL), phase-contrast (PC) flow imaging, as well as in vivo magnetic resonance oximetry to measure whole-brain CBF and CMRO2 changes noninvasively in awake humans during graded hypercapnia and hypocapnia. We show that at the levels of PETCO2 perturbations routinely used in calibrated BOLD, there is no significant global change in CMRO2.
Materials and methods
All acquisitions were performed using a Siemens Trio 3-T system (Siemens, Erlangen, Germany) on 10 healthy adult subjects (age=25.3±3.6 years, 5 women) who gave informed consent according to the protocols specified by our Institutional Review Board. The body coil was used for radio frequency transmission and a phased-array neurovascular coil for reception. A three-dimensional 1-mm isotropic resolution T1-weighted (FLASH (fast low-angle shot)) scan served as the anatomic reference for each subject. Venous blood T2 was obtained in vivo for each subject in both jugular veins (at the neck level, immediately above the facial vein drainage) using a magnetization-prepared segmented echo-planar imaging sequence (Chen and Pike, 2009; Stefanovic and Pike, 2004). From these T2 measurements, venous oxygenation (Y) was estimated using the calibration relationship (T2 dependence on blood oxygenation and Carr-Purcell-Meiboom-Gill (CPMG) refocusing interval) obtained by Chen and Pike (2009) based on in vitro whole human blood relaxometry (Chen and Pike, 2009) and the weak field-inhomogeneity diffusion model (Jensen and Chandra, 2001). Each oximetry measurement lasted 4.5 minutes. In addition, ΔCBF changes were measured using PICORE (proximal inversion with a control for off-resonance effects)-QUIPSS (quantitative imaging of perfusion using a single subtraction) II PASL with asymmetric BASSI (bandwidth-modulated adiabatic selective saturation and inversion) saturation/inversion (Warnking and Pike, 2006) and ASSIST (attenuating the static signal in arterial spin tagging) background suppression (Ye et al, 2000). The imaged slab was positioned approximately parallel to the AC-PC (anterior commissure-posterior commissure) line. It covered 8 slices of 5 mm (separated by 1-mm gaps), with field of view=256 mm, matrix size=64 × 64, repetition time=5 seconds, TI1 (inversion time)=700 milliseconds, TI2=1,300 milliseconds, echo time=25 milliseconds, labeling thickness=150 mm, and labeling gap=5 mm. Using the ‘Head' and ‘Neck' modes of the neurovascular coil, we optimized the signal-to-noise characteristics for both whole-brain and neck-level acquisitions.
Mild and moderate levels of hypercapnia and hypocapnia were induced through the administration of mixtures of CO2 and medical air using the RespirAct breathing circuit (Thornhill Research, Toronto, ON, Canada), which provided computerized and independent targeting of PETCO2 and PETO2 (partial pressure of end-tidal oxygen) based on sequential gas delivery (Slessarev et al, 2007). This device provided high stability in PETCO2 targeting, while maintaining significantly more constant PETO2 levels than manual methods, both of which are crucial to the accurate quantification of CMRO2 changes due solely to PETCO2 changes. Each 12-minute PASL measurement consisted of three (60 seconds off:180 seconds on:120 seconds off) paradigms. In addition, two-dimensional cine PC flow data were obtained from five subjects in the internal carotid and vertebral arteries. These vessels account for the majority of cerebral inflow, and the corresponding PC acquisition (2.5 minutes) was used for cross-validation with the PASL data as a measure of global CBF. A finger pulse oximeter provided cardiac triggering and arterial oxygen data.
For each functional run of each subject, subject-specific brain masks were derived by applying an intensity threshold to the PASL control images. The resultant masks were manually verified to ensure exclusion of extracerebral structures, and applied to the PASL data to assess global flow changes. Using the venous Y measurements, ΔCMRO2 and the neurovascular coupling ratio were estimated on the basis of equation (1), which was derived from the Fick principle (Kety and Schmidt, 1948),
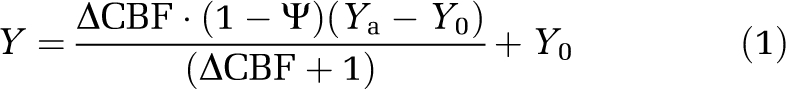 |
where Ψ=ΔCMRO2/ΔCBF, Ya and Y0 are arterial and baseline venous oxygenation levels, respectively. Unconstrained weighted nonlinear least-square curve-fitting (trust-region method) was used to fit the data to the model, with weightings proportional to the inverse s.d. of the individual measurements. All statistical analyses were performed after outlier removal.
Results and Discussion
Typical PASL, internal jugular venous relaxometry, and internal-carotid PC flowmetry images are shown in Figure 1. The average estimated baseline venous oxygenation (Y0) was 58.2%±8.2% (mean±s.d.), corresponding to an average normocapnic PETCO2 of 39.9±1.4 mm Hg. The mean measured Ya as assessed using pulse oximetry was ∼98%, in line with literature values (Valdez-Lowe et al, 2009; Wagener and Hendricker, 1987). The ΔPETCO2 measurements associated with all four levels of challenge, namely mild and moderate hypercapnia and hypocapnia, as categorized by fuzzy-cluster classification of the measured ΔPETCO2 values, are summarized in Table 1. Stability in PETO2 was maintained during PETCO2 manipulations in all cases, as exemplified in Figure 2. The corresponding ΔCBF and ΔY measurements are also listed in Table 1. A significant difference in ΔPETCO2 was found between mild and moderate hypercapnia (P=3.42 × 10⁻¹⁰), as well as between mild and moderate hypocapnia (P=9.74 × 10⁻⁸). The same was true for ΔCBF (P=7.92 × 10⁻⁷) and ΔY (P=5.01 × 10⁻⁴) for hypercapnia, but not for hypocapnia (mild versus moderate hypocapnia, P=0.11 and P=0.43 for ΔCBF and ΔY differences, respectively). In general, the vascular reactivity to hypercapnia was higher than to hypocapnia, reflected by the ΔCBF:ΔPETCO2 ratios (P=0.004). However, the ΔY:ΔCBF ratios were higher for hypocapnia than for hypercapnia (P=0.01). These two ratios were not significantly modulated by the severity of the challenge.
Figure 1.

(A) The multislice pulsed arterial-spin labeling (PASL) measurements of cerebral blood flow (CBF) changes (in top box) were compared with phase-contrast flow measurements obtained at the neck level (the bottom box), wherein in vivo jugular oximetry was also performed. A typical CBF activation t-map obtained from PASL and a brain mask derived through intensity thresholding are shown in B and C, respectively. The PASL measurements were validated using phase-contrast magnetic resonance imaging (MRI) measurements in the internal carotid (ICAs) and vertebral arteries (VAs), labeled in D. Finally, venous blood oxygenation measurements were performed using internal jugular vein (IJV) MR oximetry (E).
Table 1. Physiologic measurements at all four levels of PETCO2 manipulation (mean±s.d.); statistically significant differences are denoted by asterisks (*).
| Challenge | Level | N | ΔPETCO2 (mm Hg) | ΔCBF (%) | ΔY (%) | ΔCBF:ΔPETCO2 (%/mm Hg) | ΔY:ΔCBF (%/%) | Ψ (%/%) | ΔCMRO2 (%) |
|---|---|---|---|---|---|---|---|---|---|
| Hypercapnia | Mild | 10 | 4.7±0.3 | 23.6±3.0 | 4.9±2.0 | 5.2±0.7 | 0.26±0.05 | 0.30±0.17 | 5.0±3.0 |
| Moderate | 11 | 9.0±0.3 | 53.3±3.1 | 16.9±2.1 | 5.9±0.3 | 0.36±0.05 | −0.21±0.16 | −6.8±8.0 | |
| Hypocapnia | Mild | 10 | −2.9±0.2 | −13.2±2.1 | −7.5±3.0 | 4.7±0.8 | 1.40±0.57 | 0.18±0.60 | 10.2±3.0 |
| Moderate | 9 | −5.8±0.3 | −16.9±2.0 | −12.7±2.0 | 5.2±0.7 | 0.76±0.25 | −0.24±0.60 | 12.5±9.1 | |
| Hypocapnia versus hypercapnia | P=0.004* | P=0.01* | P>0.99 | P=0.04* | |||||
| Mild versus moderate challenges | P=0.29 | P=0.18 | P>0.99 | P=0.21 | |||||
CBF, cerebral blood flow; ΔCMRO2, cerebral oxidative metabolism change; PETCO2, end-tidal partial pressure of CO2.
The means were weighted by the inverse of the measurement uncertainties. No significant difference in Ψ was found between mild and moderate hypercapnia (P>0.99), or between mild and moderate hypocapnia (P>0.99). Moreover, the Ψ estimates computed from all hypercapnic (Ψ=−0.12±0.11, mean±s.d.) and from all hypocapnic (Ψ=0.06±0.30) cases did not differ significantly (P>0.99).
Figure 2.

(A) Moderate hypercapnia and (B) moderate hypocapnia end-tidal partial pressure of CO2 (PETCO2) and PETO2 tracings (top two plots) for a representative subject show that PETO2 remained largely unchanged during PETCO2 manipulations, an important aspect in delivering CO2 challenges in functional magnetic resonance imaging (fMRI). The bottom plots are the corresponding group-averaged global pulsed arterial-spin labeling (PASL) ΔCBF time courses.
Whole-brain PASL ΔCBF in the whole-brain masks and PC flow measurements were found to be equivalent, as detailed in Table 2. Using PASL-based global ΔCBF, global ΔCMRO2 and Ψ values were estimated for each challenge. The ΔCMRO2 values computed on the basis of equation (1), did not differ significantly between mild and moderate levels of hypercapnia (P=0.11) or hypocapnia (P=0.40). Neither differences were observed when comparing between mild and moderate (hypercapnia+hypocapnia) challenges (P=0.21), but ΔCMRO2 during hypercapnic and hypocapnic (mild+moderate) challenges were found to differ (P=0.04). This trend remained when comparing hypercapnic and hypocapnic conditions solely at the moderate level, but did not reach statistical significance (P=0.06). With regard to the extent of CBF–CMRO2 coupling, no significant difference in Ψ was found between mild and moderate hypercapnia (P>0.99); similar findings apply to mild and moderate hypocapnia (P>0.99). Similarly, the values of Ψ computed from all hypercapnic (Ψ=−0.12±0.11) and from all hypocapnic (Ψ=0.06±0.30, mean±s.d.) cases did not differ significantly (P>0.99). Thus, a single fit was performed on data across all subjects and challenges, yielding Ψ=−0.12±0.14, with a correlation of 0.78 and a root-mean-squared error of 1.37% (Figure 3), which is indistinguishable from zero (P>0.99). We did not observe a significant difference (P>0.99) between Ψ estimated using PASL and PC flowmetry (Ψ=0.02±0.17). Finally, assuming Ψ=0, and using the measured ΔCBF, the expected venous oxygenation was calculated on the basis of equation (1) for all conditions. The resulting Y values were not significantly different from the corresponding measured values (P=0.48). We further noted that although we adopted the group mean arterial oxygenation of 98% for these calculations, coinciding with commonly assumed values (Hoogenraad et al, 1998), our observations were robust against physiologically plausible variations in arterial oxygenation. For Ya varying between 96 and 100%, the resultant fractional uncertainties ΔCMRO2 and Ψ were both within ∼10%.
Table 2. Comparison of hypercapnic CBF modulation measured using PASL and PC techniques.
| Level | PASL | PC | ||||||
|---|---|---|---|---|---|---|---|---|
| ΔCBF (%) | ΔY (%) | ΔY:ΔCBF (%/%) | ΔCMRO2 (%) | ΔCBF (%) | ΔY (%) | ΔY:ΔCBF (%/%) | ΔCMRO2 (%) | |
| Mild | 23.6±3.0 | 4.9±2.0 | 0.26±0.05 | 5.0±3.0 | 22.0±6.9 | 5.4±1.2 | 0.3±0.1 | 5.3±3.4 |
| Moderate | 53.3±3.1 | 16.9±2.1 | 0.36±0.05 | −6.8±8.0 | 30.7±8.7 | 11.0±1.7 | 0.5±0.2 | −4.3±7.0 |
| Both | N/A | N/A | 0.34±0.04 | −1.5±4.7 | N/A | N/A | 0.4±0.1 | 0.5±0.9 |
| Mild versus moderate | N/A | N/A | P=0.23 | P=0.11 | N/A | N/A | P=0.09 | P=0.15 |
CBF, cerebral blood flow; ΔCMRO2, cerebral oxidative metabolism change; N/A, not applicable; PASL, pulsed arterial-spin labeling; PC, phase contrast; PETCO2, end-tidal partial pressure of CO2.
The PASL and PC experiments used similar levels of PETCO2 perturbations, and the corresponding derived parameters, ΔY:ΔCBF and ΔCMRO2, did not differ significantly.
Figure 3.

The relationship derived from the nonlinear fit of the data (closed dots) to the model (mesh) are shown, and the model fit was characterized by a correlation coefficient of R=0.78 and a root-mean-square error of 1.37%. The finding of a small Ψ (−0.12±0.14) shows that global CMRO2 is largely invariant during these challenges.
Our measurement of cerebral venous oxygenation (Y) by T2-based magnetic resonance oximetry was in good agreement with jugular bulb measurements (McCormick et al, 1991), and covaried with CBF. Moreover, the comparability between PASL and PC measurements of the CBF response to graded hypercapnia and hypocapnia supports the use of PASL for measuring whole-brain CBF changes. In addition, our observations of cerebral vascular reactivity to hypercapnia are in line with previous reports (McPherson et al, 1991; Noth et al, 2006). Our flow and oximetry methodology derives from principles similar to those shown recently by Xu et al (2009), although venous flow was used in the latter case and is customarily more challenging to assess than arterial flow. Notwithstanding, a unique advantage of our methodology is our strict control of PETO2 during CO2 manipulations. It is well known that conventional approaches to PETCO2 manipulation can introduce nonnegligible variations in PETO2; increases in PETO2, consistently observed during hypercapnic challenges in the literature, can effectively undermine the effect of CO2 (Losert et al, 2002) and hence can introduce biases in ΔCBF. In this study, we continuously monitored and minimized changes in PETO2 through the use of computerized targeting facilitated by RespirAct, and were therefore able to achieve the isolation of CO2 effects, which is a key requirement for the experiment at hand, and constitutes a basic assumption in numerous fMRI experiments using CO2 challenges. Our results suggest that there are no significant alterations in global CMRO2 due to these challenges, consistent with predictions obtained using the deoxyhemoglobin dilution model (Hoge et al, 1999).
Although the current measurements show an absence of substantial global CMRO2 modulation by low levels of PETCO2 modulation, they do not preclude the possibility of spatial heterogeneities in the CMRO2 response to capnic challenges. For instance, a slight increase in neuronal activity modulations by fluctuating inhaled CO2 in the pons and medulla may occur, while decreases in motor synaptic synchrony (Biswal et al, 1997) have also been observed, potentially linked to CO2-mediated suspension in oxidative metabolism fluctuations (Hudetz et al, 1998) and slight alterations in the intrathalamic network (Steriade et al, 1996). On the basis of our experimental observations, we expect the spatial distribution and the magnitude of this response to also exhibit sizeable subject dependence. In view of the sources of variation, we sought to assess group trends, and to verify whether the assumption of negligibility of ΔCMRO2 globally is reasonable for the purpose of calibrated BOLD.
Several animal studies, invaluable precursors to similar experiments in humans, document the CMRO2 response during hypercapnic challenges, but thus far, the conclusions have been inconsistent. The CMRO2 invariability was reported by Hino et al (2000), McPherson et al (1991), and Yang and Krasney (1995), in anesthetized lambs and dogs, as well as in awake sheep, respectively, at ΔPETCO2 values of up to 30 mm Hg. In contrast, Horvath et al (1994) showed a ∼30% decrease in CMRO2 in anesthetized rats (ΔPETCO2≈50 mm Hg), whereas Jones et al (2005) found a 30% CMRO2 increase during 10% hypercapnia in anesthetized rats (8 minutes, ΔPETCO2≈50 mm Hg), and negligible ΔCMRO2 at 5% CO2 (ΔPETCO2≈25 mm Hg). The latter result was corroborated by findings in awake rats by Martin et al (2006) (5% CO2), but questioned by data obtained from the study by Zappe et al (2008), which showed a ∼15% CMRO2 reduction during 6% CO2 (ΔPETCO2=24 mm Hg) in anesthetized macaques. These variations in outcome can in part be attributed to the substantial methodological differences, because: (1) different types of anesthesia and states of alertness can alter the neuronal response significantly and (2) the levels and durations of PETCO2 manipulations across these studies varied substantially (the duration varying from 60 seconds to 96 hour). More importantly, the comparatively high severity of the above PETCO2 perturbations preclude comparability with commonly used human fMRI paradigms. Further complications stem from evidence in the literature that the general response to inhaled CO2 may be highly species- and subject-dependent, as a 5% CO2 challenge in awake humans rarely produces as much as a 25 mm Hg PETCO2 increase. Given these considerations, we regard the widely varying experimental protocols to be a key potential contributor to the discrepancies among animal and human literature, which must be interpreted with care.
In summary, in this study, we sought to address accurate ΔCMRO2 measurement during hypercapnia and hypocapnia in awake humans, which has traditionally been hindered by nontrivial methodological challenges, particularly, the reproducible targeting of PETCO2 values and in the effective minimization of concurrent PETO2 variations. We explored the persisting question of whether the levels of end-tidal CO2 manipulations commonly used in human calibrated fMRI experiments can be expected to elicit significant changes in global CMRO2. We circumvented some of the key traditional challenges by using computerized PETCO2 and PETO2 targeting, and performed global ΔCMRO2 measurements in awake humans during graded hypercapnia and hypocapnia within a range chosen to address fMRI applications (more specifically, ranging from −6 to +9 mm Hg). Under such conditions, we found no evidence of significant changes in global CMRO2 during PETCO2 manipulations. Therefore, our findings support the assumption of negligible ΔCMRO2 under the conditions widely used in calibrated fMRI studies of awake humans.
The authors declare no conflict of interest.
References
- Biswal B, Hudetz AG, Yetkin FZ, Haughton VM, Hyde JS. Hypercapnia reversibly suppresses low-frequency fluctuations in the human motor cortex during rest using echo-planar MRI. J Cereb Blood Flow Metab. 1997;17:301–308. doi: 10.1097/00004647-199703000-00007. [DOI] [PubMed] [Google Scholar]
- Chen JJ, Pike GB. Human whole blood T2 relaxometry at 3 Tesla. Magn Reson Med. 2009;61:249–254. doi: 10.1002/mrm.21858. [DOI] [PubMed] [Google Scholar]
- Davis TL, Kwong KK, Weisskoff RM, Rosen BR. Calibrated functional MRI: mapping the dynamics of oxidative metabolism. Proc Natl Acad Sci USA. 1998;95:1834–1839. doi: 10.1073/pnas.95.4.1834. [DOI] [PMC free article] [PubMed] [Google Scholar]
- Hino JK, Short BL, Rais-Bahrami K, Seale WR. Cerebral blood flow and metabolism during and after prolonged hypercapnia in newborn lambs. Crit Care Med. 2000;28:3505–3510. doi: 10.1097/00003246-200010000-00026. [DOI] [PubMed] [Google Scholar]
- Hoge RD, Atkinson J, Gill B, Crelier GR, Marrett S, Pike GB. Investigation of BOLD signal dependence on cerebral blood flow and oxygen consumption: the deoxyhemoglobin dilution model. Magn Reson Med. 1999;42:849–863. doi: 10.1002/(sici)1522-2594(199911)42:5<849::aid-mrm4>3.0.co;2-z. [DOI] [PubMed] [Google Scholar]
- Hoogenraad FG, Reichenbach JR, Haacke EM, Lai S, Kuppusamy K, Sprenger M. In vivo measurement of changes in venous blood-oxygenation with high resolution functional MRI at 0.95 Tesla by measuring changes in susceptibility and velocity. Magn Reson Med. 1998;39:97–107. doi: 10.1002/mrm.1910390116. [DOI] [PubMed] [Google Scholar]
- Horvath I, Sandor NT, Ruttner Z, McLaughlin AC. Role of nitric oxide in regulating cerebrocortical oxygen consumption and blood flow during hypercapnia. J Cereb Blood Flow Metab. 1994;14:503–509. doi: 10.1038/jcbfm.1994.62. [DOI] [PubMed] [Google Scholar]
- Hudetz AG, Biswal BB, Shen H, Lauer KK, Kampine JP. Spontaneous fluctuations in cerebral oxygen supply. An introduction. Adv Exp Med Biol. 1998;454:551–559. doi: 10.1007/978-1-4615-4863-8_66. [DOI] [PubMed] [Google Scholar]
- Jensen JH, Chandra R. NMR relaxation in tissues with weak magnetic inhomogeneities. Magn Reson Med. 2001;44:144–156. [PubMed] [Google Scholar]
- Jones M, Berwick J, Hewson-Stoate N, Gias C, Mayhew J. The effect of hypercapnia on the neural and hemodynamic responses to somatosensory stimulation. Neuroimage. 2005;27:609–623. doi: 10.1016/j.neuroimage.2005.04.036. [DOI] [PubMed] [Google Scholar]
- Kety SS, Schmidt CF. The effects of altered arterial tensions of carbon dioxide and oxygen on cerebral blood flow and cerebral oxygen consumption of normal young men. J Clin Invest. 1948;27:484–492. doi: 10.1172/JCI101995. [DOI] [PMC free article] [PubMed] [Google Scholar]
- Losert C, Peller M, Schneider P, Reiser M. Oxygen-enhanced MRI of the brain. Magn Reson Med. 2002;48:271–277. doi: 10.1002/mrm.10215. [DOI] [PubMed] [Google Scholar]
- Martin C, Martindale J, Berwick J, Mayhew J. Investigating neural-hemodynamic coupling and the hemodynamic response function in the awake rat. Neuroimage. 2006;32:33–48. doi: 10.1016/j.neuroimage.2006.02.021. [DOI] [PubMed] [Google Scholar]
- McCormick PW, Steward M, Goetting MG, Balakrishnan G. Regional cerebrovascular oxygen saturation measured by optical spectroscopy in humans. Stroke. 1991;22:596–602. doi: 10.1161/01.str.22.5.596. [DOI] [PubMed] [Google Scholar]
- McPherson RW, Derrer SA, Traystman RJ. Changes in cerebral CO2 responsivity over time during isoflurane anesthesia in the dog. J Neurosurg Anesthesiol. 1991;3:12–19. doi: 10.1097/00008506-199103000-00003. [DOI] [PubMed] [Google Scholar]
- Noth U, Meadows GE, Kotajima F, Deichmann R, Corfield DR, Turner R. Cerebral vascular response to hypercapnia: determination with perfusion MRI at 1.5 and 3.0 Tesla using a pulsed arterial spin labeling technique. J Magn Reson Imaging. 2006;24:1229–1235. doi: 10.1002/jmri.20761. [DOI] [PubMed] [Google Scholar]
- Slessarev M, Han J, Mardimae A, Prisman E, Preiss D, Volgyesi G, Ansel C, Duffin J, Fisher JA. Prospective targeting and control of end-tidal CO2 and O2 concentrations. J Physiol. 2007;581:1207–1219. doi: 10.1113/jphysiol.2007.129395. [DOI] [PMC free article] [PubMed] [Google Scholar]
- Stefanovic B, Pike GB. Human whole-blood relaxometry at 1.5 T: assessment of diffusion and exchange models. Magn Reson Med. 2004;52:716–723. doi: 10.1002/mrm.20218. [DOI] [PubMed] [Google Scholar]
- Steriade M, Contreras D, Amzica F, Timofeev I. Synchronization of fast (30–40 Hz) spontaneous oscillations in intrathalamic and thalamocortical networks. J Neurosci. 1996;16:2788–2808. doi: 10.1523/JNEUROSCI.16-08-02788.1996. [DOI] [PMC free article] [PubMed] [Google Scholar]
- Valdez-Lowe C, Ghareed SA, Artinian NT. Pulse oximetry in adults. Am J Nurs. 2009;109:52–59. doi: 10.1097/01.NAJ.0000352474.55746.81. [DOI] [PubMed] [Google Scholar]
- Wagener JS, Hendricker C. Intra-subject variability of noninvasive oxygen measurements. Chest. 1987;92:1047–1049. doi: 10.1378/chest.92.6.1047. [DOI] [PubMed] [Google Scholar]
- Warnking JM, Pike GB. Reducing contamination while closing the gap: BASSI RF pulses in PASL. Magn Reson Med. 2006;55:865–873. doi: 10.1002/mrm.20843. [DOI] [PubMed] [Google Scholar]
- Xu F, Ge Y, Lu H. Noninvasive quantification of whole-brain cerebral metabolic rate of oxygen (CMRO2) by MRI. Magn Reson Med. 2009;62:141–148. doi: 10.1002/mrm.21994. [DOI] [PMC free article] [PubMed] [Google Scholar]
- Yang S-P, Krasney JA. Cerebral blood flow and metabolic responses to sustained hypercapnia in awake sheep. J Cereb Blood Flow Metab. 1995;15:115–123. doi: 10.1038/jcbfm.1995.13. [DOI] [PubMed] [Google Scholar]
- Ye FQ, Frank JA, Weinberger DR, McLaughlin AC. Noise reduction in 3D perfusion imaging by attenuating the static signal in arterial spin tagging (ASSIST) Magn Reson Med. 2000;44:92–100. doi: 10.1002/1522-2594(200007)44:1<92::aid-mrm14>3.0.co;2-m. [DOI] [PubMed] [Google Scholar]
- Zappe AC, Uludag K, Oeltermann A, Ugurbil K, Logothetis NK. The influence of moderate hypercapnia on neural activity in the anesthetized nonhuman primate. Cereb Cortex. 2008;18:2666–2673. doi: 10.1093/cercor/bhn023. [DOI] [PMC free article] [PubMed] [Google Scholar]