Abstract
Glycerol kinase (GK) is an enzyme with diverse (moonlighting) cellular functions. GK overexpression affects central metabolic fluxes substantially; therefore, to elucidate the mechanism underlying these changes, we employed a systems–level evaluation of GK overexpression in H4IIE rat hepatoma cells. Microarray analysis revealed altered expression of genes in metabolism (central carbon and lipid), which correlated with previous flux analysis, and of genes regulated by the glucocorticoid receptor (GR). Oil Red O staining showed that GK overexpression leads to increased fat storage in H4IIE cells. Network component analysis revealed that activities of peroxisome proliferator-activated receptor α, GR, and seven other transcription factors were altered by GK overexpression. The increased activity of GR was experimentally verified by quantitative RT-PCR of GR-responsive genes in the presence and absence of the glucocorticoid agonist, dexamethasone. This systems biology approach further emphasizes GK’s essential role in central and lipid metabolism and experimentally verifies GK’s alternative (moonlighting) function of affecting GR transcription factor activity.
Keywords: Glycerol kinase, moonlighting protein, glucocorticoid receptor, microarray analysis, network component analysis, transcriptional regulation
Introduction
Glycerol kinase (GK) is a key metabolic enzyme at the interface of carbohydrate and lipid metabolism (Dipple et al., 2001b). In humans, it has a particularly important role in the liver, where its activity is highest (MacLennan et al., 2006). Apart from its biochemical (enzymatic, metabolic) function of catalyzing the phosphorylation of glycerol to glycerol-3-phosphate, GK has other protein activities and is therefore, a “moonlighting” protein (Sriram et al., 2005). For example, in rat liver, GK also functions as the ATP-stimulated translocation promoter (ASTP) and enhances the nuclear binding of the activated glucocorticoid (G)-glucocorticoid receptor (GR) complex (G-GRC) (Okamoto et al., 1984). The G-GRC binds to glucocorticoid response elements in the promoters of GR-responsive genes and regulates the expression levels of those genes (Le et al., 2005; Schoneveld et al., 2004). GK has additional functions including binding to histones (Okamoto et al., 1989), interacting with porin (voltage-dependent anion channel on the outer surface of the outer mitochondrial membrane) (Ostlund et al., 1983), and playing a role in apoptosis (Martinez-Agosto and McCabe, 2006). Furthermore, GK has a role in insulin sensitivity as it is overexpressed in response to thiazolidinediones, common drugs to treat type 2 diabetes mellitus (Lee et al., 2005). The overexpression of GK relieves insulin resistance (Guan et al., 2002; Tordjman et al., 2003), and a GK missense mutation predisposes individuals to obesity, insulin resistance and type 2 diabetes mellitus (Gaudet et al., 2000).
GK is the causative gene in glycerol kinase deficiency (GKD), an X-linked, single gene, inborn error of metabolism (Dipple et al., 2001b). In individuals affected by GKD, no correlation has been found between genotype and clinical phenotype despite extensive studies (Dipple et al., 2001b; Sargent et al., 2000). We have proposed that the glycerol phosphorylating activity of GK may not, by itself, explain the complexity of GKD (Dipple and McCabe, 2000a; Dipple and McCabe, 2000b; Dipple et al., 2001a; Dipple et al., 2001b), and therefore, GK’s roles in other metabolic pathways and cellular processes (moonlighting activities) need to be examined.
We have previously shown that Gyk (the mouse ortholog of GK) deletion in mice alters gene expression extensively in liver (MacLennan et al., 2006), brown fat (Rahib et al., 2007) and muscle (Rahib et al., 2009). The genes affected included those involved in central carbon metabolism and lipid metabolism, which is expected given GK’s enzymatic/biochemical role at the interface of carbohydrate and fat metabolism. However, many other biological groups were significantly altered including insulin signaling, insulin resistance, apoptosis, steroid biosynthesis, and cell cycle arrest (MacLennan et al., 2006; Rahib et al., 2007; Rahib et al., 2009). This suggests that the changes seen may be due in part, to GK’s moonlighting functions such as its role as ASTP, which has the potential to affect gene expression through the GR. In addition, we have previously demonstrated that GK overexpression globally alters fluxes through central carbon metabolism (Sriram et al., 2008). Notably, the flux through the oxidative pentose phosphate pathway (oxPPP) in the GK-overexpressing cell lines was two-fold higher than wild type. Since this pathway contributes cytosolic NADPH toward lipogenesis, we hypothesize that GK overexpression leads to higher lipogenic activity.
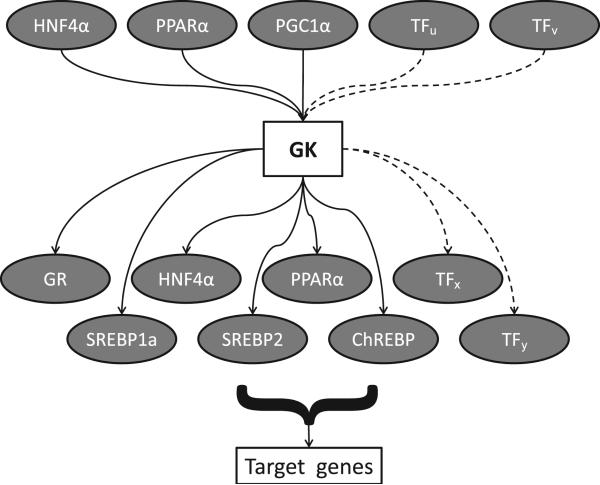
Therefore, we hypothesize that GK lies in a transcriptional network wherein it is regulated by upstream transcription factors and we hypothesize that GK effects the activities of downstream transcription factors (Fig. 1). Upstream transcription factors such as hepatocyte nuclear factor (HNF) 4α (Stepanian et al., 2003), peroxisome proliferator-activated receptor (PPAR) α (Patsouris et al., 2004) , and PPAR γ co-activator (PGC) 1α (Finck and Kelly, 2006) control the expression of GK. There is evidence that GK, in turn, directly or indirectly effects the expression or activity of downstream transcription factors such as the GR (due to its ASTP role; Okamoto et al., 1993; Okamoto et al., 1989), HNF 4α, PPAR α, sterol regulatory element binding protein (SREBP) 1a, SREBP 2, and carbohydrate response element binding protein (ChREBP) (MacLennan et al., 2006; Rahib et al., 2007) which regulate their target genes.
Figure 1. Hypothesized transcriptional network of glycerol kinase (GK).
Upstream transcription factors such as hepatocyte nuclear factor (HNF) 4α, peroxisome proliferator-activated receptor (PPAR) α, and PPAR γ co-activator (PGC) 1α control the expression of GK. There is evidence that GK, in turn, directly or indirectly effects the expression or activity of downstream transcription factors such as glucocorticoid-glucocorticoid receptor complex (GR), HNF 4α, PPAR α, sterol regulatory element binding protein (SREBP) 1a, SREBP 2, and carbohydrate response element binding protein (ChREBP), which regulate their target genes. TFu, TFv, TFx, and TFy are hypothesized transcription factors. Dashed lines indicate transcription factors that are currently unknown but may be identified in future studies.
To test the above hypotheses, we performed cDNA microarray analysis of GK-overexpressing (GK2) H4IIE and wild type (WT) cell lines. Network analyses included statistical clustering analyses and network component analysis (NCA). The statistical clustering analyses revealed several genes and transcription factors whose expression/activity was affected by GK overexpression. These results supported our previous metabolic flux analyses (Sriram et al., 2008). We also showed experimentally that GK2 cells stored more fat, which is consistent with GK’s role in adipogenesis. NCA, a mathematical technique that interprets microarray data to quantitatively infer hidden transcription factor activities (Galbraith et al., 2006; Liao et al., 2003), estimated that the activities of at least nine transcription factors were altered by GK overexpression. Of these, the most interesting result was increased activity of the GR, as this is directly related to the ASTP activity of GK. Furthermore, we experimentally verified the NCA results of increased GR transcription factor activity using a dexamethasone (a glucocorticoid agonist) dose response experiment. This experiment demonstrated that the GK-overexpressing cell lines indeed exhibit a higher level of expression of known GR responsive genes. This work furthers our previous studies on GK’s central role in metabolism and transcription, and provides insights into the multiple protein functions of this protein as well as a basis for understanding the complexity of the single gene disorder GKD.
Materials and methods
H4IIE cell culture
H4IIE, a rat hepatoma cell line, was obtained from American Type Culture Collection (Manassas, VA). The GK-overexpressing cell line GK2 was derived from this line as previously described (Sriram et al., 2008). Cells were maintained at 37°C in a humidified atmosphere in culture medium previously described (Sriram et al., 2008).
Oil Red O staining
For lipid visualization and quantification through Oil Red O staining, the WT and GK2 cells were fixed with 10% formalin, stained with 0.7% Oil Red O solution (Sigma, St. Louis, MO) and the resulting absorbance at 510 nm was quantified.
RNA isolation and purification
RNA was isolated from the cell lines by using the RNeasy kit (Qiagen, Valencia, CA), purified by using the RNeasy MinElute kit (Qiagen) and DNAse treated (Turbo DNA-free, Ambion, Austin, TX) as per manufacturer’s instructions. Total RNA was quantified on a NanoDrop spectrophotometer (NanoDrop Technologies, Wilmington, DE).
cDNA synthesis, hybridization, and microarray analysis
cDNA synthesis and hybridization to the GeneChip rat genome 230 2.0 array (Affymetrix, Santa Clara, CA) were performed as described previously (MacLennan et al., 2006). This array contained 31042 probesets. Microarray data were analyzed, quantified, and annotated by using the DNA-Chip Analyzer (dChip) software (Li and Wong, 2003).
Clustering and statistical analyses
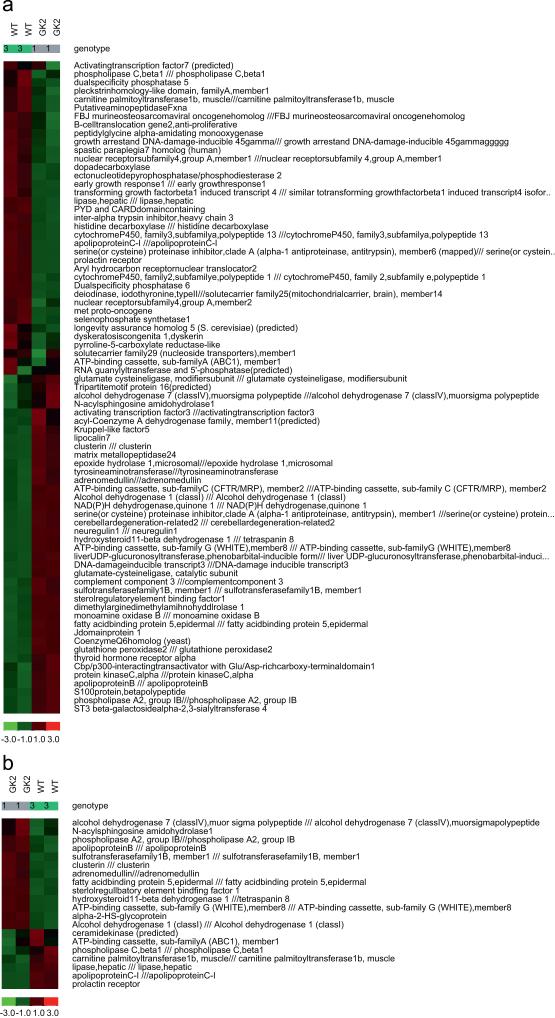
We employed principal component analysis (PCA) (an unsupervised learning technique to cluster genes) and supervised hierarchical clustering (Jaluria et al., 2007; Lee et al., 2007) for initial statistical analysis of the microarray data. To perform PCA, the 2902 “most varying probesets” were selected with the following criteria: coefficient of variance between 0.3 and 10.0 and present call > 20%. Supervised hierarchical clustering was performed by filtering out differentially regulated genes that met the following criteria: fold change > 1.5 between baseline (WT) and experimental (GK2), absolute difference in the expression level between baseline and experimental > 100, p < 0.05, and present call > 20%. Clustering “heat maps” for genes in two biological categories ([a] cellular metabolic processes, and [b] lipid metabolic processes and lipid transport) were then generated using dChip.
p-values of differences between means were determined by the Student’s t-test. We determined the false discovery rate (FDR) for false positives by the following two methods and obtained similar results. First, we used a method reported by Giordano et al. (2006), and we obtained an FDR value of 38% for a p-value cut-off of 0.05. The second approach was using tools publicly available at http://www.rowett.ac.uk/~gwh/fdr.html, and we obtained an FDR value of 29% for a p-value cut-off of 0.05.
Gene expression assay by quantitative RT-PCR
Gene expression was confirmed by quantitative real time PCR (RT-PCR) as described previously (Rahib et al., 2007) with β-actin or 18s rRNA (Applied Biosystems, Foster City, CA) used as an endogenous control. Fold changes in mRNA expression were calculated using the 2-ΔΔCT method (Livak and Schmittgen, 2001; Rahib et al., 2007).
Network component analysis (NCA)
NCA (Liao et al., 2003) was performed by using the NCA toolbox. To obtain connectivity information between transcription factors and genes for NCA, transcription factors important in rat liver were identified. Relationships between these transcription factors and genes were determined from the literature, on the basis of which an initial connectivity matrix with 14 transcription factors and 62 genes was constructed. The NCA toolbox combined the microarray data and the connectivity information to obtain transcription factor activities and control strengths.
ASTP activity assay (experimental verification of GK’s moonlighting activity)
The ASTP activity of GK was assayed by quantifying the gene expression level of known GR-responsive genes phosphoenolpyruvate carboxykinase (PEPCK) and tyrosine aminotransferase (TAT) (Herzog et al., 2004) through quantitative RT-PCR.
Replicates and statistical analyses
We used two biological replicates for the microarray analysis. Two to four biological replicates, each of which had two to three technical replicates, were used for qPCR and the dexamethasone dosage experiments (to verify the higher moonlighting activity of GK in the GK-overexpressing cells). Statistical analyses (PCA, p-values, false discovery rate) were performed as described above.
Results
To investigate the effects of GK overexpression on gene regulation, we constructed a human GK-overexpressing stable H4IIE rat hepatoma cell line GK2, as described previously (Sriram et al., 2008). The expression of human GK in the GK2 cells was significantly higher than WT (1.76 ± 0.03 fold, p < 0.01; data not shown), which is consistent with our previous work (Sriram et al., 2008). We performed microarray analysis and NCA of WT and GK2 cells. This analysis revealed altered expressions of (central carbon and lipid) metabolic genes, which correlated with previous flux analysis, as well as of genes regulated by the glucocorticoid receptor (GR). NCA interpreted the microarray data to infer that GK overexpression alters the activities of the GR and eight other transcription factors. Using a dexamethasone (GR agonist) dose response experiment and quantitative RT-PCR of GR-responsive genes, we experimentally verified the NCA prediction that GK overexpression leads to increased GR activity.
Microarray analysis of WT and GK2 cell lines
Principal component analysis (PCA) on the 2,902 most varying probesets in the microarray data revealed that the GK2 cells clearly clustered away from WT cells (Supplemental Material 1), indicating that their global gene expression profiles were significantly different. The average linkage clustering dendrogram obtained from PCA also confirmed that the GK2 cells clustered away from WT (Supplemental Material 1).
Supervised clustering of the microarray data (tabulated in Supplemental Material 2) revealed that 228 genes were differentially regulated in GK2 (> or < 1.5-fold) compared to WT (p < 0.05; Fig 2, Table 1). dChip analysis revealed that GK2 cells differ substantially from the WT in two significant biological categories: cellular metabolic processes (Fig. 2a), and lipid metabolic processes and lipid transport (Fig. 2b). Additionally, sterol regulatory element binding factor 1 (SREBF) 1, which codes for the lipogenic transcription factor SREBP1 was upregulated in the GK2 cell line. This points to an important role for GK in lipogenesis.
Figure 2. Supervised hierarchical clustering “heat map” of the wild type (WT) and GK-overexpressing cell line (GK2).
(a) Genes involved in cellular metabolic processes. (b) Genes involved in lipid metabolic processes and lipid transport. Genes were filtered by using the following criteria: absolute fold change > 1.5, absolute difference in expression level > 100, p < 0.05, present call > 20%. Genes with incomplete annotations (“transcribed locus” or “similar to another gene”) were omitted. The two biological replicates of each cell line are shown separately. Red color indicates upregulation and green indicates downregulation, as denoted by the color bars below each panel.
Table 1. Principal genes differentially expressed in GK-overexpressing (GK2) cells with respect to the wild type (WT).
Bolded entries are known GR-responsive genes. The column labeled p indicates the p value with respect to WT, as determined by a Student’s t-test.
| Gene | LocusLink | Fold change |
p |
|---|---|---|---|
| albumin | 24186 | −124.00 | 0.00 |
| procollagen, type III, alpha 1 | 84032 | −105.46 | 0.02 |
| glypican 3 | 25236 | −34.71 | 0.00 |
| lactate dehydrogenase B | 24534 | −32.70 | 0.02 |
| apolipoprotein C-I | 25292 | −10.57 | 0.04 |
| procollagen, type V, alpha 2 | 85250 | −6.63 | 0.01 |
| cadherin 17 | 117048 | −5.63 | 0.00 |
| ectonucleotide pyrophosphatase/phosphodiesterase 2 | 84050 | −3.80 | 0.04 |
| histidine decarboxylase | 24443 | −3.56 | 0.00 |
| thrombospondin 1 | 445442 | −3.16 | 0.02 |
| cytochrome P450, family 2, subfamily e, polypeptide 1 | 25086 | −2.80 | 0.02 |
| B-cell linker | 499356 | −2.14 | 0.03 |
| dual specificity phosphatase 6 | 116663 | −1.97 | 0.00 |
| neuropilin 1 | 246331 | −1.96 | 0.03 |
| glutamine synthetase/ glutamate-ammonia ligase (GluL) | 24957 | − 1.64 | 0.02 |
| carnitine palmitoyltransferase 1b, muscle | 25756 | −1.55 | 0.04 |
| histone 1, H2bh | 306945 | −1.50 | 0.00 |
| ATP-binding cassette, sub-family A, member 1 (ABC1) | 313210 | 1.18 | 0.05 |
| glucose-6-phosphate dehydrogenase (G6PDH) | 24377 | 1.25 | 0.03 |
| phosphoenolpyruvate carboxykinase 1 (PEPCK1) | 362282 | 1.29 | 0.01 |
| insulin-like growth factor binding protein 1 (IGFBP1) | 312320 | 1.30 | 0.05 |
| malic enzyme 1 (ME1) | 24552 | 1.31 | 0.01 |
| isocitrate dehydrogenase 1 (NADP+), soluble (IDH1) | 24479 | 1.32 | 0.01 |
| paraoxonase 3 | 312086 | 1.46 | 0.03 |
| clusterin | 24854 | 1.59 | 0.04 |
| ectonucleoside triphosphate diphosphohydrolase 5 | 314312 | 1.61 | 0.01 |
| tyrosine aminotransferase (TyrAT) | 24813 | 1.69 | 0.03 |
|
| |||
| glutamate-cysteine ligase, catalytic subunit | 25283 | 1.75 | 0.00 |
| sterol regulatory element binding factor 1 (SREBF1) | 78968 | 1.80 | 0.04 |
| apolipoprotein B | 54225 | 1.85 | 0.03 |
| alpha-2-HS-glycoprotein | 25373 | 1.92 | 0.00 |
|
| |||
| adrenomedullin | 25026 | 2.06 | 0.03 |
| alcohol dehydrogenase 1 (class I) (ADH1) | 24172 | 2.17 | 0.04 |
| BH3 interacting (with BCL2 family) domain, apoptosis agonist | 117271 | 2.21 | 0.03 |
| phospholipase A2, group IB | 29526 | 2.23 | 0.01 |
| 11-beta hydroxysteroid dehydrogenase 1/tetraspanin 8 | 25116 | 2.31 | 0.00 |
| liver UDP-glucuronosyltransferase, phenobarbital-inducible form | 286954 | 2.33 | 0.00 |
| Kruppel-like factor 5 | 84410 | 2.43 | 0.03 |
|
serine (or cysteine) proteinase inhibitor, clade A (alpha-1
antiproteinase, antitrypsin), member 1 (Serpina1a) |
24648 | 2.56 | 0.00 |
| huntingtin-associated protein 1 | 29430 | 2.90 | 0.00 |
| glutathione peroxidase 2 | 29326 | 4.99 | 0.01 |
Several gene expression levels were consistent with the results of our previous metabolic flux analysis on these cell lines (Sriram et al., 2008). For instance, genes coding for the anaplerotic enzymes PEPCK1 and malic enzyme (ME) 1 were upregulated 1.29-fold and 1.31-fold respectively, in GK2 cells compared to WT (p < 0.05, Table 1). Furthermore, lactate dehydrogenase B was downregulated 32.7-fold, which is consistent with lower lactate production observed in GK2 cells (Sriram et al., 2008). Glucose-6-phosphate dehydrogenase (G6PDH, which codes for the rate-limiting enzyme of the oxPPP) was upregulated 1.25-fold, which agrees with the higher oxPPP flux observed in GK2 cells (Sriram et al., 2008).
Several genes that are either classical GR-responsive genes (Mittelstadt and Ashwell, 2003; Schoneveld et al., 2004) or newly elucidated targets of the GR in liver (Phuc Le et al., 2005) were differentially regulated in GK2 cells compared to WT (p < 0.05; Table 1, bolded entries). For example, glutamine synthetase/glutamate ammonia ligase (GluL) was downregulated 1.64 fold; ATP-binding cassette, sub-family A, member 1 (ABC1) was upregulated 1.18-fold; PEPCK was upregulated 1.29-fold; insulin-like growth factor binding protein (IGFBP) 1 was upregulated 1.30-fold; TyrAT was upregulated 1.69-fold; adrenomedullin was upregulated 2.06-fold; alcohol dehydrogenase (ADH) 1 was upregulated 2.17-fold; and serine (or cysteine) proteinase inhibitor, clade A (alpha-1 antiproteinase, antitrypsin), member 1 (Serpina1a) was upregulated 2.56-fold in GK2 cells compared to WT (p<0.05, Table 1). Furthermore, 11β-hydroxysteroid dehydrogenase type 1, which catalyzes the conversion of biologically inactive 11-keto derivatives to active glucocorticoids in liver and other tissues, was upregulated 2.31-fold in GK2 cells (p < 0.05, Table 1). Additionally, insulin signaling-related genes such as IGFBP1 (1.3-fold) and alpha-2-HS-glycoprotein (1.92-fold) were upregulated in GK2 cells.
Verification of gene expression by quantitative RT-PCR
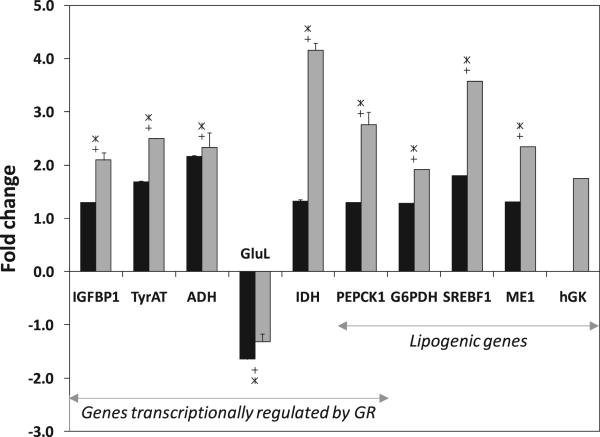
Quantitative RT-PCR verified the expression levels of ten genes that were determined by microarray analysis to be differentially regulated (Fig. 3), including the upregulated GR-responsive genes IGFBP1, TyrAT, ADH, IDH, and PEPCK1 and the upregulated lipogenic genes PEPCK1, G6PDH, SREBF1, and ME1. The expression levels of all these genes as determined by quantitative RT-PCR were greater in magnitude than those quantified from the microarray, but agreed in direction. The GR-responsive gene GluL was downregulated in GK2 cells according to one probeset on the microarray (1367632_at), and upregulated according to two probesets (1389426_at and 1375569_at). This is most likely due to cross-reactivity of these probesets, as has been observed previously (MacLennan et al., 2006). Therefore, quantitative RT-PCR established that GluL was downregulated in GK2 cells as indicated by the probeset 1367632_at.
Figure 3. Quantification of gene expression by quantitative PCR.
Gene expression levels for the GK-overexpressing cell line (GK2) as compared to the wild type (WT). Black bars denote values obtained by microarray analysis and gray bars denote values by quantitative RT-PCR. Significant differences (p < 0.05) between lines GK2 and WT are indicated by ‘+’ (microarray) and ‘*’ (quantitative RT-PCR). Abbreviations: IGFBP1, insulin-like growth factor binding protein 1; TyrAT, tyrosine aminotransferase; ADH, alcohol dehydrogenase; GluL, glutamine synthetase/glutamate ammonia ligase; IDH, isocitrate dehydrogenase; PEPCK, phosphoenolpyruvate carboxykinase; G6PDH, glucose-6-phosphate dehydrogenase; SREBF1, sterol regulatory element binding factor 1; ME, malic enzyme; hGK, human GK. Genes that are regulated by glucocorticoid receptor (GR) or involved in lipogenesis are indicated.
GK-overexpressing cells have higher lipid reserves than wild type
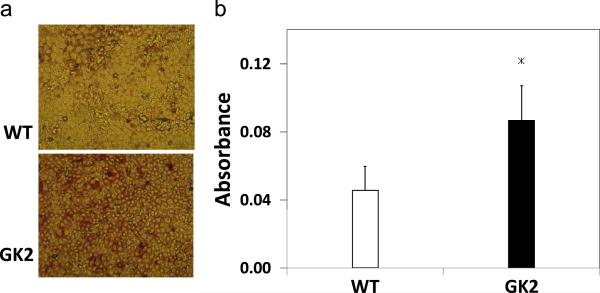
To experimentally verify the role of GK in lipogenesis, Oil Red O staining was performed and revealed that GK2 cells stored more fat and therefore had higher lipid reserves than WT cells (Fig. 4a). Quantification of the lipid content in the GK2 cells showed that the GK overexpressing cells had almost twice as much fat stored (1.89 ± 0.44 times, p < 0.01, Fig. 4b), compared to WT.
Figure 4. Lipid visualization and quantification by Oil Red O staining.
Wild type (WT) and GK-overexpressing (GK2) cells were treated with Oil Red O as described in Methods. (a) Cells after Oil Red O treatment, sample region from 10 cm plate. Intensity of red color is proportional to lipid accumulation. (b) Absorbance of Oil Red O (at 510 nm) averaged throughout a 10 cm plate. Significant differences are indicated “*” (p<0.01).
Network component analysis (NCA)
We used NCA (Galbraith et al., 2006; Liao et al., 2003) to deduce transcription factor activities that were altered by GK overexpression. NCA is a mathematical technique that interprets microarray data to quantitatively calculate transcription factor activity changes hidden in the data. To perform NCA, nine potential transcription factors (SREBP1a, ChREBP, Sp1, HNF1α, HNF4α, PPARα, PPARγ, liver X receptor [LXR]α, CCAAT-box/enhancer binding protein [C/EBP]β, , and GR) were identified based on the above results, together with 62 targets of some or all of these transcription factors that were differentially regulated in GK2 cells (filtered as explained in Methods). An initial “connectivity matrix” was constructed from this information and from gene regulation information in the literature (matrix and corresponding literature references are shown in Supplemental Material 3A and 3B). We intended to include five more important transcription factors (SREBP1c, SREBP2, Zhx2, GADD153, and PPARγ) but had to delete them from the matrix as they did not satisfy the mathematical criteria required for NCA (Liao et al., 2003) to generate an identifiable network.
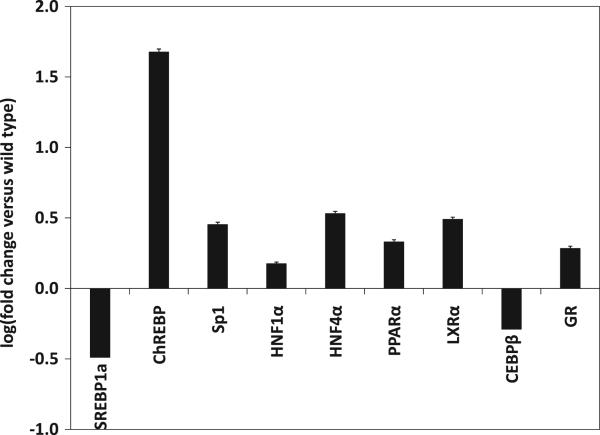
NCA deduced that GK overexpression leads to increased activity of several transcription factors including ChREBP, Sp1, HNF1α, HNF4α, PPARα, LXRα, and GR and decreased activity of SREBP1a and CEBPβ (Fig. 5). Importantly, the NCA results indicated that the activities of both PPARα and GR were higher in GK2 than in WT (p < 0.05; Fig. 5). The entire output of NCA, including the deduced connectivity between transcription factors and genes, is shown in Supplementary Material 4.
Figure 5. Activities of selected hepatically significant transcription factors in GK-overexpressing cell line GK2, obtained by network component analysis (NCA) of microarray data.
Transcription factor activities are expressed as log10 of fold change with respect to wild type. NCA was performed as explained in text. Abbreviations: SREBP, sterol regulatory element binding protein; ChREBP, carbohydrate regulatory element binding protein; HNF, hepatocyte nuclear factor; PPAR, peroxisome proliferator-activated receptor; LXR, lever X receptor; C/EBP, CCAAT-box/enhancer binding protein; GR, activated glucocorticoid-glucocorticoid receptor complex.
These altered transcription factor activities resulting from NCA can potentially explain some gene expression trends observed in the microarray data (see Discussion). The activity of SREBP1a was deduced to be lower in GK2 cells compared to WT, contrary to the trend in its gene expression. This surprising result may perhaps reflect the dependence of the (NCA-estimated) transcription factor activity on post-translational events in addition to the mRNA level (MacLennan et al., 2006). The SREBP1a result illustrates the power of NCA over microarray data analysis programs that do not estimate transcription factor activity. This result could have been tested experimentally by employing a recently reported SREBP assay (Chatterjee et al., 2009), which involves the endogenous SREBP-mediated regulation of a promoter that drives a luciferase gene reporter construct. However, for this work, we chose to focus on GR activity because it is directly linked to the moonlighting function of GK, whereas SREBP activity is not. Therefore, we experimentally verified the NCA deduction that GR activity in GK-overexpressing cells is higher (as explained below).
Experimental verification of higher GR transcription factor activity in GK-overexpressing cells
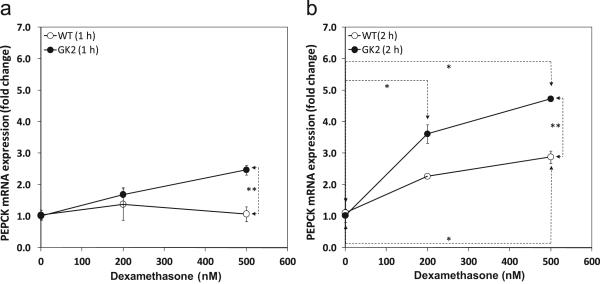
To experimentally verify the NCA deduction that the transcription factor activity of the GR was indeed higher in GK2 cells than the wild type, we quantified the expression level of the known GR-responsive gene PEPCK (Herzog et al., 2004) in independent experiments. We exposed WT and GK2 cells to two different doses (200 nM and 500 nM) of the glucocorticoid agonist dexamethasone for two different exposure times (1 h and 2 h). The dose response curves for 1 h exposure (Fig. 6a) and 2 h exposure (Fig. 6b) to dexamethasone clearly show that GK2 cells responded to dexamethasone better than WT cells. This verifies that the transcription factor activity of the GR is higher in GK2 cells than in WT. This dose response curve was valid up to 19 h (data not shown).
Figure 6. GK-overexpressing cell line GK2 has higher GR transcription factor activity than the wild type (WT).
WT (open circles) and GK2 (filled circles) cell lines were assayed for glucocorticoid receptor transcription factor activity by measuring the expression level of known GR-responsive gene PEPCK to glucocorticoid agonist dexamethasone for (a) 1 h and (b) 2 h. Gene expression levels are relative to dexamethasone-untreated controls (0 nM) for the same line. ‘*’ indicates p < 0.05 between different dexamethasone dosages on the same cell line. ‘**’ indicates p < 0.05 between lines GK2 and WT for the same dexamethasone dosage. Gene expression was assayed by quantitative RT-PCR, as described in Methods.
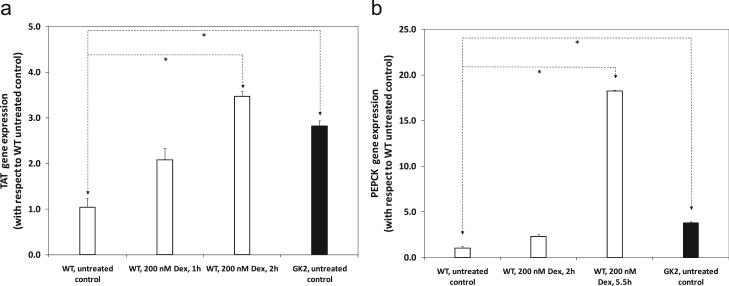
Furthermore, the effect of dexamethasone addition on GR transcription factor activity in WT cells was mimicked by GK overexpression. Treatment of WT cells with 200 nM dexamethasone for increasing exposure times enhanced the expression of GR-responsive genes TAT and PEPCK in WT cells (Fig. 7). For a 2 h exposure, the expression of TAT in WT cells was significantly higher (3.47 ± 0.12 times) than that of dexamethasone-untreated WT cells (p < 0.05; Fig. 7a). This trend is analogous to the effect of GK overexpression on TAT expression, as the expression level of TAT was 2.82 ± 0.12 times higher in GK2 cells than WT (p < 0.05; Fig. 7a). Similar results were also observed for the GR-responsive gene PEPCK, in which case WT cells required a 5.5 h dose of 200 nM dexamethasone to significantly increase PEPCK expression (Fig. 7b). Therefore, GK overexpression mimics the effect of exposure to the glucocorticoid agonist dexamethasone on GR transcriptional activity.
Figure 7. GK overexpression mimics the effect of dexamethasone addition on GR transcription factor activity on wild type cells.
Line WT (open bars) was either untreated or treated with 200 nM dexamethasone for different times, and assayed for GR transcription factor activity. This is compared to dexamethasone-untreated line GK2 (filled bars). GR transcription factor activity was measured by quantifying the expression level of known GR-responsive genes (a) TAT and (b) PEPCK. Gene expression was assayed by quantitative RT-PCR, as described in Methods. Gene expression levels are relative to dexamethasone-untreated controls (0 nM) for line WT. ‘*’ indicates p < 0.05 between corresponding bars.
Discussion
GK is an important metabolic enzyme with moonlighting activities and its deletion causes a single gene disorder exhibits several complexities (Dipple and McCabe, 2000a; Dipple and McCabe, 2000b; Dipple et al., 2001a; Dipple et al., 2001b). A fundamental understanding of GK’s role in mammalian cells requires understanding its moonlighting activities and therefore requires a systems biology approach. Previously we used isotope-assisted metabolic flux analysis (Sriram et al., 2004) to demonstrate, that GK overexpression in rat liver cells substantially alters fluxes in central carbon metabolism (Sriram et al., 2008), particularly in the oxPPP, suggesting increased lipogenesis. In this work, we performed microarray analysis and NCA to study how GK overexpression affects gene expression and transcription factor activity. The current study not only substantiated our previous metabolic flux study, but also indicated a role for GK’s moonlighting (ASTP) activity in transcription. Furthermore, we observed altered expressions of many metabolic genes (G6PDH, lactate dehydrogenase B, IDH, PEPCK1, ME1) in GK-overexpressing cells. This substantiates our previous study on metabolic flux alterations caused by GK overexpression (Sriram et al., 2008) and suggests that the metabolic flux patterns observed in our previous work are due, at least in part, to transcriptional regulation of the relevant genes. Our observation of differential expression of genes involved in metabolism, lipid metabolism and insulin signaling genes in GK-overexpressing cells is consistent with our previous studies on GK-deleted mice (MacLennan et al., 2006; Rahib et al., 2007; Rahib et al., 2009). We also observed evidence of increased lipid synthesis in GK2 cells as determined by Oil Red O staining, which substantiates our earlier hypothesis (Sriram et al., 2008) that the increased oxPPP flux in GK-overexpressing cells contributes cytosolic NADPH toward lipogenesis.
Many GR-responsive genes were also differentially expressed in GK2 cells. NCA estimated that at least nine transcription factor activities, including that of the GR, were altered by GK overexpression. These results substantiate the use of systems techniques such as NCA to interpret high-throughput microarray data and quantify transcription factor activities hidden in the data. First, the increased transcription activity of the GR in GK2 cells is ambiguous from the microarray results since genes known to be positively regulated by the GR were both upregulated (e.g. PEPCK, TAT, ADH) and downregulated (GluL) in the microarray. This is not surprising, since transcription factors other than the GR could also regulate these genes and the overall gene expression is due to the net influence of all the relevant transcription factors. Therefore, NCA performed an important role in decoupling the effects of competing transcription factors that regulated the differentially expressed genes. In addition, this work confirms the moonlighting ASTP activity (Okamoto et al., 1993; Okamoto et al., 1989; Sriram et al., 2005) of GK. Second, the activity of SREBP1a was estimated to be lower in GK2 cells than in WT, contrary to its gene expression. This could be ascribed to transcription factor activity being regulated at the post-translational level (MacLennan et al., 2006), but it would not have been revealed without the use of NCA.
NCA deduced that GK overexpression results in increased transcription factor activity of PPARα. This may explain the increased oxPPP flux due to GK overexpression (Sriram et al., 2008), as PPARα is an important transcription factor for G6PDH, the gene coding for the rate limiting enzyme of the oxPPP (Xu et al., 2004). The increased transcription factor activity of the GR due to GK overexpression was an interesting result, as GK facilitates the nuclear translocation of the GR in its moonlighting role as ASTP. We experimentally verified this NCA result by measuring GR transcription factor activity via the expression of its target gene PEPCK. We also verified that GK overexpression mimics the effect of the glucocorticoid agonist dexamethasone on GR transcription factor activity. To the extent of our knowledge, this is the first work where a deduction of NCA has been experimentally verified in a mammalian system.
Conclusions and summary
This study confirms our previous metabolic flux analysis elucidating GK’s role in central metabolism. In addition, we have confirmed GK’s role in the transcription of GR-responsive genes. GK overexpression in rat hepatoma cells causes increased lipid storage and increased expression of genes important in lipogenesis, which was hypothesized by us previously (Sriram et al., 2008) and this may be related to GK’s role in diabetes and insulin sensitivity. GK overexpression also causes increased GR transcription factor activity, which is directly related to GK’s moonlighting role as ASTP (Okamoto et al., 1993; Okamoto et al., 1984) (Sriram et al., 2005). Together with our previous metabolomic study (Sriram et al., 2008), this transcriptomic study with experimental verification provides an improved understanding of GK’s regulatory role and provides insight into the pathogenesis of GKD. In addition, this work shows the importance of understanding the moonlighting functions (or all the cellular protein activities) of metabolic enzymes in understanding the pathogenesis of single gene inborn errors of metabolism (Sriram et al., 2005).
Supplementary Material
Acknowledgments
The authors thank Professor Edward R. B. McCabe (UCLA) for his comments on the manuscript. This work was supported by NIH grant NIGMS RO1 GM067929 (KMD).
Footnotes
Publisher's Disclaimer: This is a PDF file of an unedited manuscript that has been accepted for publication. As a service to our customers we are providing this early version of the manuscript. The manuscript will undergo copyediting, typesetting, and review of the resulting proof before it is published in its final citable form. Please note that during the production process errors may be discovered which could affect the content, and all legal disclaimers that apply to the journal pertain.
References
- Chatterjee S, Szustakowski JD, Nanguneri NR, Mickanin C, Labow MA, Nohturfft A, Dev KK, Sivasankaran R. Identification of novel genes and pathways regulating SREBP transcriptional activity. PLoS ONE. 2009;4:e5197–e5197. doi: 10.1371/journal.pone.0005197. [DOI] [PMC free article] [PubMed] [Google Scholar]
- Dipple KM, McCabe ER. Modifier genes convert “simple” Mendelian disorders to complex traits. Mol Genet Metab. 2000a;71:43–50. doi: 10.1006/mgme.2000.3052. [DOI] [PubMed] [Google Scholar]
- Dipple KM, McCabe ER. Phenotypes of patients with “simple” Mendelian disorders are complex traits: thresholds, modifiers, and systems dynamics. Am J Hum Genet. 2000b;66:1729–35. doi: 10.1086/302938. [DOI] [PMC free article] [PubMed] [Google Scholar]
- Dipple KM, Phelan JK, McCabe ER. Consequences of complexity within biological networks: robustness and health, or vulnerability and disease. Mol Genet Metab. 2001a;74:45–50. doi: 10.1006/mgme.2001.3227. [DOI] [PubMed] [Google Scholar]
- Dipple KM, Zhang YH, Huang BL, McCabe LL, Dallongeville J, Inokuchi T, Kimura M, Marx HJ, Roederer GO, Shih V, Yamaguchi S, Yoshida I, McCabe ER. Glycerol kinase deficiency: evidence for complexity in a single gene disorder. Hum Genet. 2001b;109:55–62. doi: 10.1007/s004390100545. [DOI] [PubMed] [Google Scholar]
- Finck BN, Kel0ly DP. PGC-1 coactivators: inducible regulators of energy metabolism in health and disease. Am Soc Clin Investig. 2006;Vol. 116:615–622. doi: 10.1172/JCI27794. [DOI] [PMC free article] [PubMed] [Google Scholar]
- Galbraith SJ, Tran LM, Liao JC. Transcriptome network component analysis with limited microarray data. Bioinformatics. 2006;22:1886–1894. doi: 10.1093/bioinformatics/btl279. [DOI] [PubMed] [Google Scholar]
- Gaudet D, Arsenault S, Perusse L, Vohl MC, St-Pierre J, Bergeron J, Despres JP, Dewar K, Daly MJ, Hudson T, Rioux JD. Glycerol as a correlate of impaired glucose tolerance: dissection of a complex system by use of a simple genetic trait. Am J Hum Genet. 2000;66:1558–68. doi: 10.1086/302903. [DOI] [PMC free article] [PubMed] [Google Scholar]
- Giordano TJ, Au AYM, Kuick R, Thomas DG, Rhodes DR, Wilhelm KG, Vinco M, Misek DE, Sanders D, Zhu Z, Ciampi R, Hanash S, Chinnaiyan A, Clifton-Bligh RJ, Robinson BG, Nikiforov YE, Koenig RJ. Delineation, functional validation, and bioinformatic evaluation of gene expression in thyroid follicular carcinomas with the PAX8-PPARg translocation. Clinical Cancer Research. 2006;12:1983–1993. doi: 10.1158/1078-0432.CCR-05-2039. [DOI] [PubMed] [Google Scholar]
- Guan HP, Li Y, Jensen MV, Newgard CB, Steppan CM, Lazar MA. A futile metabolic cycle activated in adipocytes by antidiabetic agents. Nat Med. 2002;8:1122–8. doi: 10.1038/nm780. [DOI] [PubMed] [Google Scholar]
- Herzog B, Hall RK, Wang XL, Waltner-Law M, Granner DK. Peroxisome Proliferator-Activated Receptor ? Coactivator-1a, as a Transcription Amplifier, Is Not Essential for Basal and Hormone-Induced Phosphoenolpyruvate Carboxykinase Gene Expression. Molecular Endocrinology. 2004;18:807–819. doi: 10.1210/me.2003-0384. [DOI] [PubMed] [Google Scholar]
- Jaluria P, Betenbaugh M, Konstantopoulos K, Frank B, Shiloach J. Application of microarrays to identify and characterize genes involved in attachment dependence in HeLa cells. Metabolic Engineering. 2007;9:241–251. doi: 10.1016/j.ymben.2006.12.001. [DOI] [PMC free article] [PubMed] [Google Scholar]
- Le PP, Friedman JR, Schug J, Brestelli JE, Parker JB, Bochkis IM, Kaestner KH. Glucocorticoid receptor-dependent gene regulatory networks. PLoS Genetics. 2005;1:e16–e16. doi: 10.1371/journal.pgen.0010016. [DOI] [PMC free article] [PubMed] [Google Scholar]
- Lee DH, Park DB, Lee YK, An CS, Oh YS, Kang JS, Kang SH, Chung MY. The effects of thiazolidinedione treatment on the regulations of aquaglyceroporins and glycerol kinase in OLETF rats. Metabolism. 2005;54:1282–9. doi: 10.1016/j.metabol.2005.04.015. [DOI] [PubMed] [Google Scholar]
- Lee YY, Wong KTK, Nissom PM, Wong DCF, Yap MGS. Transcriptional profiling of batch and fed-batch protein-free 293-HEK cultures. Metabolic Engineering. 2007;9:52–67. doi: 10.1016/j.ymben.2006.08.006. [DOI] [PubMed] [Google Scholar]
- Li C, Wong WH. DNA-Chip Analyzer (dChip) In: Parmigiani G, Garrett E, Irizarry R, Zeger S, editors. The analysis of gene expression data: methods and software. Springer; New York: 2003. pp. 120–141. [Google Scholar]
- Liao JC, Boscolo R, Yang YL, Tran LM, Sabatti C, Roychowdhury VP. Network component analysis: reconstruction of regulatory signals in biological systems. Proc Natl Acad Sci U S A. 2003;100:15522–7. doi: 10.1073/pnas.2136632100. [DOI] [PMC free article] [PubMed] [Google Scholar]
- Livak KJ, Schmittgen TD. Analysis of relative gene expression data using real-time quantitative PCR and the 2-ΔΔCT method. Methods. 2001;25:402–408. doi: 10.1006/meth.2001.1262. [DOI] [PubMed] [Google Scholar]
- MacLennan NK, Rahib L, Shin C, Fang Z, Horvath S, Dean J, Liao JC, McCabe ER, Dipple KM. Targeted disruption of glycerol kinase gene in mice: expression analysis in liver shows alterations in network partners related to glycerol kinase activity. Hum Mol Genet. 2006;15:405–15. doi: 10.1093/hmg/ddi457. [DOI] [PubMed] [Google Scholar]
- Martinez-Agosto JA, McCabe ERB. Conserved family of glycerol kinase loci in Drosophila melanogaster. Molec Genet Metabol. 2006;88:334–345. doi: 10.1016/j.ymgme.2006.01.002. [DOI] [PMC free article] [PubMed] [Google Scholar]
- Mittelstadt PR, Ashwell JD. Disruption of Glucocorticoid Receptor Exon 2 Yields a Ligand-Responsive C-Terminal Fragment that Regulates Gene Expression. Mol Endocrinol. 2003;17:1534–1542. doi: 10.1210/me.2002-0429. [DOI] [PubMed] [Google Scholar]
- Okamoto K, Hirano H, Isohashi F. Molecular cloning of rat liver glucocorticoid-receptor translocation promoter. Biochem Biophys Res Commun. 1993;193:848–54. doi: 10.1006/bbrc.1993.1703. [DOI] [PubMed] [Google Scholar]
- Okamoto K, Isohashi F, Horiuchi M, Sakamoto Y. An ATP-stimulated factor that enhances the nuclear binding of “activated” receptor-glucocorticoid complex. Biochem Biophys Res Commun. 1984;121:940–5. doi: 10.1016/0006-291x(84)90767-8. [DOI] [PubMed] [Google Scholar]
- Okamoto K, Isohashi F, Ueda K, Sakamoto Y. Properties of an adenosine triphosphate-stimulated factor that enhances the nuclear binding of activated glucocorticoid-receptor complex: binding to histone-agarose. Endocrinology. 1989;124:675–80. doi: 10.1210/endo-124-2-675. [DOI] [PubMed] [Google Scholar]
- Ostlund AK, Gohring U, Krause J, Brdiczka D. The binding of glycerol kinase to the outer membrane of rat liver mitochondria: its importance in metabolic regulation. Biochem Med. 1983;30:231–45. doi: 10.1016/0006-2944(83)90089-3. [DOI] [PubMed] [Google Scholar]
- Patsouris D, Mandard S, Voshol PJ, Escher P, Tan NS, Havekes LM, Koenig W, Marz W, Tafuri S, Wahli W. PPARa governs glycerol metabolism. Journal of Clinical Investigation. 2004;114:94–103. doi: 10.1172/JCI20468. [DOI] [PMC free article] [PubMed] [Google Scholar]
- Phuc Le P, Friedman JR, Schug J, Brestelli JE, Parker JB, Bochkis IM, Kaestner KH. Glucocorticoid Receptor-Dependent Gene Regulatory Networks. PLoS Genetics. 2005;1:e16. doi: 10.1371/journal.pgen.0010016. [DOI] [PMC free article] [PubMed] [Google Scholar]
- Rahib L, MacLennan NK, Horvath S, Liao JC, Dipple KM. Glycerol kinase deficiency alters expression of genes involved in lipid metabolism, carbohydrate metabolism, and insulin signaling. Eur J Hum Genet. 2007;15:646–57. doi: 10.1038/sj.ejhg.5201801. [DOI] [PubMed] [Google Scholar]
- Rahib L, Sriram G, Harada MK, Liao JC, Dipple KM. Transcriptomic and network component analysis of glycerol kinase in skeletal muscle using a mouse model of glycerol kinase deficiency. Mol Genet Metab. 2009;96:106–12. doi: 10.1016/j.ymgme.2008.11.163. [DOI] [PMC free article] [PubMed] [Google Scholar]
- Sargent CA, Kidd A, Moore S, Dean J, Besley GT, Affara NA. Five cases of isolated glycerol kinase deficiency, including two families: failure to find genotype:phenotype correlation. J Med Genet. 2000;37:434–41. doi: 10.1136/jmg.37.6.434. [DOI] [PMC free article] [PubMed] [Google Scholar]
- Schoneveld OJ, Gaemers IC, Lamers WH. Mechanisms of glucocorticoid signalling. Biochim Biophys Acta. 2004;1680:114–28. doi: 10.1016/j.bbaexp.2004.09.004. [DOI] [PubMed] [Google Scholar]
- Sriram G, Fulton DB, Iyer VV, Peterson JM, Zhou R, Westgate ME, Spalding MH, Shanks JV. Quantification of compartmented metabolic fluxes in developing soybean embryos by employing biosynthetically directed fractional 13C labeling, two-dimensional [13C, 1H] nuclear magnetic resonance, and comprehensive isotopomer balancing. Plant Physiol. 2004;136:3043–3057. doi: 10.1104/pp.104.050625. [DOI] [PMC free article] [PubMed] [Google Scholar]
- Sriram G, Martinez JA, McCabe ERB, Liao JC, Dipple KM. Single-gene disorders: What role could moonlighting enzymes play? Am J Hum Genet. 2005;76:911–924. doi: 10.1086/430799. [DOI] [PMC free article] [PubMed] [Google Scholar]
- Sriram G, Rahib L, He J-S, Campos AE, Parr LS, Liao JC, Dipple KM. Global metabolic effects of glycerol kinase overexpression in rat hepatoma cells. Molecular Genetics and Metabolism. 2008;93:145–159. doi: 10.1016/j.ymgme.2007.09.008. [DOI] [PMC free article] [PubMed] [Google Scholar]
- Stepanian SV, Huyn ST, McCabe ERB, Dipple KM. Characterization of the human glycerol kinase promoter: identification of a functional HNF-4a binding site and evidence for transcriptional activation. Molecular Genetics and Metabolism. 2003;80:412–418. doi: 10.1016/j.ymgme.2003.10.003. [DOI] [PubMed] [Google Scholar]
- Tamura K, Ono A, Miyagishima T, Nagao T, Urushidani T. Profiling of gene expression in rat liver and rat primary cultured hepatocytes treated with peroxisome proliferators. Journal of Toxicological Sciences. 2006;31:471–490. doi: 10.2131/jts.31.471. [DOI] [PubMed] [Google Scholar]
- Tordjman J, Chauvet G, Quette J, Beale EG, Forest C, Antoine B. Thiazolidinediones block fatty acid release by inducing glyceroneogenesis in fat cells. J Biol Chem. 2003;278:18785–90. doi: 10.1074/jbc.M206999200. [DOI] [PubMed] [Google Scholar]
- Xu J, Chang V, Joseph SB, Trujillo C, Bassilian S, Saad MF, Lee WN, Kurland IJ. Peroxisomal proliferator-activated receptor α deficiency diminishes insulin-responsiveness of gluconeogenic/glycolytic/pentose gene expression and substrate cycle flux. Endocrinology. 2004;145:1087–95. doi: 10.1210/en.2003-1173. [DOI] [PubMed] [Google Scholar]
Associated Data
This section collects any data citations, data availability statements, or supplementary materials included in this article.


