

Abstract
Purpose
To investigate the utility of noninvasive magnetic resonance imaging (MRI) protocols to demonstrate pathological differences between rats and mice after SCI. Rats and mice are commonly used to model spinal cord injury (SCI), however histology and immunohistochemistry have shown differences in neuropathology between the two species, including cavity formation and scar/inflammatory responses.
Materials and Methods
Moderate contusion SCI was performed on adult male rats and mice. At 28 days post-injury, animals underwent T1-weighted (T1W), with or without gadolinium contrast, or T2-weighted (T2W) MRI, to be compared with histology at the same time point.
Results
In both species, all MRI methods demonstrated changes in spinal cord anatomy. Immunohistochemistry indicated that T2W accurately reflected areas of inflammation and glial scar formation in rats and mice. Quantitation of lesion volume by histology and functional performance correlated best with T2W measurements in both species. Gadolinium contrast accurately reflected the blood-spinal cord-barrier permeability in both species, which appeared greater in rats than in mice.
Conclusion
These data demonstrate that MRI, with either a T1W or T2W protocol, can effectively distinguish pathological differences between rats and mice.
Keywords: Blood-spinal cord-barrier, Cavitation, Lesion volume, MRI
INTRODUCTION
Neuropathological changes after spinal cord injury (SCI) shows both differences and similarities between mice and rats. Differences involve both morphometric parameters and cellular reorganization characteristics: whereas mice typically show accumulation of a dense fibrous connective tissue that fills the lesion site (1), SCI in rats typically results in large cystic cavities that extend rostral and caudal to the initial injury site (2). Similarities are based on timing of cellular reorganization events; the two species demonstrate similar inflammatory and astroglial activity resulting in glial scar formation and secondary tissue damage around the lesion site (2,3). Pathologically, human SCI is more similar to the rat model and demonstrates spinal cord atrophy, myelomalacia, cyst and syrinx formation and cord disruption or tethering, which are identifiable with many magnetic resonance imaging (MRI) protocols (4).
MRI offers a noninvasive method for examining in vivo pathology following SCI. As such, it can be repeated over time, and can be effectively used with either fixed ex vivo tissue (5,6) or in vivo (7,8). A wide array of available MRI protocols may be applied to obtain different types of information about the tissue being examined. Thus, different techniques can serve to provide information on vascular compromise, hematoma formation, inflammation, or necrosis (9). For example, a T1-weighted (T1W), spin lattice MRI at more chronic time points (>2 weeks post-injury) will show pools of water or blood as hypo-intense (10); in contrast, highly vascularized areas or areas of blood-spinal cord-barrier (BSCB) compromise (leaky vasculature) appear hyper-intense – particularly with the aid of a contrast agent (10). A T2-weighted (T2W), spin-spin scan at these chronic time points, on the other hand, detects areas of edema and pooling water or blood as a hyper-intense area without the aid of a contrast agent (11). Several studies have used T1 and T2W in vivo MRI to examine pathological effects of SCI in rats (12-14) and mice (1), demonstrating cavity formation, hemorrhage and edema. Other studies have reported correlations between MRI scan abnormalities and functional performance (15) or histology (13).
Gadolinium (Gd) contrast provides enhanced sensitivity as well as the ability to assess BSCB breakdown, which occurs in traumatic injuries like SCI. The BSCB is designed to protect the CNS from the plasma and potential disruptions of neuronal communication by ion concentration fluctuation (16). SCI causes disruption of this barrier, resulting in increased permeability to proteins and other molecules (17). Bilgen et al. (8) demonstrated that Gd administration increased the intensity of the image at the lesion epicenter. Gadolinium crossed the BSCB up to 42 days after SCI in rats, and was found several millimeters along the length of the spinal cord, corresponding to regions of new blood vessel formation and, reduction in Gd penetration into the spinal cord was correlated with functional recovery over time (18). Thus, Bilgen et al hypothesized that Gd labeling of the injured spinal cord may be a useful method for tracking development of the lesion site and predicting functional or histological recovery.
Although prior studies have used imaging technologies to assess experimental SCI, little has been done to compare various MRI methodologies for detection of anatomical changes after SCI or to assess differences in MRI findings between species. The present study utilized MRI T1 (with and without contrast) and T2W protocols to correlate the pathology and apparent lesion volumes obtained with each protocol to histology, functional recovery, immunolabeling for microglia/macrophages and astrocytes and BSCB compromise in rats and mice with SCI.
MATERIALS AND METHODS
Spinal cord injury
Contusion spinal cord injury was performed in adult male Sprague Dawley rats and adult male C57Bl6 mice (Taconic, Germantown, NY). Rats (275 – 325g) were anesthetized with sodium pentobarbital (67 mg/Kg, I.P.) and a traumatic spinal cord injury was induced by dropping a 10 g weight from 25 mm onto an impounder positioned on the exposed spinal cord at vertebral level T9, producing a moderate injury, as described previously (19,20). Similarly mice (20 – 25g) were anesthetized with isoflurane (1.5% vapor inhalation), and injury was induced in an identical manner as rats, using a 1.87 g weight dropped from 20 mm, as used described previously(21). Sham-injured animals received a laminectomy without weight drop. All experiments complied fully with the principles set forth in the “Guide for the Care and Use of Laboratory Animals” prepared by the Committee on Care and Use of Laboratory Animals of the Institute of Laboratory Resources, National Research Council (DHEW pub. No. (NIH) 85-23, 2985) and were approved.
Functional analysis
The Basso-Beattie-Bresnahan (BBB) scale was used to assess neurological function in an open field motor test in both rats and mice, as previously detailed (22). The BBB scale is a 21 point scale ranging from 1 (indicating no hindlimb movement) to 21 (indicating normal hindlimb function), rating locomotion on aspects of hindlimb function such as weight support, stepping ability, coordination and toe clearance. All functional scores were obtained at days 1, 7, 14, 21, and 28 by two individuals blinded to treatment.
MRI imaging
Rats and mice were imaged at 28 days post-injury, to take advantage of the relative stability of the injury progression, including lesion formation and functional changes, at this time point. Imaging was performed using a 7.0 Tesla Bruker horizontal spectrometer/imager with a 20cm bore (Bruker Biospin Billerica, MA) equipped with 100 gauss/cm microimaging gradients and run by Parvision 2.1 software in the Preclinical Imaging Research Laboratory. The equipment had a cylindrical tunable resonant radiofrequency antenna (birdcage configuration) volume coil, tuned to a center frequency of approximately 300 Mhz. Rats and mice were anesthetized with 1.5% isoflurane, 30% nitrous oxide, and were positioned in a custom-made stereotaxic animal holder. Physiological monitoring of body temperature was achieved with a Luxtron fiber optic thermometer and body temperature was maintained with a warm water blanket at 37°C. Respiration monitoring was achieved by a respiratory monitoring system built into the animal holder (23).
Both T1W and T2W imaging protocols were employed (9). Different groups of animals were used for each imaging protocol. For the T1W 3D imaging protocol, rats (n = 4) and mice (n = 4) were imaged before and after receiving an injection of Gd (0.17mmol/kg, I.V.; Omniscan, Amersham Health, Waukesha, WI). Parameters for the T1W RARE sequence were as follows: field of view 8.0 cm × 3.5 cm × 3.5 cm, TR = 200 msec, TE = 5.9 msec, number of averages = 1, number of echoes = 4, slice thickness = 35mm, MTX = 256 × 256 × 256. The imaging time was 3.5 hours.
The T2W protocol for rats (n = 5) is as follows: field of view 9.0 × 9.0 cm, TR = 2500 msec, TE = 30 msec, number of averages = 32, number of echoes = 8, RARE factor = 8, MTX = 256 × 256, number of slices = 9, slice thickness = 0.5mm, with an imaging time of 28 minutes. The mouse protocol was similar (n = 5), except the number of averages was 16, the field of view was 3.2 × 5.12 cm, with 7 slices.
MRI images were assessed using Image J analysis software. Briefly, hypo- and/or hyper-intense areas (indicating lesioned areas) were manually outlined in each section and the outlined area measured as described previously (19). Total lesion volume was obtained by summing the areas obtained and multiplying this by the section thickness; average lesion volumes were thus obtained for each MRI imaging paradigm.
Blood-spinal cord barrier (BSCB) penetration analysis
Thirty minutes prior to animal sacrifice, rats and mice from the Gd/T1 MRI imaging protocol (n = 2/species/tracer) were injected with either Evans Blue (69kDa, Sigma, 1.2% in 0.9% saline, I.V.) or sodium fluorescein (0.376 kDa, Sigma, 2% in saline, I.V.). Following perfusion and tissue collection, Evans Blue was visualized with light microscopy, and sodium fluorescein was visualized with fluorescent microscopy (AxioPlan Zeiss Microscopy system; Carl Zeiss, Inc., Thornwood, NY) to determine the penetration of these chemicals into injured tissue.
Histology
The day after MRI imaging, rats and mice were anesthetized (100 mg/Kg sodium pentobarbital, I.P.) and intracardially perfused with 0.9% saline followed by 10% buffered formalin. A 1 cm section of the spinal cord centered at the lesion epicenter, T-9, was dissected, post-fixed in 10% buffered formalin overnight and cryoprotected in 30% sucrose for 48 hours. Serial 20 μm thick sagittal sections were collected.
Lesion volume was assessed based on the Cavalieri method of stereology. Briefly, sagittal spinal cord sections from 5 mm rostral to 5 mm caudal the lesion site, encompassing the entire width of the spinal cord, were obtained. A random start section for each sample was chosen and every 2nd section (40 μm interval between sections) was stained with hematoxylin and eosin (H&E) and photographed at 4X (AxioPlan Zeiss Microscopy system; Carl Zeiss, Inc., Thornwood, NY). The lesion area, including both the cavity and surrounding damaged tissue, was then outlined in the Scion Image program (http://rsb.info.nih.gov/nih-image/) and the resultant area measured. Volume was assessed by multiplying the measured area of each section by the distance between the photographed sections. Volumes were then summed for a final estimation of total lesion volume. Average lesion volume was assessed for each injury severity.
Immunohistochemistry
Standard fluorescent immunocytochemistry for the glial scar (glial fibrillary acidic protein (GFAP); Chemicon, Temecula, CA) and microglia/macrophages (ionized calcium binding adaptor molecule 1 (Iba-1); Wako, Richmond, VA) was performed on adjacent sections, at locations that matched with the center of lesion based on MRI section thickness and tissue sectioning thickness. To ensure accurate and specific staining, negative controls were used in which the primary antibody was not applied. Immunofluorescence was detected using a Zeiss 510 meta confocal laser scanning microscope at 10 – 20X (LSM 510 META, Zeiss, Thornwood, NY, USA).
Statistical analysis
Quantitative data are presented as mean +/- SEM. Lesion volume and functional testing scores were obtained by an investigator blinded to treatment group. Correlation analysis was performed using linear regression analysis, using the GraphPad Prism Program, Version 3.02 for Windows (GraphPad Software, Inc. San Diego, CA). A p value < 0.05 was considered statistically significant.
RESULTS
Lesion morphology: MRI and histology
Spinal cord lesions appeared as dark areas in T1 images of mouse spinal cord (Fig. 1a). In rats, T1 images were more difficult to interpret, and areas of hypo- or hyper-intensity were often difficult to distinguish from the normal spinal cord tissue (Fig. 1b).
Figure 1.
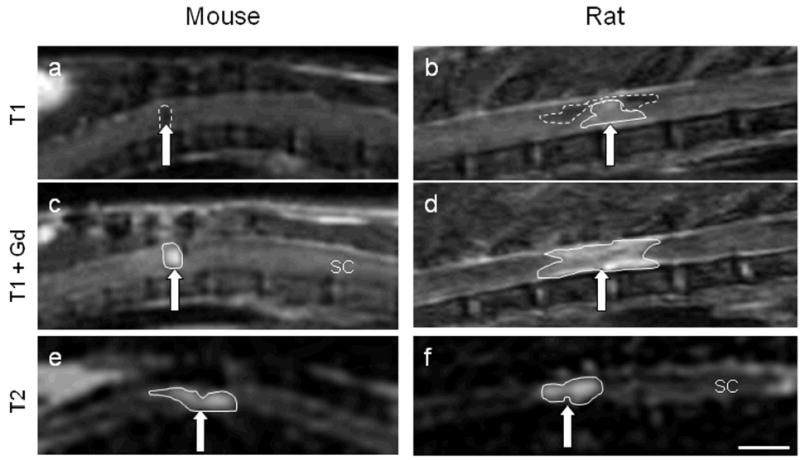
Mouse and rat MRI images at 28 days following a moderate spinal cord injury. Images were taken using a T1W protocol (a, b), T1W protocol with Gd contrast enhancement (c, d) or a T2W protocol (e, f). Brain (B), spinal cord (SC), subcutaneous fat (F), and liver (L) are identified for orientation. SCI lesion (arrows) appears as a hypo-intense region in mice with T1 imaging, a combination of hypo- and hyper-intense in rats, and a hyper-intense region with Gd contrast in both species. With T2W imaging, the hyper-intensity is less contained and demonstrates a larger lesion area in both rats and mice. Hyperintense regions are outlined with a solid line; hypointense regions are outlined with a dashed line. Size bar = A, B, C and D = 0.45cm; E = 0.74cm; F = 0.4cm.
Gd injections were used to demonstrate breakdown of the BSCB and to improve contrast in T1W protocols. With this protocol, nearly the same area of hypointensity observed in T1 images pre-contrast (Fig. 1a) appears in mice as hyper-intense regions post-contrast (Fig. 1c). However, in rats, a large hyper-intense region is visible, and demonstrated more rostral/caudal elongation than that seen in mice (Fig. 1d), suggesting more extensive BSCB breakdown in rats.
With T2W imaging protocols, injury areas appear as a hyper-intense region surrounding a hypo-intense region in both rats and mice. The extent of the mouse spinal cord injured area identified with the T2W imaging protocol appears larger than with T1W protocol, and shows less clearly defined edges (Fig. 1e). The rat lesion using the T2W protocol is also larger than that seen with T1W imaging with Gd, extending rostral and caudal to the lesion epicenter (Fig. 1f).
H&E staining was used to compare lesion morphology in histological sections and MRI-based images at 28 days post-injury. Histological staining revealed a restricted injury site in mouse tissue, with a small area of cavitation surrounded by disordered tissue and evidence of scar formation (Fig. 2a, b – dotted line outlines lesion area). The area of cavitation aligned well with the areas of hyper-intensity in T1W MRI images with Gd. However, extension of inflammation and disorganized tissue away from the cavitation was not reflected in T1W images. T2W images, on the other hand, appeared to show good correlation with the extension of disorganized tissue away from the lesion epicenter, as shown by qualitative similarities between the hyperintense regions and the outlined region in the H&E section.
Figure 2.
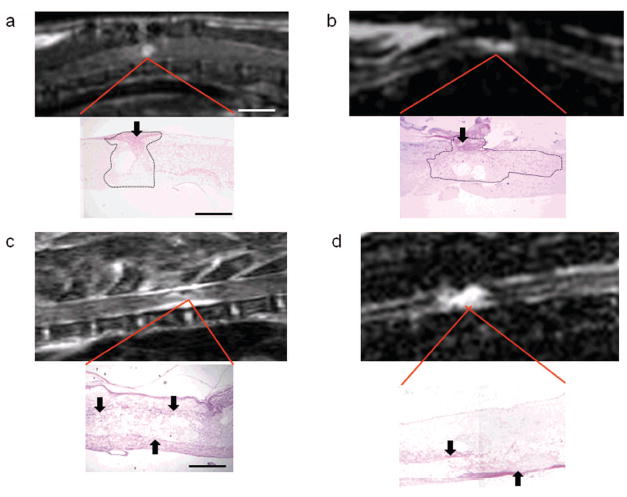
Comparison of mouse and rat MRI and histological images. T1W MRI with Gd enhancement (a, c), or T2W MRI (b, d) were performed at 28 days post-injury in mice (a, b) and rats (c, d). Enlarged region representation in H&E-stained sections provides histological comparisons. In mice, Gd contrast in T1W images indicates an area of increased signal intensity that correlates with a small area of cavitation. However, tissue disorganization and inflammation (dotted line outline) and evidence of scarring (black arrows) are not found in the MRI image. An extended lesion is observed in mice with T2W MRI, as shown by hyper-intensity surrounding an area of hypointensity, which correlates with a small area of cavitation surrounded by disorganized tissue and inflammation in histological samples (dotted line outline). In rats, Gd contrast in T1W images indicates an area of increased signal intensity surrounding a hypo-intense area that correlates with an expanded lesion site (disorganized tissue and cavitation). However, the lesion area in histological sections appears larger than what is seen with MRI. An extended lesion in rats can also be seen with T2W MRI, as seen by hyper-intensity surrounding an area of hypointensity, which correlates with a small area of cavitation surrounded by disorganized tissue and inflammation in histological samples. Size bar (MRI Images): a, c = 0.45cm; b = 0.7cm; d = 1cm. (Histology images): a, b = 0.19 cm; c, d = 0.05cm.
Rat tissue demonstrated an elongated lesion area, which included multiple cavities, evidence of extensive inflammation and scar formation surrounding the border, and a large degree of disordered tissue (Fig. 2c, d). Although both T1W and T2W images show extension of hyperintensity rostral and caudal to the epicenter, T1W images were more difficult to delineate and rostral caudal extension was blurred at the edges. In contrast, more details of the lesion could be detected in the T2W image, including areas of cavitation and tissue disorganization extending away from the lesion site that correlate well with the histological sections.
Anatomical correlation in rats and mice
Due to the better comparability between T2W and histological sections, T2W MRI images were utilized to investigate neuropathological correlations. Immunohistochemical staining for the glial scar using an antibody against GFAP demonstrated demarcation of the lesion in both rats and mice, as well as rostral/caudal extension of up-regulated GFAP labeling. The core of the lesion appeared to be devoid of GFAP labeling in both species; this correlated well with the core of the hyper-intense region in mouse and rat T2W MRI images (Fig. 3).
Figure 3.
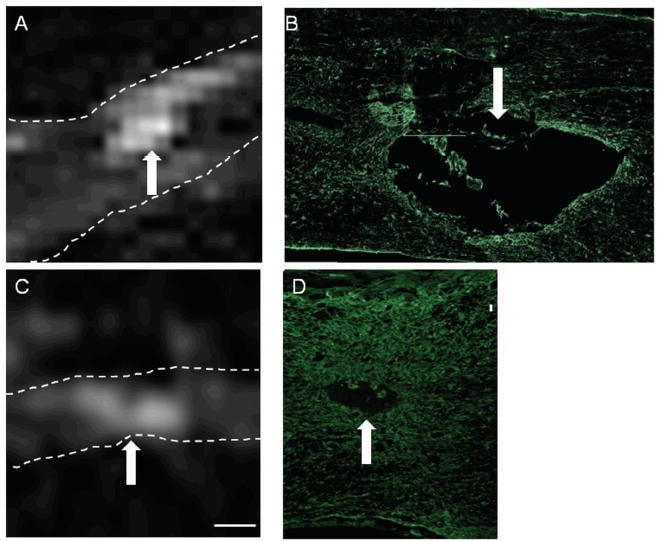
Correlation between T2W hyper-intense regions and GFAP immunolabeling. The spinal cord is highlighted by the dotted lines. T2W MRI images from rats (A) and mice (C), show areas of hyper-intensity (arrows). Comparison of those regions to sections immunolabeled with an antibody against GFAP shows delineation of the primary hyper-intense region (arrows) in rats (B) and mice (D). Size Bars: A = 0.73cm, B = 0.22cm, C, D = 0.08cm.
Immunolocalization was also performed for microglia and macrophages, using an antibody against Iba-1 (Fig. 4). In contrast to GFAP, Iba-1 immunolabeling was found both in the core of the lesion as well as in the surrounding tissue in mice. There was strong similarity between areas immunolabeled with Iba-1 and signal change in the T2W MRI, as Iba-1 immunolabeling was found both in the central cavitation as well as rostral and caudal to the epicenter.
Figure 4.
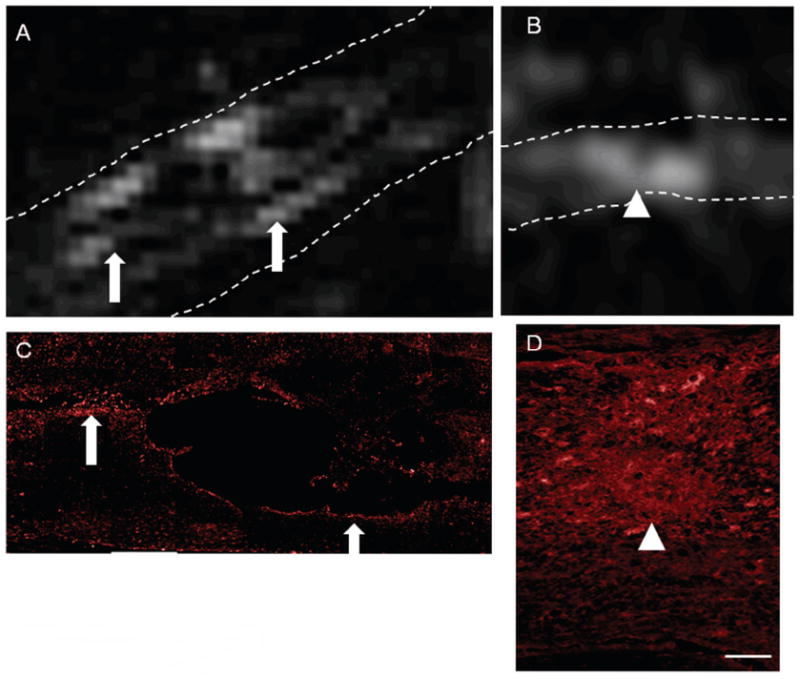
Correlation between T2W hyper-intense regions and Iba-1 immunolabeling. The spinal cord is highlighted by the dotted lines. T2W MRI images from rats (A) and mice (B), show areas of hyper-intensity (arrows, arrowheads). Comparisons of those regions in rat tissue to sections immunolabeled with an antibody against Iba-1 shows similarities between hyper-intense regions and Iba-1 regions (A, C; arrows). Similarly, Iba-1 staining (D) and regions of hyper-intensity (D) were comparable in mice (arrowheads). Size Bars: A = 0.73cm, C = 0.22cm, B, D = 0.08cm.
As with GFAP, Iba-1 immunoreactivity in rats appeared to be primarily restricted to the lesion edges with little labeling in the epicenter of the lesion. Iba-1 immunolabeling was found rostral and caudal to the epicenter, often surrounding extensions of the central cavitation. Comparison of the immunolabeling of Iba-1 and the areas of hyper-intensity of the T2W image demonstrated marked similarity between areas of positive labeling and hyper-intensity (Fig. 4, arrows).
BSCB permeability in rats and mice
A primary component of SCI is BSCB breakdown. As Gd labeling was observed at 28 days post-injury, BSCB permeability was tested in rats and mice to determine if Gd labeling was associated with BSCB breakdown and to determine the level of breakdown between the two species. A large or small molecular weight tracer was injected into each 30 minutes prior to perfusion. The large molecular weight tracer, Evan’s blue, was not found in either rats or mice, indicating an absence of permeability to large molecular weight compounds in both species (data not shown). Using sodium fluorescein, however, there was restricted penetration into the mouse spinal cord, confined to a small area of the spinal cord (Fig. 5a). This area was similar to that appearing as hyper-intense in T1W MRI with Gd contrast, as well as the area of cavitation in mouse histology (Fig. 2a). Rat penetration was far more diffuse and extended rostral and caudal to the lesion site (Fig. 5b) – again similar to that seen with Gd contrast enhancement in T1W MRI (Fig. 2a).
Figure 5.
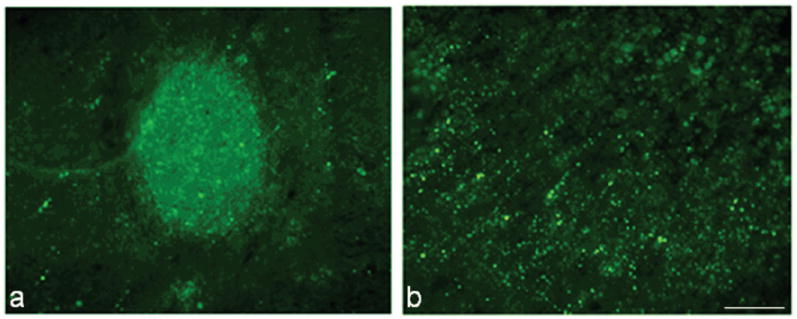
Sodium fluorescein was used to determine blood-spinal-cord-barrier (BSCB) permeability at 28 days after SCI in mouse (a) and rat studies (b). Sodium fluorescein (bright green) which has passed through the BSCB is apparent at the lesion site, in an area associated with a small cavity, in mouse tissue (a), with little extension into surrounding tissue. Tracer is found to spread rostral and caudal to the injury site in rat tissue (b). Bar = 167μm.
Lesion volume: MRI and histology
Analysis of lesion volume using T1W images with Gd contrast demonstrated a volume of 0.024 cm3 +/- 0.003 in rats and 0.016 cm3 +/- 0.006 in mice (Fig. 6). Using the T2W images, lesion volume for rats was 0.18 cm3 +/- 0.03 and for mice was 0.008 cm3 +/- 0.003 (Fig. 6). Histology revealed an average lesion volume of 0.049 cm3 +/- 0.009 in rats and 0.011 cm3 +/- 0.005 in mice (Fig. 6).
Figure 6.
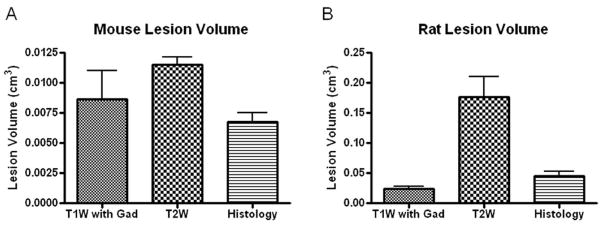
Quantitation of lesion site using T1W (n = 4/species) or T2W (n = 5/species) MRI protocols and histology (n = 9/species) was performed for rats (A) and mice (B). Bars represent mean +/- SEM.
Correlation analysis was performed to compare lesion volumes obtained with the different MRI imaging protocols for rats and mice. Plots of Gd-enhanced T1W image-derived lesion volume and histological lesion volume revealed an r2 value of 0.0139 and 0.0046 for rats and mice, respectively, indicating substantial errors of lesion size prediction by T1W imaging (Fig. 7a, b). Correlation of values obtained with T2W imaging and quantitative histology were markedly higher, with an r2 value of 0.81 and 0.77 for rats and mice, respectively (Fig. 7c, d). These data suggest that, quantitatively, T2W images are more accurate in predicting lesion volume than T1W images in both rats and mice.
Figure 7.
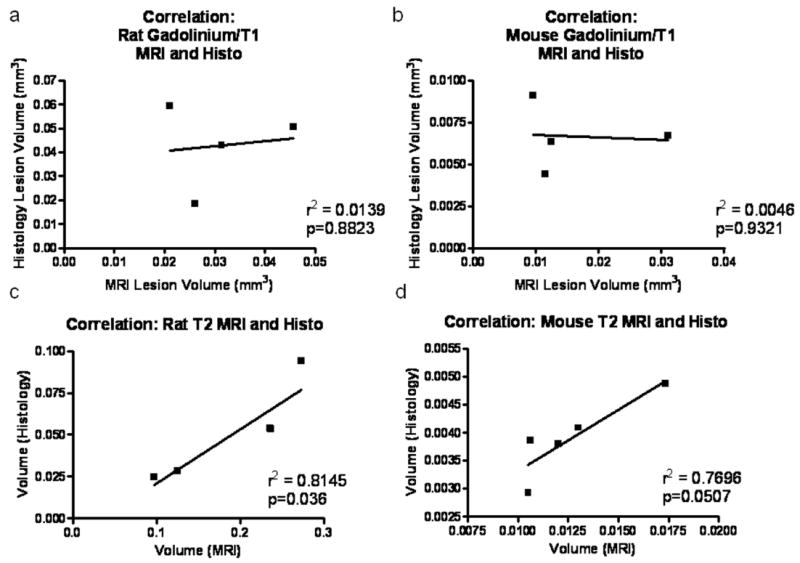
Correlation analysis of MRI and histological quantitation of lesion volume. Correlation analysis was performed on lesion volumes obtained from MRI with Gd contrast (a, b) and T2W MRI (c, d) in rats (a, c) and mice (b, d). N = 4/species for Gd contrast; n = 5/species for T2W MRI.
Functional recovery correlation in rats and mice
Functional testing was performed weekly following SCI in both rats and mice using the open field test with the BBB score. Sham-injured rats and mice were also assessed weekly to demonstrate normal behavior for both species. Both species showed moderate recovery continuing through 28 days post-injury (Fig. 8). Rats achieved an average score of 11.0 +/- 0.6 by 28 days post-injury, representing consistent plantar stepping behavior without coordination. Mice performed slightly better using this scoring paradigm, achieving an average score of 12.7 +/- 0.9 by 28 days post-injury, representing consistent plantar stepping and coordination, without toe clearance.
Figure 8.
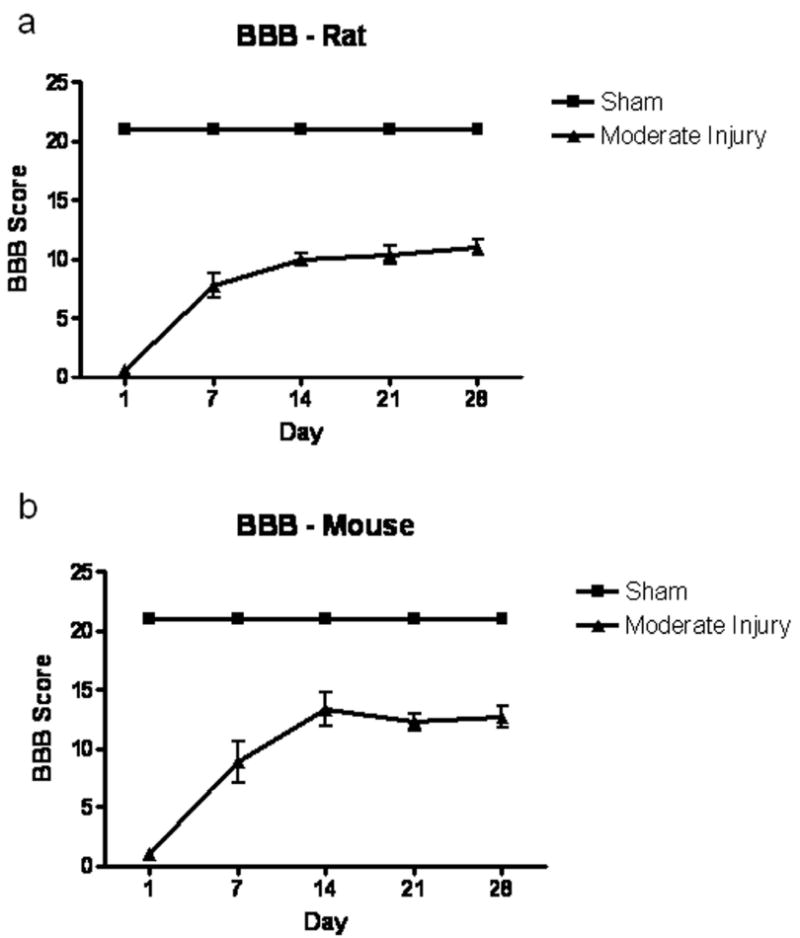
BBB scores for rat and mouse studies following spinal cord injury. Rats (A) and mice (B) underwent functional testing using an open field score, the BBB. Both species showed moderate recovery through 28 days post-injury. N = 9/species.
Lesion volume obtained using Gd/T1 MRI protocols revealed no significant correlation with functional outcome at day 28 post-injury (r2=0.0045, 0.4527 for mice and rats, respectively; Fig. 9a, b). T2W MRI provided a better approximation for determining functional outcome in both rats and mice; r2 = 0.9757 and 0.8906 with a significant p value in mice and rats, respectively (p=0.002 in mice; p=0.005 in rats; Fig. 9c, d). Again, these data suggest that, quantitatively, T2W images are more accurate in predicting function than T1W images in both rats and mice.
Figure 9.
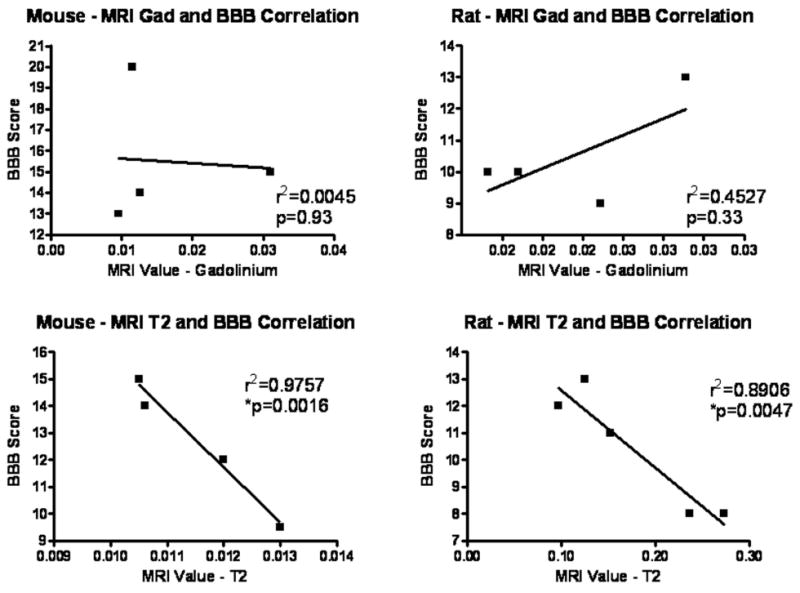
Correlation analysis of MRI and functional outcome. Correlation analysis was performed on lesion volumes obtained from MRI with Gd contrast (a, b) and T2W MRI (c, d). Data from mouse (a, c) and rat studies (b, d) at day 28 post-injury were utilized. N = 4/species for Gd contrast; n = 5/species for T2W MRI.
DISCUSSION
MRI is the method of choice for noninvasive imaging of spinal cord damage. Following injury, the spinal cord demonstrates hemorrhage, edema, axonal damage, and neuronal death, followed by cyst formation in rats versus a tissue-filled area in mice (24-26) that can be tracked over time (1,8,14,27) and/or following different treatment strategies (19,28). The data from the current work indicate that moderate SCI results in distinct patterns in rats and mice that can be visualized using MRI imaging technology. For example, the presence of hyperintensity in both T1W and T2W images of rat spinal cord may indicate late subacute hemorrhage, while hypointense T1W signal and hyperintense T2W signal in mice is most likely related to an edematous or cystic lesion. Further, these data demonstrate that different imaging protocols result in the visualization of various aspects of the injury pattern.
MRI following human SCI has been correlated with histology and function (29-32), and is a standard imaging protocol for patients following acute spine injury, such as fracture or unstable injury (33). MRI has positively identified edema, hemorrhage and cavitation in clinical settings (30), which were identified in mice and rats in the current study.
The primary difference in the pathological progression after SCI in rats and mice appears to be formation of a large cyst or cavity near the lesion site and extension of inflammation rostral and caudal to the lesion. While rats demonstrate significant cavity formation that extends rostral and caudal to the lesion epicenter, which is proposed to be a result of removal of damaged tissue by phagocytic cells (macrophages and microglia), mice fail to demonstrate much, if any, cavitation (34,35). In mice, the area of the lesion is normally filled with inflammatory cells and connective tissue (34). The current study was consistent with these results (Fig. 4), and showed little evidence of cavitation in mice using T1W imaging and only small amounts of cavitation with T2W imaging or histology. Similarly, Bilgen et al. found extension of hyper-intense regions in what they defined as ‘diffuse’ injured mice using a T2W protocol and an implanted coil in the mouse (1). Although there were high positive correlations between T2W MRI-derived lesion volume and histologically-based lesion volume and function at day 28 in both rats and mice, it is important to note that the correlation between MRI and histology was better in rats. However, it is important to note that tissue fixation and processing results in an overall reduction in tissue size and the resultant measure of lesion volume; while this permits a correlation between MRI and histological results, direct comparison is not possible. Ditor et al. (36) found that there was little actual complete agreement between lesion volume determined by T2W MRI and histology, due to processing artifact.
Throughout the study, components of the injury device and injury procedure were maintained identically between species, including stabilization of the vertebral column before injury and standardization of the laminectomy and start point (impact point), to produce similar injury pathologies (37). Both rats and mice underwent weight drop injury using a device designed by the same investigator, with identical parameters. These two devices also result in similar functional responses as measured by performance on the BBB score, as well as similar gene expression changes after spinal cord injury in rats and mice (http://microarray.cnmcresearch.org/home.do). Further, the use of a correlation between motor-function based measurements and MRI-based lesion volumes provides a method to avoid complications induced by differences in anesthetic dose. It has been reported that isoflurane may have neuroprotective effects, while pentobarbital may result in worse outcome (38); however, our study found no significant difference between function of rats and mice on a standardized functional scale, suggesting that outcomes are comparable.
Elevated T2W signal has been shown to be associated with the presence of inflammatory cells (39), edema and demyelination (40). In rat tissue, elevated T2W signal was detected to extend rostral/caudal to the lesion epicenter, and was more diffuse than the amount of cavitation that was observed; while the lesion volume correlated well, the extensive hyper-intensity may have also been influenced by the presence of diffuse inflammatory microglia and macrophages. Immunolabeling of macrophages/microglia in rat tissue correlated well with the extension of the hyper-intensity in T2W MRI of rat spinal cord tissue. Mouse T2W MRI also showed comparable Iba-1 (microglia/macrophage presence) and the hyper-intensity in the MRI image; the Iba-1 signal was restricted to the lesion epicenter, as was the hyper-intense signal. In addition, GFAP immunolabeling showed correlation to T2W MRI hyper-intense regions in both rats and mice, demonstrating demarcation of the lesion/hyper-intense area. These findings suggest that T2W MRI may be useful to identify locations of glial scar and inflammation in injured spinal cord. Further, demyelination differences may be an additional source of pathological difference in T2W MRI images between the 2 species, and should be considered in future studies.
T1 with Gd/Omniscan contrast showed hyper-intensity in areas similar to the location of sodium fluorescein in both rats and mice. Sodium fluorescein was found to extend rostral and caudal to the lesion in rats, and was restricted to a small area of cavitation in mice. It is noteable that this diffusion pattern is similar to the inflammatory pattern observed with Iba-1 immunolabeling in both rats and mice, and may reflect the influence of diffuse inflammation. It has been previously reported that areas of microglial activation in the spinal cord are highly correlated with areas of BSCB permeability(41). Gd has a molecular weight of 573 Da, similar to sodium fluorescein (376 Da), but much less than Evan’s blue (69 kDa), which was not found within spinal cord tissue at 28 days post-injury in rats or mice. It has been proposed that BSCB permeability at this time point after SCI may be related to angiogenesis or inflammation (41). Together, these data suggest an equal amount of BSCB permeability, and therefore responses to injury, at least at the lesion epicenter, in the two species.
One concern to be considered for the current study is the difference in resolution capability between rats and mice. T1W MRI protocols were performed identically in rats and mice, but the FOV was reduced to try to improve resolution for T2W images. However, it is possible that some size measurements could be affected by reduced resolution in mice images, particularly with T1W MRI images.
In conclusion, our study investigated the difference in spinal cord neuropathology between rats and mice using MRI T1W and T2W protocols. While T2W imaging was found to present the best correlation to lesion volume in both species, both T1W and T2W protocols provided useful discrimination in pathological responses, including glial scar formation and BSCB permeability. Further, T2W imaging showed better correlation with functional recovery in both species after injury. This study therefore demonstrates that T2W and T1W MRI is a useful tool for detecting differences in pathological responses to spinal cord injury in rodents.
Acknowledgments
Funding support: National Institutes of Health/NINDS R01 [grant number 5R01NS037313-08]).
References
- 1.Bilgen M, Al-Hafez B, Alrefae T, et al. Longitudinal magnetic resonance imaging of spinal cord injury in mouse: changes in signal patterns associated with the inflammatory response. Magn Reson Imaging. 2007;25(5):657–664. doi: 10.1016/j.mri.2006.10.009. [DOI] [PubMed] [Google Scholar]
- 2.Tang X, Davies JE, Davies SJ. Changes in distribution, cell associations, and protein expression levels of NG2, neurocan, phosphacan, brevican, versican V2, and tenascin-C during acute to chronic maturation of spinal cord scar tissue. J Neurosci Res. 2003;71(3):427–444. doi: 10.1002/jnr.10523. [DOI] [PubMed] [Google Scholar]
- 3.Silver J, Miller JH. Regeneration beyond the glial scar. Nature reviews. 2004;5(2):146–156. doi: 10.1038/nrn1326. [DOI] [PubMed] [Google Scholar]
- 4.Potter K, Saifuddin A. Pictorial review: MRI of chronic spinal cord injury. Br J Radiol. 2003;76(905):347–352. doi: 10.1259/bjr/11881183. [DOI] [PubMed] [Google Scholar]
- 5.McGowan JC, Berman JI, Ford JC, Lavi E, Hackney DB. Characterization of experimental spinal cord injury with magnetization transfer ratio histograms. J Magn Reson Imaging. 2000;12(2):247–254. doi: 10.1002/1522-2586(200008)12:2<247::aid-jmri6>3.0.co;2-x. [DOI] [PubMed] [Google Scholar]
- 6.Hackney DB, Ford JC, Markowitz RS, Hand CM, Joseph PM, Black P. Experimental spinal cord injury: MR correlation to intensity of injury. J Comput Assist Tomogr. 1994;18(3):357–362. doi: 10.1097/00004728-199405000-00004. [DOI] [PubMed] [Google Scholar]
- 7.Guizar-Sahagun G, Grijalva I, Salgado-Ceballos H, et al. Spontaneous and induced aberrant sprouting at the site of injury is irrelevant to motor function outcome in rats with spinal cord injury. Brain Res. 2004;1013(2):143–151. doi: 10.1016/j.brainres.2004.03.062. [DOI] [PubMed] [Google Scholar]
- 8.Bilgen M, Abbe R, Narayana PA. Dynamic contrast-enhanced MRI of experimental spinal cord injury: in vivo serial studies. Magn Reson Med. 2001;45(4):614–622. doi: 10.1002/mrm.1083. [DOI] [PubMed] [Google Scholar]
- 9.Pirko I, Fricke ST, Johnson AJ, Rodriguez M, Macura SI. Magnetic resonance imaging, microscopy, and spectroscopy of the central nervous system in experimental animals. NeuroRx. 2005;2(2):250–264. doi: 10.1602/neurorx.2.2.250. [DOI] [PMC free article] [PubMed] [Google Scholar]
- 10.Hannmann TT, Freund M. MRI in the early stage of spinal cord injury: does it have clinical relevance? An experimental study. Rofo. 2007;179(5):506–515. doi: 10.1055/s-2007-962841. [DOI] [PubMed] [Google Scholar]
- 11.Bendszus M, Burger R, Vince GH, Solymosi L. A reproducible model of an epidural mass lesion in rodents. Part II: Characterization by in vivo magnetic resonance imaging. J Neurosurg. 2002;97(6):1419–1423. doi: 10.3171/jns.2002.97.6.1419. [DOI] [PubMed] [Google Scholar]
- 12.Narayana PA, Grill RJ, Chacko T, Vang R. Endogenous recovery of injured spinal cord: longitudinal in vivo magnetic resonance imaging. J Neurosci Res. 2004;78(5):749–759. doi: 10.1002/jnr.20275. [DOI] [PubMed] [Google Scholar]
- 13.Berens SA, Colvin DC, Yu CG, Yezierski RP, Mareci TH. Evaluation of the pathologic characteristics of excitotoxic spinal cord injury with MR imaging. AJNR Am J Neuroradiol. 2005;26(7):1612–1622. [PMC free article] [PubMed] [Google Scholar]
- 14.Runge VM, Wells JW, Baldwin SA, Scheff SW, Blades DA. Evaluation of the temporal evolution of acute spinal cord injury. Invest Radiol. 1997;32(2):105–110. doi: 10.1097/00004424-199702000-00006. [DOI] [PubMed] [Google Scholar]
- 15.Narayana P, Abbe R, Liu SJ, Johnston D. Does loss of gray- and white-matter contrast in injured spinal cord signify secondary injury? In vivo longitudinal MRI studies. Magn Reson Med. 1999;41(2):315–320. doi: 10.1002/(sici)1522-2594(199902)41:2<315::aid-mrm15>3.0.co;2-b. [DOI] [PubMed] [Google Scholar]
- 16.Brightman MW, Ishihara S, Chang L. Penetration of solutes, viruses, and cells across the blood-brain barrier. Curr Top Microbiol Immunol. 1995;202:63–78. doi: 10.1007/978-3-642-79657-9_5. [DOI] [PubMed] [Google Scholar]
- 17.Whetstone WD, Hsu JY, Eisenberg M, Werb Z, Noble-Haeusslein LJ. Blood-spinal cord barrier after spinal cord injury: relation to revascularization and wound healing. J Neurosci Res. 2003;74(2):227–239. doi: 10.1002/jnr.10759. [DOI] [PMC free article] [PubMed] [Google Scholar]
- 18.Bilgen M, Dogan B, Narayana PA. In vivo assessment of blood-spinal cord barrier permeability: serial dynamic contrast enhanced MRI of spinal cord injury. Magn Reson Imaging. 2002;20(4):337–341. doi: 10.1016/s0730-725x(02)00504-0. [DOI] [PubMed] [Google Scholar]
- 19.Byrnes KR, Stoica BA, Fricke S, Di Giovanni S, Faden AI. Cell cycle activation contributes to post-mitotic cell death and secondary damage after spinal cord injury. Brain. 2007;130(Pt 11):2977–2992. doi: 10.1093/brain/awm179. [DOI] [PubMed] [Google Scholar]
- 20.Byrnes KR, Stoica B, Riccio A, Pajoohesh-Ganji A, Loane DJ, Faden AI. Activation of metabotropic glutamate receptor 5 improves recovery after spinal cord injury in rodents. Ann Neurol. 2009;66(1):63–74. doi: 10.1002/ana.21673. [DOI] [PMC free article] [PubMed] [Google Scholar]
- 21.Pajoohesh-Ganji A, Byrnes KR, Fatemi G, Faden AI. A combined scoring method to assess behavioral recovery after mouse spinal cord injury. J Neurosci Res. 2010 doi: 10.1016/j.neures.2010.02.009. In Press. [DOI] [PMC free article] [PubMed] [Google Scholar]
- 22.Basso DM, Beattie MS, Bresnahan JC, et al. MASCIS evaluation of open field locomotor scores: effects of experience and teamwork on reliability. Multicenter Animal Spinal Cord Injury Study. J Neurotrauma. 1996;13(7):343–359. doi: 10.1089/neu.1996.13.343. [DOI] [PubMed] [Google Scholar]
- 23.Fricke ST, Vink R, Chiodo C, Cernak I, Ileva L, Faden AI. Consistent and reproducible slice selection in rodent brain using a novel stereotaxic device for MRI. J Neurosci Methods. 2004;136(1):99–102. doi: 10.1016/j.jneumeth.2004.01.003. [DOI] [PubMed] [Google Scholar]
- 24.Taoka Y, Okajima K. Spinal cord injury in the rat. Prog Neurobiol. 1998;56(3):341–358. doi: 10.1016/s0301-0082(98)00049-5. [DOI] [PubMed] [Google Scholar]
- 25.Bresnahan JC, King JS, Martin GF, Yashon D. A neuroanatomical analysis of spinal cord injury in the rhesus monkey (Macaca mulatta) J Neurol Sci. 1976;28(4):521–542. doi: 10.1016/0022-510x(76)90122-2. [DOI] [PubMed] [Google Scholar]
- 26.Kakulas BA. Pathology of spinal injuries. Cent Nerv Syst Trauma. 1984;1(2):117–129. doi: 10.1089/cns.1984.1.117. [DOI] [PubMed] [Google Scholar]
- 27.Weber T, Vroemen M, Behr V, et al. In vivo high-resolution MR imaging of neuropathologic changes in the injured rat spinal cord. AJNR Am J Neuroradiol. 2006;27(3):598–604. [PMC free article] [PubMed] [Google Scholar]
- 28.Wamil AW, Wamil BD, Hellerqvist CG. CM101-mediated recovery of walking ability in adult mice paralyzed by spinal cord injury. Proc Natl Acad Sci U S A. 1998;95(22):13188–13193. doi: 10.1073/pnas.95.22.13188. [DOI] [PMC free article] [PubMed] [Google Scholar]
- 29.Lammertse D, Dungan D, Dreisbach J, et al. Neuroimaging in traumatic spinal cord injury: an evidence-based review for clinical practice and research. J Spinal Cord Med. 2007;30(3):205–214. doi: 10.1080/10790268.2007.11753928. [DOI] [PMC free article] [PubMed] [Google Scholar]
- 30.Bondurant FJ, Cotler HB, Kulkarni MV, McArdle CB, Harris JH., Jr Acute spinal cord injury. A study using physical examination and magnetic resonance imaging. Spine. 1990;15(3):161–168. [PubMed] [Google Scholar]
- 31.Kulkarni MV, Bondurant FJ, Rose SL, Narayana PA. 1.5 tesla magnetic resonance imaging of acute spinal trauma. Radiographics. 1988;8(6):1059–1082. doi: 10.1148/radiographics.8.6.3205929. [DOI] [PubMed] [Google Scholar]
- 32.Marciello MA, Flanders AE, Herbison GJ, Schaefer DM, Friedman DP, Lane JI. Magnetic resonance imaging related to neurologic outcome in cervical spinal cord injury. Arch Phys Med Rehabil. 1993;74(9):940–946. [PubMed] [Google Scholar]
- 33.Goradia D, Linnau KF, Cohen WA, Mirza S, Hallam DK, Blackmore CC. Correlation of MR imaging findings with intraoperative findings after cervical spine trauma. AJNR Am J Neuroradiol. 2007;28(2):209–215. [PMC free article] [PubMed] [Google Scholar]
- 34.Inman DM, Steward O. Physical size does not determine the unique histopathological response seen in the injured mouse spinal cord. J Neurotrauma. 2003;20(1):33–42. doi: 10.1089/08977150360517164. [DOI] [PubMed] [Google Scholar]
- 35.Gonzalez-Lara LE, Xu X, Hofstetrova K, Pniak A, Brown A, Foster PJ. In vivo magnetic resonance imaging of spinal cord injury in the mouse. J Neurotrauma. 2009;26(5):753–762. doi: 10.1089/neu.2008.0704. [DOI] [PubMed] [Google Scholar]
- 36.Ditor DS, John S, Cakiroglu J, Kittmer C, Foster PJ, Weaver LC. Magnetic resonance imaging versus histological assessment for estimation of lesion volume after experimental spinal cord injury. Laboratory investigation. J Neurosurg Spine. 2008;9(3):301–306. doi: 10.3171/SPI/2008/9/9/301. [DOI] [PubMed] [Google Scholar]
- 37.Stokes BT, Jakeman LB. Experimental modelling of human spinal cord injury: a model that crosses the species barrier and mimics the spectrum of human cytopathology. Spinal Cord. 2002;40(3):101–109. doi: 10.1038/sj.sc.3101254. [DOI] [PubMed] [Google Scholar]
- 38.Grissom TE, Mitzel HC, Bunegin L, Albin MS. The effect of anesthetics on neurologic outcome during the recovery period of spinal cord injury in rats. Anesth Analg. 1994;79(1):66–74. doi: 10.1213/00000539-199407000-00013. [DOI] [PubMed] [Google Scholar]
- 39.Steinbrecher A, Weber T, Neuberger T, et al. Experimental autoimmune encephalomyelitis in the rat spinal cord: lesion detection with high-resolution MR microscopy at 17.6 T. AJNR Am J Neuroradiol. 2005;26(1):19–25. [PMC free article] [PubMed] [Google Scholar]
- 40.Weirich SD, Cotler HB, Narayana PA, et al. Histopathologic correlation of magnetic resonance imaging signal patterns in a spinal cord injury model. Spine (Phila Pa 1976) 1990;15(7):630–638. doi: 10.1097/00007632-199007000-00004. [DOI] [PubMed] [Google Scholar]
- 41.Popovich PG, Horner PJ, Mullin BB, Stokes BT. A quantitative spatial analysis of the blood-spinal cord barrier. I. Permeability changes after experimental spinal contusion injury. Exp Neurol. 1996;142(2):258–275. doi: 10.1006/exnr.1996.0196. [DOI] [PubMed] [Google Scholar]