Abstract
PURPOSE
To provide a framework for characterizing the frequency response of multi-point chemical shift based species separation techniques.
MATERIALS AND METHODS
Multi-point chemical shift based species separation techniques acquire complex images at multiple echo times and perform maximum likelihood estimation to decompose signal from different species into separate images. In general, after a non-linear process of estimating and demodulating the field map, these decomposition methods are linear transforms from the echo-time domain to the chemical-shift-frequency domain, analogous to the Discrete Fourier Transform (DFT). In this work, we describe a technique for finding the magnitude and phase of chemical shift decomposition for input signals over a range of frequencies using numerical and experimental modeling and examine several important cases of species separation.
RESULTS
Simple expressions can be derived to describe the response to a wide variety of input signals. Agreement between numerical modeling and experimental results is very good.
CONCLUSION
Chemical shift based species separation is linear, and therefore can be fully described by the magnitude and phase curves of the frequency response. The periodic nature of the frequency response has important implications for the robustness of various techniques for resolving ambiguities in field inhomogeneity.
Keywords: Dixon imaging, fat imaging, water/fat separation, chemical shift imaging
INTRODUCTION
Multipoint chemical shift based decomposition techniques use complex images at various echo times to generate separate water and fat images (1–12). These techniques can easily be extended to applications with more than two species such as fat/water/silicone imaging (4,13) as well as cases in which a single species has multiple resonant peaks or a range of resonant signal, such as fat (14,15), hyperpolarized 13C imaging (16,17) and positive contrast off-resonance imaging of superparamagnetic iron oxides (SPIOs) (18).
After a non-linear step of estimating and demodulating the field map (through iterative (4,19) or non-linear (12) estimation processes not further discussed in this work), these decomposition algorithms can be viewed as a linear transform from the time domain to the frequency domain, using echo images as input and yielding a set of estimated species images as output, analogous to (and in certain cases equivalent to) the Discrete Fourier Transform (DFT). While a great deal of flexibility exists in the design of these transforms, limits on the number and temporal extent of the echo images implies that their frequency responses are necessarily constrained. Generally, each transform is designed to maximize the response to the species of interest while minimizing response at the resonant frequency of each of the other specified species. The behavior of these transforms at other intermediate frequencies is rarely considered, though it can substantially impact image quality. Residual errors in the field map estimation can be modeled as an unexpected shift in the peak frequency or frequencies of all species, changes in temperature can lead to variations in the relative shift between species, and phenomena such as spectral broadening due to T2*, or j-coupling can lead to signal peaks with non-zero widths that cover a range of frequencies. Thus it is important to consider the response of these systems to signal that is not exactly at the modeled peak. To the best of our knowledge, the frequency response of chemical shift based separation methods has not been described in the literature. Because the decomposition process is linear, the species estimate for an input signal that is the sum of several off-resonant components is simply the sum of what the species estimates would be for each of those signals individually. This greatly simplifies analysis, as the frequency response curve thus characterizes the behavior for any ratio of water and fat in combination with errors in field map estimation.
This work describes an approach for evaluating the frequency response of multipoint chemical shift based species decomposition techniques and examines the frequency response for several important cases, including 1) water/fat separation assuming a reconstruction model using a single discrete spectral peak of fat with three optimally spaced echoes (5,20), 2) water/fat separation with a reconstruction model using a multipeak spectral representation of fat (14,15), 3) water/fat separation with differing echoes and spacing, and 4) water/fat/silicone separation using four echoes (4). For the commonly used three-echo water/fat decomposition method, simplified expressions are derived for the frequency response and compared to a response derived through numerical modeling and the experimental response measured from phantom scans.
THEORY
Consider an MRI acquisition collecting N echoes (n = 1, …, N) centered at times tn from an object composed of M species (m = 1, …, M), each with complex spatial distribution ρm(r) and real spectral distribution am(Δf) (normalized to sum to unity) over a range of chemical shift frequencies (14,15). In a situation where the effects of T2* decay are minimal (i.e. T2* is relatively long compared to the echo spacing) and that sources of signal and the field map remains constant between echo acquisitions, the signal sn(r) for a voxel at location r in echo n is:
| [1] |
where ψ(r) is the Bo field inhomogeneity at location r. Assuming ψ(r) is known or has been reasonably estimated, it is demodulated and thus removed from the signal model in Eq. 1, yielding ŝn(r):
| [2] |
Any remaining errors in the signal model, for example due to T2* or errors in the estimation of the field map or species spectral distribution, can be analyzed through the frequency response of the decomposition.
The signal equation in [2] can be expressed as:
| [3] |
where:
| [4] |
This system of linear equations can be represented in matrix notation as:
| [5] |
where:
| [6] |
With sufficient measurements (N ≥ M) and judicious choice of tn, the unique maximum likelihood estimate for ρ(r), ρ̂(r), can be obtained using the Moore-Penrose pseudo-inverse to perform a least-squares estimation of the species, i.e.:
| [7] |
where A+ represents the Moore-Penrose pseudo-inverse of matrix A, which is calculated as follows:
| [8] |
where the superscript symbol H representing the operation of taking the Hermitian transpose (adjoint) of the preceding matrix.
In the common case where each species can be modeled as having signal at only a single resonant peak, Eq. 4 can be simplified to:
| [9] |
where Δfm is the chemical shift frequency for species m.
For the purposes of this work, we often describe echo spacing in terms of the phase accumulated by an off-resonant species between echoes. Previous work associated with the Iterative Decomposition of Water and Fat with Echo Asymmetry and Least-squares Estimation (IDEAL) technique (4) where fat is modeled as a single peak demonstrated that the SNR performance of a three-point water-fat decomposition was maximized for an echo spacing such that the phase between water and fat shifted by 2π/3 between each echo (20). Although these echo shifts are also optimal from a SNR performance standpoint for other decomposition techniques, they will be referred to as the “IDEAL echo spacing” in this manuscript, as the optimality were first described in the context of the IDEAL water-fat separation method.
For cases in which both the echoes and chemical shift frequencies are equal in number and equally spaced, the least squares multipoint decomposition is in fact equivalent to the Discrete Fourier Transform (DFT). Ignoring the effects of center frequency errors and T2* decay, the equation for the signal sn, at time tn, is:
| [10] |
where it is made up of M species, each with complex intensity ρm and known chemical-shift frequency Δfm, for m = 0, …, M−1. (i.e. M distinct bins in the frequency domain).
In a situation where the frequency bins are equally spaced, their chemical shift frequencies can be written as:
| [11] |
where m = 0, …, M−1, such that the “first” bin is on resonance and the remaining species are at equal increments of Δf away. Given N complex samples (echoes), evenly spaced in time such that a phasor at frequency Δf has its angle uniformly distributed over the 2π unit circle, i.e.:
| [12] |
then sample (echo) times will be,
| [13] |
where n=0, …, N−1. When the number of samples equals the number of frequency bins (N=M), these echo times can be substituted into Eq. [10] to show that:
| [14] |
which is simply the discrete Fourier transform (DFT) of ρm. Thus, when the number of acquired time points equals the number of frequency bins and both the frequency bins and echo times are equally spaced, the least squares decomposition used for chemical species is equivalent to the DFT.
MATERIALS AND METHODS
The frequency response was examined for several decomposition scenarios that are of interest clinically. All simulations and experiments were executed for 3T imaging. These include:
Decomposition of water and fat from three-point IDEAL (−π/6, +π/2, +7π/6), assuming a reconstruction model with a single discrete fat peak (20)
Comparison of the above with two-point Dixon (0, π) and three-point Dixon (0, π, 2π), echo sets for a water/fat decomposition using a single discrete fat peak (1–3)
Comparison of water/fat decomposition (modeling fat as a single discrete peak) with IDEAL using 2π/3 echo spacing and IDEAL using 4π/3 echo spacing, the next spacing that has optimal signal averaging efficiency (20)
Decomposition of water and fat using a multi-peak spectral signal distribution model that more accurately represents the spectral complexity of fat as described below (14)
Decomposition of water, fat, and silicone from four optimally-spaced echoes, positioned at 0, π, 2π, 3π for fat and 3π/2, 3π, 9π/2 for silicone, using a single-peak model for fat (4)
Each of these scenarios is analyzed using numerical modeling, using scripts written in MATLAB 7.5 (The MathWorks Inc., Natick, MA) on x86 workstations. The common case of water and fat decomposition from three optimally-spaced echoes with a single-peak fat model was further developed to provide a simplified solution. A noise sensitivity analysis was performed on one representative case, the three-echo water/fat decomposition.
Numerical Analysis Of Frequency Response
Frequency response curves are calculated numerically by constructing the decomposition matrix, A, for a desired set of species (with assumed spectral model) and given echo spacing (4). A simulated test signal is then synthesized at each echo time over a range of input frequencies. The frequency response was evaluated for simulated input signal at 1 Hz intervals from −1000 Hz to +1000 Hz. At each of these off-resonance frequencies, the decomposition operation is performed on the synthesized data, yielding density estimates for each species that are then plotted against the corresponding off-resonance frequency.
Simplified Expression For Three-Echo Water/Fat Decomposition
For the common case of water/fat decomposition with single peak models using a three-echo acquisition, it is relatively straightforward to reduce the matrix calculations into algebraic expressions for estimates of the complex water (ρ̂water) and fat (ρ̂fat) density based on the presumed fat chemical shift frequency, Δffat, the echo times, t1, t2, t3, and the off-resonance frequency, Δf, of a unit input signal:
| [15] |
where p is a simple scale factor that depends solely on echo spacing:
| [16] |
Note that the terms summed in the expression for water density are complex phasors related to the off-resonance frequency Δf, while the terms in the expression for fat density substitute “Δf − Δffat” in place of “Δf”. This provides the theoretical basis for the observation that the frequency responses for the two species are simply shifted versions of one other, in the case where fat is modeled as a single discrete spectral peak. This symmetry breaks down when fat is modeled with multiple peaks in the decomposition, as shown below. The resultant water and fat density estimates are evaluated at discrete points along a frequency sweep, as described in the previous section on numerical analysis. Simplified expressions can also be written for decomposition with larger numbers of species or echoes, though the complexity grows rapidly due to the number of possible combinations in the product terms.
Experimental Measurement Of Frequency Response
A manufacturer-provided 10-cm diameter cylindrical phantom filled with distilled water doped with NiCl2 (Quadrature Lower Extremity Phantom, P/N #14246, IGC – Medical Advances, Milwaukee, WI) was scanned in a 3.0 T clinical scanner (Signa HDx, TwinSpeed, GE Healthcare, Waukesha, WI) using a single-channel quadrature transmit/receive extremity coil. A 2D Cartesian FSE-IDEAL sequence was used with a TR of 250ms, an echo train length of 16, 256×256 matrix, and ±62.5 kHz receiver bandwidth to image a 24 cm FOV with a slice thickness of 1 cm. Three echoes were collected at TEs of −0.20, +0.60, and +1.40 ms, relative to the spin-echo. These echo shifts correspond to the optimal echo choices (−π/6, +π/2, +7π/6) that maximize the SNR performance for water/fat decomposition at 3.0 T (5,20).
The scanner’s gradient shim mechanism was deliberately adjusted to induce a linear B0 field gradient in the phase-encoding direction across the phantom for this scan. After an automatic prescan was used to achieve a uniform shim over the phantom, a deliberate field map variation of 19 Hz/mm was manually introduced, leading to a large, linear center-field variation across the phantom. Because the interior of this phantom was homogeneous and the induced field inhomogeneity was set in the phase encoding direction, chemical shift artifacts in the frequency encoding direction resulting from the shim were avoided.
A large region of interest (ROI) was selected to cover the entire homogeneous interior of the phantom. This ROI measured 6.0 cm wide by 13.5 cm long (64×144 pixels), with the long axis aligned with the direction of field map variation. The dataset was processed in MATLAB 7.5 (The MathWorks Inc., Natick, MA) to yield frequency response for every pixel in the ROI. For each pixel, its off-resonance frequency was estimated by calculating the slope of the phase progression between the first two echoes (using phase-unwrapping to account for 2π phase wraps). To correct for variations in B1 coil sensitivity, each pixel was normalized by linearly scaling its complex echo data vector (s) such that the sum of the magnitude of the signals at each echo (the s vector’s L1 norm) was three. The pixel signal was then decomposed into its species components under the assumption that there was no field map variation at that point according to Eq. 7. For each pixel, these estimates of water and fat were plotted against the estimated field map, yielding a scatter plot of the frequency response.
Decomposition Of Water And Fat With Multi-peak Modeling Of Fat Spectrum
Although most chemical shift based fat-water decomposition methods model fat as a single discrete peak shifted −420 Hz away from the water peak (at 3T), it is well known that the NMR spectrum of fat has multiple peaks (21,22). Accurate spectral modeling of a species with more than one peak, where the relative amplitudes of the peaks and chemical shifts of the peaks are known a priori, has been shown to provide more accurate separation of 13C labeled compounds (16,17) and more recently for fat/water decomposition for both qualitative (14) and quantitative (14,23,24) applications. In the recent work of Yu et al. (14), it was shown that adipose tissue could be accurately modeled with six discrete signal peaks at specific chemical shift frequencies, with 1) 62% signal at −420 Hz (−3.3 ppm relative to water), 2) 15% signal at −318 Hz (−2.5 ppm), 3) 10% signal at +94 Hz (+0.7 ppm), 4) 6% signal at −472 Hz (−3.7 ppm), 5) 4% signal at −46 Hz (−0.4 ppm), and 6) 3% signal at −234 Hz (−1.8 ppm). Decomposition was performed using this model and compared to that obtained using the single-peak model.
Aside from errors in field map estimation, another factor that can contribute to decomposition errors is the assumption of an incorrect signal spectrum for fat. To examine the robustness of the model to errors in the fat signal spectrum, simulations were performed modeling fat with variations of the above spectrum, with the olefinic peak (#3, +94 Hz) component varied from 0 to 20% in 5% increments, and the other components normalized such that the signal summed to unity. For each modeled spectrum, an input signal composed of both water and fat (using the multipeak spectrum mentioned earlier, from Yu et al.) was decomposed, for fat fractions ranging from 0 to 100% in 1% increments.
Numerical Modeling Of Noise Sensitivity
To confirm that the numerical analysis experiment properly represents the sensitivity of the decomposition to noise, the three-echo W/F decomposition was performed with complex noise of variance σ2 added to the unit signal in each of the echoes, corresponding to an imaging signal to noise ratio (SNR) of 1/σ. The experiment was repeated 10000 times each for SNRs of 1000, 100, 10, 1, and 0.1. For each noise level, the mean and standard deviation in the water and fat species outputs were calculated at each point along the frequency response curve.
RESULTS
Decomposition Of Water And Fat Using A Single Peak Decomposition Model
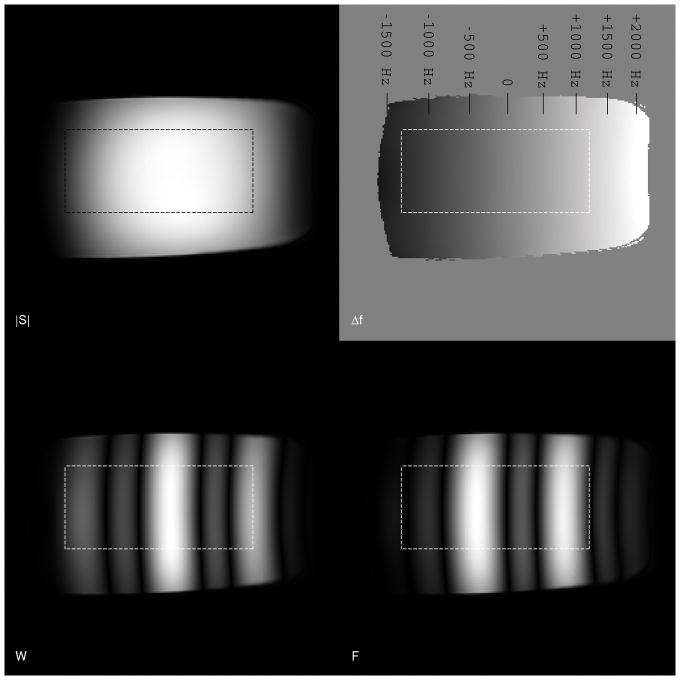
For the common case of decomposing water and fat from three optimally-spaced echoes, the decomposition was simulated for the same echo times used in the phantom experiment described earlier. The decomposition leads to a banded frequency sensitivity pattern familiar from many frequency-selective imaging techniques. Figure 1 shows the experimental results, with the magnitude image from the first echo (upper left), the estimated off-resonance frequency (upper right), and the water (left) and fat (right) estimates below. Figure 2 shows the magnitude and phase of the water and fat frequency response curves. The curves obtained with numerical analysis and the closed-form solutions are identical and are shown as a solid line, with the experimental results shown using the overlaid crosses (to improve visibility, only every 128th sample point is shown, corresponding to visible point spacing of approximately 30–40 Hz).
Figure 1.
Experimental results using a deliberate center frequency skew across a phantom show the expected “banded” frequency response in the water and fat images. The phantom is a homogenous cylinder filled with doped water and the center frequency was chosen to vary linearly over a range of 3500 Hz. The magnitude image and estimated field map are shown in the top row, and the decomposed water and fat estimates are below. ROI is shown as a dashed box.
Figure 2.
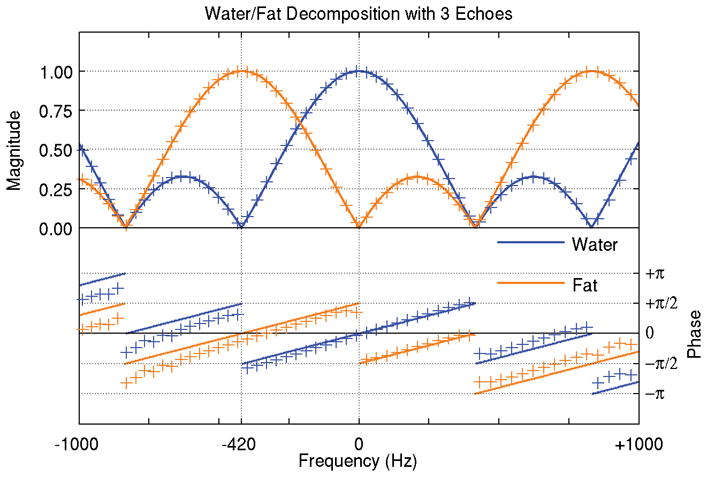
For conventional water/fat decomposition using three optimally spaced echoes, the modeled frequency response curves for water and fat (solid lines) closely track experimental results (+ markers). The agreement in the magnitude response is nearly exact. The slight phase disagreement is attributed to a spatially varying coil sensitivity phase profile.
Each frequency response curve shows a peak response of unity at the frequency of the desired species and a minimum response of zero at the frequency of the other species. The target frequency is in the center of a main lobe with 840 Hz total width and a full width at half maximum (FWHM) of 528 Hz. Smaller side lobes 420 Hz wide are on either side. The fat frequency response is a shifted version of the water response and has the identical shape. Aliased copies of the sensitivity pattern are spaced 1260 Hz apart, corresponding to three times the chemical shift between water and fat.
There is substantial overlap in the curves at intermediate frequencies between −420 and 0 Hz. Thus, in the absence of field map correction, off-resonance signal in that range will be decomposed into some combination of water and fat, with signal at −210 Hz being split evenly between the two species, which is an intuitive result.
The selected ROI contains 9416 pixels with center frequencies in the range of [−1329, +1217] Hz, varying close to linearly with longitudinal position. Excellent agreement was seen between the frequency response magnitude curves predicted by modeling and the curves yielded by the scan data, with maximum deviations of 2.1% and mean squared error of less than 1%. Both water and fat exhibit linear phase, with a slope of 2π/(1464 Hz), slightly higher than the expected phase of 2π/(1680 Hz). The difference in phase slope corresponds to approximately 2π/60 cm (or about π/2 across the ROI), and is likely due to a spatially varying coil phase sensitivity, which was neither measured nor corrected.
The Iterative Decomposition of water and fat with Echo Asymmetry and Least-squares estimation (IDEAL) techniques are one member of the family of chemical shift based species decomposition methods. Unlike the original three-point Dixon method (2,3), which acquires three images with relative phase shifts of π between echoes, IDEAL supports images acquired at arbitrary echo times. Moreover, for three-point IDEAL acquisitions, the echo combination that optimizes the SNR performance has been determined based on the work of Pineda (20) and Reeder (16). It was shown that the best possible SNR behavior for separation of two species with single peaks is achieved using an echo spacing that is an integral multiple of 2π/3 (except those that are also integral multiples of 2π), with the middle echo acquired so that signals from the two species are in quadrature. The broader passband for the desired species of the IDEAL decomposition relative to Dixon methods is evident in Figure 3, where a comparison of the frequency response of two-point Dixon (0, π), three-point Dixon (−π, 0, +π), and three-point IDEAL (−π/6, π/2, 7π/6) is provided. Figure 4 compares the frequency response of 2π/3 and 4π/3 IDEAL acquisitions, which theoretically offer the same signal averaging efficiency (20). The analysis of both sampling intervals for the two IDEAL methods points out significant differences also, as the method with larger sampling intervals has a much smaller passband for the desired species in the decomposition and additional, undesired sidelobes.
Figure 3.
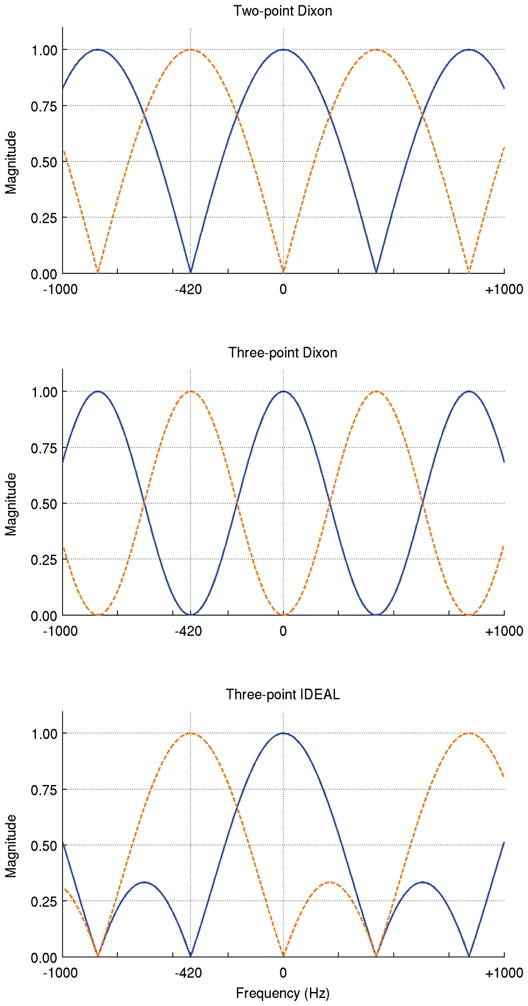
Water/fat decomposition can be performed with a variety of echo combinations. Commonly used echo configurations are two-point Dixon (dot-dashed lines), three-point Dixon (dashed lines), and three-point IDEAL (solid lines).
Figure 4.
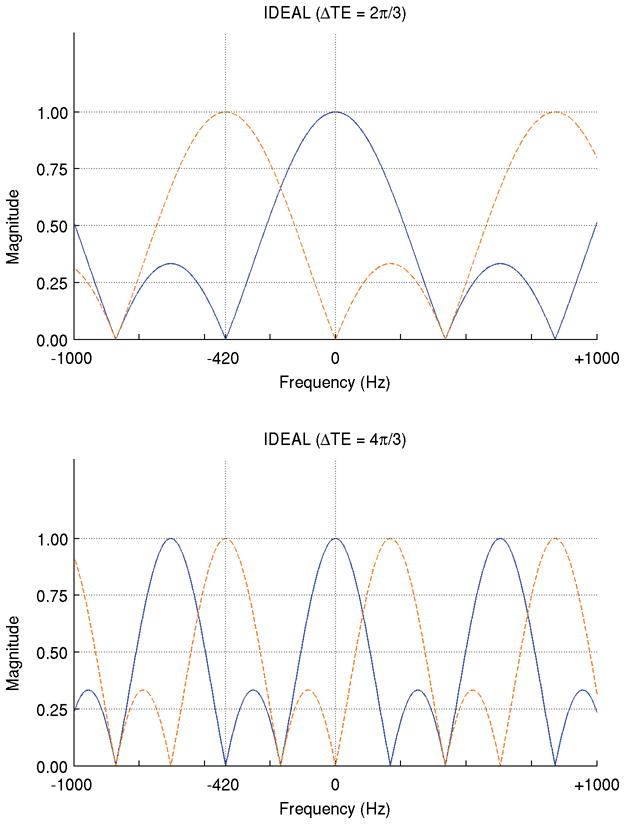
Analysis of IDEAL from a signal-averaging standpoint shows that echo spacings of 2π/3 (solid lines) and 4π/3 (dashed lines) both yield an NSA of three. Doubling the echo spacing narrows the pass-bands and halves the spacing between aliased copies of the spectrum. The narrowed pass-bands and nearby aliased sensitivity bands for off-resonant spins increase both the importance of and the difficult in obtaining an accurate field map estimate.
Decomposition Of Water And Fat With Multi-peak Modeling Of Fat Spectrum
Using the multi-peak model for the fat spectrum has a substantial impact on the decomposition. The frequency responses for the water and fat estimates are shown in Figure 5 for both the multi-peak model (left) and the single-peak model (right). For analysis near the nominal fat chemical shift frequency, an input signal supplied with the same multi-peak spectral composition assumed for fat is properly decomposed with the multi-peak model. The single-peak model, however, incorrectly decomposes an input of unit fat signal into an estimate of 0.83 fat and 0.14 water. At DC, the spectrally pure signal emitted by water is also properly decomposed into its species components by both the single and multi-peak models.
Figure 5.
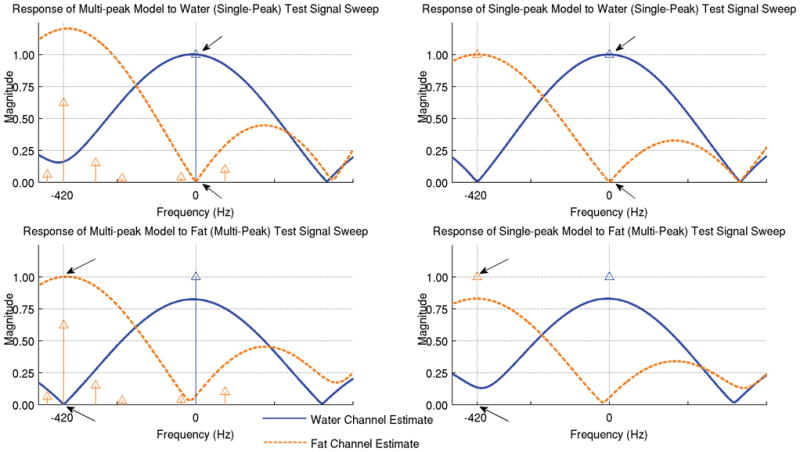
The same three echoes can be used for water/fat decomposition using a multipeak model that better represents the fat signal. The assumed spectrums for each species are represented by blue (water) and orange (fat) impulses. The water and fat estimates are shown for two input signals using the multi-peak decomposition model at left and using the single-peak model at right. The top plot shows the response to a sweep of a unit water signal (single peak). Note that, at DC, this signal is correctly decomposed into an estimate of 100% water and 0% fat (arrows) using both models. The bottom shows the response to a sweep of a unit fat signal (with its multipeak spectrum) – note that, at −420 Hz, this input is correctly decomposed into 100% fat and 0% water (arrows) with the multi-peak model (left), but incorrectly into a combination of water and fat with the single-peak model (right). Single-peak signal near the nominal fat chemical shift frequency and multi-peak signals near DC properly decomposed, but these situations will only occur in cases of enormous errors in field map estimation (those large enough to result in fat/water swaps).
For the experiment studying the effects errors in modeling the fat spectrum, Figure 6 shows a plot of estimated fat fraction vs. actual fat fraction for each variation in the spectrum. For fat fractions in the clinically relevant 0–75% range, the spectrum with the 0.00 olefenic peak leads to underestimation of fat fraction by 8%, the 0.05 spectrum underestimation by 4%, the 15% spectrum leads to 4% overestimation, and the 20% spectrum leads to 8% overestimation. It is clear that small errors in spectrum modeling lead to correspondingly small errors in fat fraction estimation.
Figure 6.
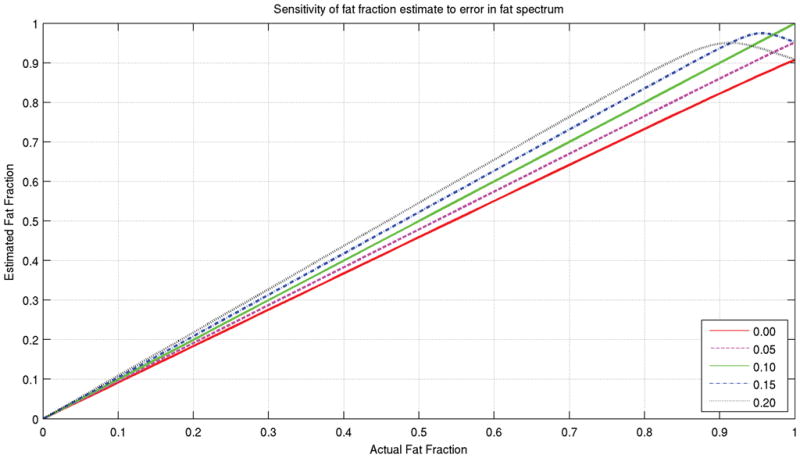
Curves showing the fat fraction estimation accuracy for various mismatches between the decomposition model and input fat spectrum. The input is a combination of water and fat, with the multipeak spectrum used previously. For decomposition, variations of that model are used, with the olefinic (+94 Hz) peak varied from zero to twice its nominal value. Each variation leads to a slight increase or decrease in the fat sensitivity, with the fat fraction curve remaining linear except at fat fractions close to 100%.
Decomposition Of Water, Fat, And Silicone
Decomposing water, fat, and a third species, silicone, adds two additional degrees of freedom (magnitude and phase of silicone) and an additional echo is utilized (4). A simulation of the decomposition model using single peaks for water (0 Hz), fat (−420 Hz), and silicone (−620 Hz) at 3.0 T is performed, based on an optimal echo spacing of 1.2 ms (4), was performed and the results are shown in Figure 7. Again, the response curves show unit sensitivity at the target frequency and zero sensitivity at the center frequency of each of the other species. The main lobes have FWHM’s ranging from 254–260 Hz, and the side lobes have peak amplitudes of approximately 0.296. Aliased copies of the sensitivity pattern are spaced 840 Hz apart.
Figure 7.
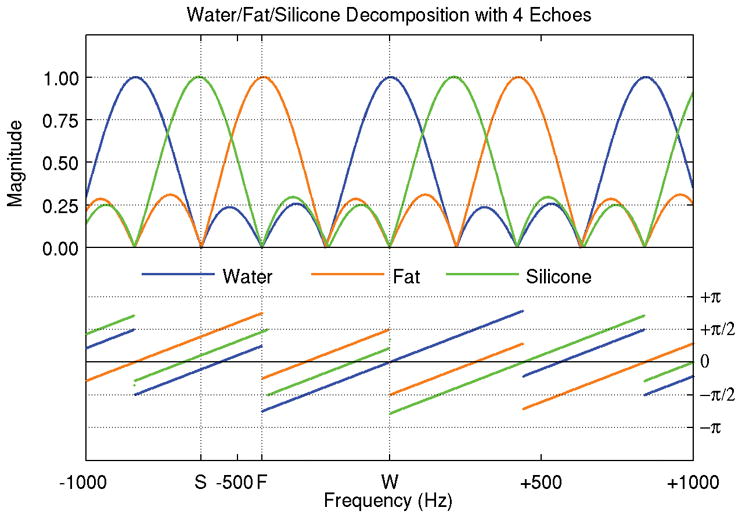
Frequency spectrum for simultaneous water-fat-silicone decomposition. With four unknowns (water, fat, silicone, and field inhomogeneity map), four or more images at different echo times are required. Because the spectral peaks are unevenly spaced, the frequency responses of the three species are not simply shifted replicas of one another.
Noise Sensitivity Of Water/Fat Decomposition
Water/fat decomposition was observed to degrade linearly in the presence of noise. For the three-echo acquisition with optimal echo spacing, the complex water and fat species estimates each showed noise with a variance one third that of the input noise variance, independent of input signal frequency and input noise intensity, to the limits of the measurement accuracy of the simulation. This is an expected result, since the entire decomposition process is a linear matrix operation. The improvement of the output noise variance (in the species estimates) over the input noise variance (in the source echo images) is predicted by the number of signal averages (NSA) factor, which is related to the echo spacing, as described by Pineda (20). When the additional step of field map estimation is introduced, the signal model is non-linear (Eq. 1) and the noise analysis is more complicated, as discussed in detail in Pineda (20) and Chebrolu (24).
DISCUSSION
Multipoint decomposition techniques represent a linear transform from a temporal space (time domain) into a spectral space (chemical shift frequency domain). This work describes a framework for calculating the frequency response of each species estimate for a given group of species and signal model. This framework was verified using a phantom experiment with a shim-induced field inhomogeneity. Using this framework, the frequency response of chemical shift based species separation methods can be analyzed in order to optimize new signal models and acquisition schemes (e.g. number of echoes and echo combinations/spacings) for various signal models for systems of chemical species.
Analyzing the frequency response of multipoint decomposition techniques highlights the parallels between these transforms and the DFT, mentioned earlier. In cases with equally spaced echoes and chemical shift frequencies, the decomposition is equivalent to the DFT, and the frequency response curves for each species estimate are all identical aside from the chemical shift frequency. For conventional three-point water and fat decomposition, the echoes are evenly spaced and the two species chemical shift frequencies are, by definition, evenly spaced. In this case, the water and fat species estimates are analogous to two of the three values in a three-point DFT of the input echo images. Figure 8 shows the frequency response of a three-echo W/F decomposition using IDEAL compared to the frequency response of a three-point DFT – the DC term of the DFT corresponds directly to the water component of the decomposition and the −1 term corresponds directly to fat. The remaining +1 term in the DFT represents signal with a chemical shift frequency of +420 Hz (directly opposite that of fat), which should not be present in any water/fat system (25). This prior information is not ignored in IDEAL – the iterative decomposition algorithm attempts to find the field map estimate that brings this component closest to zero. This interpretation of the iterative field map estimation and its relation to the DFT was recently described by Tsao et al. (25).
Figure 8.
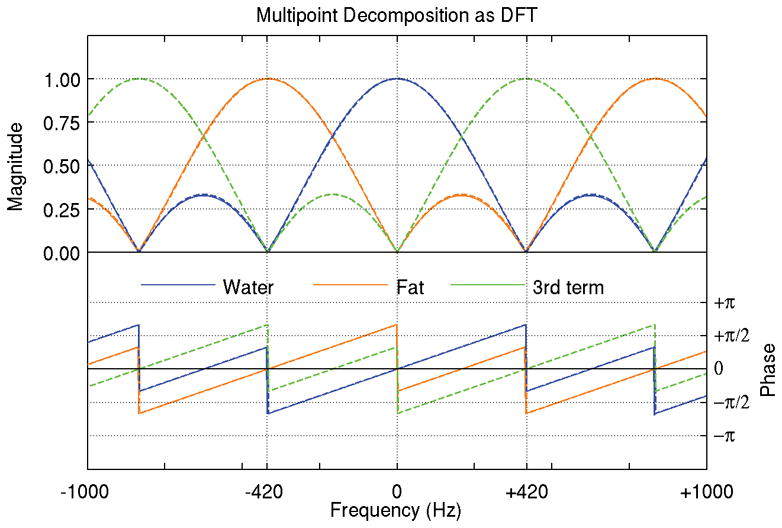
Multipoint decomposition is a transform from the temporal domain to the spectral domain, much like the Discrete Fourier Transform (DFT). For cases with equally spaced echoes and equally spaced chemical shifts, the decomposition is in fact a special case of the DFT. The frequency response of three-echo water/fat decomposition is shown here (solid lines) against the frequency response of a three-point DFT (dashed line). The first two terms of the DFT correspond exactly to the water (blue) and fat (orange) estimates, and the third term (green line) represents a modeled species with a chemical shift opposite that of fat.
In cases where the echo spacing is unequal, the species chemical shift frequency bins are unevenly spaced, or the species have resonant signal over a range of frequencies, the decomposition is a generalization of the DFT – a change of basis to an arbitrary spectral space with bins that do not correspond to equally spaced discrete frequencies.
In the case of water/fat/silicone decomposition shown in Figure 7, the three response curves appear very similar, but actually differ slightly in lobe width, height, and positioning. Note that if the species of interest had slightly different chemical shift frequencies of 0, −420, and −630, they would be part of an evenly spaced set, and the decomposition would again reduce to the DFT, and the three response curves would be shifted copies of each other.
Pineda et al. showed that an echo spacing of 4π/3 offers the same signal averaging efficiency (NSA=3) as the optimal 2π/3 spacing (20) – this longer spacing is appealing when implementing multi-echo readouts at higher field strengths, where the higher chemical shift makes it challenging to space echoes more closely while maintaining spatial resolution. However, in practice it has proven difficult to achieve reliable field map estimation using this longer echo spacing. This has already been discussed in Yu (19) and Lu (26), but can also be understood through the aliasing patterns seen in the frequency response curves. As shown in Figure 4, doubling the echo spacing halves the width of the main lobe, leading to a null point halfway between water and fat, but also halves the distance to the nearest aliased copies of the spectrum. This puts an additional fat peak on the far side of water and an additional water peak on the far side of fat. The narrowing of the main lobe of the frequency response and existence of unwanted (aliased) sensitivity peaks close to the target frequencies causes improper decomposition of slightly off-resonance spins, putting more rigorous demands on the field map estimation. The field map estimation process itself is also impaired, since it uses the same decomposition for each iteration (4,5,19). The phase slope is also doubled, which could lead to increased intravoxel destructive interference in cases where a spread of frequencies is present (due to either to localized field inhomogeneity or line width broadening).
While these analysis techniques are useful in understanding the frequency response for a given echo spacing in these simple cases, they are also applicable to more complicated situations where scan parameters must be chosen to optimize the response for a species with signal continuously distributed over a wide range of frequencies. This is crucial when using chemical shift based techniques for imaging 13C (16,17) or SPIOs (18).
It is important to remember that the frequency response is not the sole criteria for choosing the number and timing of echoes for chemical shift based separation methods. In practice, field map estimation is critical for effective spectral decomposition, and certain echo combinations may be more advantageous than others. Field map estimation and region-growing or recursive subdivision procedures are required to cope with field map ambiguities that put additional demands on echo selection that have been described previously (5,12,19,20,25–27) and are beyond the scope of this work.
In conclusion, viewing multipoint decomposition techniques as linear transforms between the echo time and chemical shift frequency domains allows these methods to be characterized with a frequency response for each of the individual species. As the decomposition is linear with respect to the input signal, it can be fully characterized by its frequency response. The response to any arbitrary input signal that is the sum of spins at various off-resonance frequencies can be found by summing the frequency response at those specific frequencies. This approach may provide an important tool for the design of new chemical shift based separation models that attempt to optimize the frequency response through accurate signal modeling and choice of imaging parameters such as the number of echoes and choice of echo timing.
Acknowledgments
This work was supported in part by the University of Wisconsin Institute for Clinical and Translational Research, funded through NIH Clinical and Translational Science Award 1UL1RR025011. This work was also supported by NCI 1 R01 CA11630-04, NIH R01 DK0883380-01, RC1 EB010384-01, and GE Healthcare.
References
- 1.Dixon WT. Simple proton spectroscopic imaging. Radiology. 1984;153:189–194. doi: 10.1148/radiology.153.1.6089263. [DOI] [PubMed] [Google Scholar]
- 2.Glover GH. Multipoint Dixon technique for water and fat proton and susceptibility imaging. J Magn Reson Imaging. 1991;1:521–30. doi: 10.1002/jmri.1880010504. [DOI] [PubMed] [Google Scholar]
- 3.Glover GH, Schneider E. Three-point Dixon technique for true water/fat decomposition with B0 inhomogeneity correction. Magn Reson Med. 1991;18:371–383. doi: 10.1002/mrm.1910180211. [DOI] [PubMed] [Google Scholar]
- 4.Reeder SB, Wen Z, Yu H, et al. Multicoil Dixon chemical species separation with an iterative least-squares estimation method. Magn Reson Med. 2004;51:34–45. doi: 10.1002/mrm.10675. [DOI] [PubMed] [Google Scholar]
- 5.Reeder SB, Pineda AR, Wen Z, et al. Iterative decomposition of water and fat with echo asymmetry and least-squares estimation (IDEAL): Application with fast spin-echo imaging. Magn Reson Med. 2005;54:636–644. doi: 10.1002/mrm.20624. [DOI] [PubMed] [Google Scholar]
- 6.Ma J, Singh SK, Kumar AJ, Leeds NE, Broemeling LD. Method for efficient fast spin echo Dixon imaging. Magn Reson Med. 2002;48:1021–1027. doi: 10.1002/mrm.10306. [DOI] [PubMed] [Google Scholar]
- 7.Ma J, Son JB. A Fast Spin Echo Triple Echo Dixon (FTED) Technique for Efficient T2-Weighted Water and Fat Imaging. Proceedings of the 14th Annual Meeting of ISMRM; Seattle, WA, USA. 2006. (abstract 3025) [DOI] [PubMed] [Google Scholar]
- 8.Xiang QS, An L. Water-fat imaging with direct phase encoding. J Magn Reson Imaging. 1997;7:1002–1015. doi: 10.1002/jmri.1880070612. [DOI] [PubMed] [Google Scholar]
- 9.Ma J. Breath-hold water and fat imaging using a dual-echo two-point Dixon technique with an efficient and robust phase-correction algorithm. Magn Reson Med. 2004;52:415–419. doi: 10.1002/mrm.20146. [DOI] [PubMed] [Google Scholar]
- 10.Moriguchi H, Lewin JS, Duerk JL. Dixon techniques in spiral trajectories with off-resonance correction: A new approach for fat signal suppression without spatial-spectral RF pulses. Magn Reson Med. 2003;50:915–924. doi: 10.1002/mrm.10629. [DOI] [PubMed] [Google Scholar]
- 11.Xiang QS. Two-point water-fat imaging with partially-opposed-phase (POP) acquisition: An asymmetric Dixon method. Magn Reson Med. 2006;56:572–584. doi: 10.1002/mrm.20984. [DOI] [PubMed] [Google Scholar]
- 12.Hernando D, Haldar JP, Sutton BP, Ma J, Kellman P, Liang ZP. Joint estimation of water/fat images and field inhomogeneity map. Magn Reson Med. 2008;59:571–580. doi: 10.1002/mrm.21522. [DOI] [PMC free article] [PubMed] [Google Scholar]
- 13.Schneider E, Chan TW. Selective MR imaging of silicone with the three-point Dixon technique. Radiology. 1993;187:89–93. doi: 10.1148/radiology.187.1.8451442. [DOI] [PubMed] [Google Scholar]
- 14.Yu H, Shimakawa A, McKenzie CA, Brodsky EK, Brittain JH, Reeder SB. Multiecho water-fat separation and simultaneous R2* estimation with multifrequency fat spectrum modeling. Magn Reson Med. 2008;60:1122–1134. doi: 10.1002/mrm.21737. [DOI] [PMC free article] [PubMed] [Google Scholar]
- 15.Brodsky EK, Holmes JH, Yu H, Reeder SB. Generalized k-space decomposition with chemical shift correction for non-cartesian water-fat imaging. Magn Reson Med. 2008;59:1151–1164. doi: 10.1002/mrm.21580. [DOI] [PubMed] [Google Scholar]
- 16.Reeder SB, Brittain JH, Grist TM, Yen YF. Least-squares chemical shift separation for 13C metabolic imaging. J Magn Reson Imaging. 2007;26:1145–1152. doi: 10.1002/jmri.21089. [DOI] [PubMed] [Google Scholar]
- 17.Levin YS, Mayer D, Yen YF, Hurd R, Spielman DM. Optimization of Fast Spiral Chemical Shift Imaging Using Least Squares Reconstruction: Application for Hyperpolarized 13C Metabolic Imaging. Magn Reson Med. 2007;58:245–252. doi: 10.1002/mrm.21327. [DOI] [PubMed] [Google Scholar]
- 18.Reeder SB, Faranesh AZ, Chen IY, et al. Off-Resonance Separation for Positive Contrast Imaging of Iron-Oxide Labeled Cells. Proceedings of the 14th Annual Meeting of ISMRM; Seattle, WA, USA. 2006. abstract 430. [Google Scholar]
- 19.Yu H, Reeder SB, Shimakawa A, Brittain JH, Pelc NJ. Field map estimation with a region growing scheme for iterative 3-point water-fat decomposition. Magn Reson Med. 2005;54:1032–1039. doi: 10.1002/mrm.20654. [DOI] [PubMed] [Google Scholar]
- 20.Pineda AR, Reeder SB, Wen Z, Pelc NJ. Cramér-Rao bounds for three-point decomposition of water and fat. Magn Reson Med. 2005;54:625–635. doi: 10.1002/mrm.20623. [DOI] [PubMed] [Google Scholar]
- 21.Brix G, Heiland S, Bellemann M, Koch T, Lorenz W. MR imaging of fat-containing tissues: valuation of two quantitative imaging techniques in comparison with localized proton spectroscopy. Magn Reson Imaging. 1993;11:977–991. doi: 10.1016/0730-725x(93)90217-2. [DOI] [PubMed] [Google Scholar]
- 22.Middleton MS, Hamilton G, Bydder M, Sirlin CB. How much fat is under the water peak in liver fat MR spectroscopy?. Proceedings of the 17th Annual Meeting of the ISMRM; Honolulu, HI, USA. 2009. abstract 4331. [Google Scholar]
- 23.Bydder M, Yokoo T, Hamilton G, et al. Relaxation effects in the quantification of fat using gradient echo imaging. Magn Reson Imaging. 2008;26:347–359. doi: 10.1016/j.mri.2007.08.012. [DOI] [PMC free article] [PubMed] [Google Scholar]
- 24.Chebrolu VV, Yu H, Pineda AR, McKenzie C, Brittain JH, Reeder SB. Noise Analysis for 3-pt Chemical Shift Based Water-Fat Separation with Accurate Spectral Modeling. Proceedings of the 17th Annual Meeting of the ISMRM; Honolulu, HI, USA. 2009. (abstract 2681) [Google Scholar]
- 25.Tsao J, Jiang Y. Hierarchacal IDEAL – Robust Water-Fat Separation at High Field by Multiresolution Field Map Estimates. Proceedings of the 16th Annual Meeting of ISMRM; Toronto, ON, Canada. 2008. (abstract 653) [Google Scholar]
- 26.Lu W, Hargreaves B. Multiresolution field map estimation using golden section search for water/fat separation. Magn Reson Med. 2008;60:236–244. doi: 10.1002/mrm.21544. [DOI] [PubMed] [Google Scholar]
- 27.Hernando D, Kellman P, Haldar JP, Liang ZP. Robust Water/Fat Separation in the Presence of Large Field Inhomogeneities Using a Graph Cut Algorithm. Magn Reson Med. 2010;63:79–90. doi: 10.1002/mrm.22177. [DOI] [PMC free article] [PubMed] [Google Scholar]


