

Abstract
Visualizing cells in three-dimensional (3D) scaffolds has been one of the major challenges in tissue engineering. Most current imaging modalities either suffer from poor penetration depth or require exogenous contrast agents. Here, we demonstrate photoacoustic microscopy (PAM) of the spatial distribution and temporal proliferation of cells inside three-dimensional porous scaffolds with thicknesses over 1 mm. Specifically, we evaluated the effects of seeding and culture methods on the spatial distribution of melanoma cells. Spatial distribution of the cells in the scaffold was well-resolved in PAM images. Moreover, the number of cells in the scaffold was quantitatively measured from the as-obtained volumetric information. The cell proliferation profile obtained from PAM correlated well with what was obtained using the traditional 3-(4,5-dimethylthiazol-2-yl)-2,5-diphenyltetrazolium bromide (MTT) assay.
1. Introduction
Tissue engineering is a rapidly developing, interdisciplinary field involving life sciences, materials science, and engineering. The aim of tissue engineering is to develop new tissue/organ substitutes for facilitating the restoration and maintenance of biological functions [1]. Three-dimensional (3D) scaffolds as physical supports play a vital role both in cell attachment and in forming an adjustable microenvironment for cell response. To perform this role, the scaffolds must have proper properties, including biocompatibility, biodegradability, mechanical strength, porosity, pore size, interconnectivity, and among others [1–5]. Recently, inverse opal scaffolds with uniform pore sizes and high interconnectivity were developed [6–8], and they have been applied to culture immune cells [9], bone marrow cells [10], and liver tissues [11].
Despite dramatic achievements in tissue engineering, visualizing live cells inside scaffolds is still challenging. Microscopic imaging systems capable of providing volumetric information of cells are quite rare. For example, scanning electron microscopy (SEM) can reach resolution as fine as a few nanometers, but the penetration depth is limited only to the surface. In addition, it requires one to dehydrate and fix the biological samples such as cells and extracellular matrix (ECM), which usually causes the sample to deform. Fluorescence optical microscopy, including confocal and two-photon laser scanning microscopy, has been widely used for visualizing cells [12]. However, due to strong light scattering, the penetration depth of such a modality is typically limited to several hundred micrometers [13]. Further, these techniques often require exogenous contrast agents such as fluorescent dyes. Micro-computed tomography (micro-CT) based on X-ray can visualize a whole construct with dimensions of several centimeters. However, the use of micro-CT for cell imaging usually requires toxic contrast agents such as osmium tetroxide [14, 15]. Label-free optical coherence tomography (OCT) with a relatively high resolution (~0.9 μm) has been demonstrated by Yang et al. for imaging tissue/scaffold constructs [16]. Although OCT could simultaneously resolve the structures of both the tissue and scaffold, it is rather difficult to distinguish between these two. Landis et al. combined OCT and confocal microscopy to collect complementary information from cell/scaffold constructs [17], but again the imaging depth was very limited due to strong light scattering. Potter et al. employed magnetic resonance imaging (MRI) to identify the deposition of ECM secreted by osteoblasts and chondrocytes in a scaffold in vivo [18]. Peptan et al. demonstrated the potential use of MRI to evaluate the differentiation of bone marrow stromal cells in gelatin sponges [19]. However, MRI suffers from low spatial resolution (70–100 μm) and long image acquisition time. Histological analyses of microtomed sections can provide excellent details of the sample. Nonetheless, this method is destructive, complicated, and laborious. Therefore, there is still a strong need for a non-invasive imaging modality with high resolution and penetration depth to provide volumetric information on cells in 3D scaffolds.
The emerging photoacoustic microscopy (PAM) is attractive for imaging cells in a non-invasive manner. PAM detects acoustic waves generated from the objects that absorb either pulsed or intensity-modulated laser irradiation [20, 21]. Because melanoma cells have natural dark pigments, they have a strong intrinsic contrast for label-free PAM with a high sensitivity both in vitro [22] and in vivo [23, 24]. Additionally, the non-ionizing radiation in photoacoustic (PA) imaging imposes no hazardous effects to tissues, in contrast with ionizing X-rays in micro-CT [21]. To the best of our knowledge, there has been no report on the application of PAM to scaffold-based tissue engineering. Here, we report PAM imaging of melanoma cells seeded in poly(D, L-lactide-co-glycolide) (PLGA) inverse opal scaffolds for tissue engineering application. We have successfully demonstrated the capability of PAM to non-invasively image a whole cell/scaffold construct more than 1 mm thick, resolving spatial distribution of cells in a 3D manner. We have used different seeding/culture methods to evaluate their effects on the spatial distribution of cells in the scaffolds. In addition, non-invasive and label-free PAM made it possible to monitor cell proliferation in the same scaffold over time, and to quantitatively analyze the number of cells as a function of time.
2. Materials and methods
2.1. Materials
Gelatin (Type A, from porcine skin, Sigma-Aldrich, St. Louis, MO), sorbitan monooleate (Span® 80, Sigma-Aldrich), and toluene (99.8 %, Sigma-Aldrich) were employed to produce uniform gelatin microspheres using a fluidic device. Poly(D, L-lactide-co-glycolide) (lactide 75: glycolide 25, Mw≈66,000–107,000, Sigma-Aldrich) was used for fabricating the scaffolds. The water used in all experiments was obtained by filtering through a set of Millipore cartridges (Epure, Dubuque, IA).
2.2. Preparation of inverse opal scaffolds
By modifying our recently published procedures [8, 25], we fabricated uniform microspheres of gelatin and inverse opal scaffolds of PLGA. Briefly, a methanol suspension of gelatin microspheres (200 μm in diameter, ~1.5 wt%) was placed in a 50-mL centrifuge tube and sonicated with the cap closed for 10 s. The wall of the centrifuge tube was then gently tapped to obtain a cubic-close packed (ccp) lattice. The ccp lattice was carefully placed in an oven heated at 65 °C for 1 h to form necks between the adjacent gelatin microspheres. After cooling down to room temperature for 30 min, the ccp lattice pellet was harvested by a spatula, placed on a filter paper to evaporate methanol, and then infiltrated with a PLGA solution in 1,4-dioxane (20 wt%). After removing the excess PLGA solution with filter paper, the ccp lattice pellet with PLGA solution was frozen in a refrigerator (−20 °C) for 5 h, and then lyophilized overnight in a freeze-dryer (Labconco Co., Kansas City, MO). The pellet with freeze-dried PLGA was immersed in ethanol for 5 min under a low vacuum to eliminate air bubbles trapped inside and subsequently transferred to 900 mL of water heated at 45 °C for 3 h to remove the gelatin lattice under magnetic stirring.
2.3 Melanoma cells culture and seeding
B16 melanoma cells were obtained from the Tissue Culture and Support Center at the Washington University School of Medicine. The cells were maintained in Dulbecco’s modified Eagle medium (DMEM, Invitrogen, Carlsbad, CA) supplemented with 10% heat-inactivated fetal bovine serum (FBS, ATCC, Manassas, VA) and 1% antibiotic antimycotic (ABAM, Invitrogen). Prior to cell seeding, scaffolds were sterilized with 70% ethanol and UV irradiation overnight, washed with PBS (Invitrogen) three times, and stored in a culture medium. For dynamic seeding/culture, cells were seeded into each scaffold using a spinner flask (125 mL capacity, Proculture™, Corning, Corning, NY) at 65 rpm for 2 h under 37 °C and 5% CO2. The cell-seeded scaffolds were then washed and cultured in a spinner flask with the same culture medium, except that DMEM free of phenol red was used to reduce possible signal interference in PAM imaging. For stationary seeding, scaffolds were immersed in cell suspensions for 2 h and transferred to 12-well plates with the aforementioned culture medium. Stationary cultures were maintained on a tilt-angle shaker at 50 rpm. All cultures were kept in an incubator at 37 °C under a humidified atmosphere containing 5% CO2, and the media were changed every other day.
2.4. Photoacoustic microscopy and signal processing
Scaffolds were removed from the culture medium, placed in a PDMS mold containing warm PBS (37 °C) with 1% P/S, and imaged with PAM. Figure 1 shows the experimental setup and a schematic of the PAM system. For photoacoustic excitation, a dye laser (CBR-D, Sirah, Kaarst, Germany) pumped by a Nd:YLF laser (INNOSLAB, Edgewave, Wuerselen, Germany) was employed to provide 7-ns laser pulses with a repetition rate up to 5 kHz. The light was coupled into a multimode optical fiber and reshaped by a conical lens to form a ring pattern on the tissue surface. The ring-shaped light pattern was then weakly focused into the sample by an optical condenser, and the optical focus overlapped with the tight detection ultrasonic focus [26]. With this hollow-core optical illumination, the surface signals were significantly reduced. A photodiode measured the energy of each laser pulse for signal calibration. A focused ultrasonic transducer with 50 MHz central frequency (V214-BB-RM, Olympus NDT, Kennewick, WA) achieved 45 μm lateral resolution, 15 μm axial resolution, and more than 3 mm penetration depth.
Fig. 1.
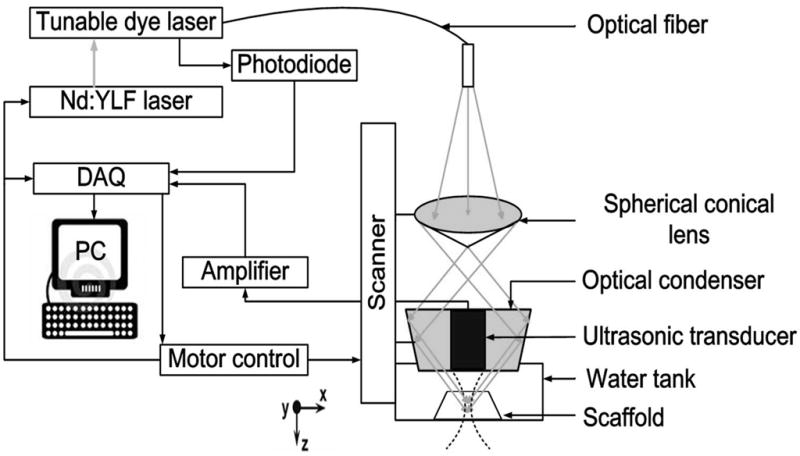
A schematic diagram of the photoacoustic microscopy system. A Cartesian coordinate is also shown in the drawing.
The transducer surface was immersed in PBS for ultrasound coupling. Through time-resolved ultrasonic detection at each scanned location, a 1D depth-resolved image (A-line) was obtained. A 1D raster scanning along the x direction provided a 2D B-scan image consisting of multiple A-scans. Thus, a 2D raster scanning along the transverse plane with a step size of 20 μm produced complete volumetric information, which could be viewed in either maximum amplitude projection (MAP) or direct 3D rendering. MAP was performed by projecting the maximum signal from each A-line onto the XY plane, and direct 3D rendering was processed by Volview software (Kitware, Inc., Clifton Park, NY). No signal averaging was performed for any image. Each A-scan was acquired within 2 μs, a single B-scan image was acquired within ~0.5 s, and a 3D image with a 6 mm by 6 mm area, which covered the whole scaffold sample, was acquired within ~5 min. All PA data were collected and processed by user-defined LabView (National Instruments, Austin, TX) and MATLAB (MathWorks, Inc., Natick, MA) programs.
2.5. Cell proliferation and viability assays
Cell proliferation and metabolization in the scaffolds were measured by MTT assays. MTT is a tetrazole that is metabolized and reduced to purple formazan in live cells. Assays were carried out in 12-well plates, and 40 μL of MTT (Invitrogen) solution in PBS (5 mg/mL) was added to each well and incubated at 37 °C for 4 h. Then culture media were withdrawn and 1 mL isopropanol was added to each well to completely dissolve formazan crystals throughout the scaffolds. Optical density was measured at 560 nm using a spectrophotometer (Infinite 200, TECAN, Männedorf, Switzerland). All final data were normalized to the dry weight of each scaffold.
Cell viability was investigated using LIVE/DEAD® staining kit (Invitrogen) according to the manufacturer’s instruction. Briefly, cells were incubated in PBS containing 2 μM calcein AM and 4 μM ethidium homodimer at 37 °C for 30 min, rinsed with PBS once, and then observed with a fluorescence microscope (Olympus).
2.6. Scanning electron microscopy
Scanning electron microscopy (Nova NanoSEM 2300, FEI, Hillsboro, OR) was used to characterize both the PLGA inverse opal scaffolds and the morphologies of melanoma cells grown in the scaffolds. Prior to imaging, cells were fixed and samples were dehydrated through a graded ethanol series and sputter-coated with gold for 60 s. Images were taken at an accelerating voltage of 5 kV.
2.7. Statistics
Results were presented as mean ±standard error for each experimental group.
3. Results and Discussion
3.1. PLGA inverse opal scaffolds and melanoma cells culture in the scaffolds
By modifying our previous method, we fabricated inverse opal scaffolds with cubic close-packed lattices of gelatin microspheres as templates [8, 25]. Figure 2, A and B, show SEM images of a typical lattice of gelatin microspheres and the corresponding inverse opal scaffold of PLGA, respectively. From the SEM images in the insets, it is clear that the inverse opal scaffold had a uniform and well-arranged pore structure. This feature is important for a 3D scaffold, in that it can provide good interconnections throughout the whole scaffold to facilitate cell migration and nutrient/waste transport. Figure 3 shows the morphology of melanoma cells inside scaffolds. Under an optical microscope (Fig. 3A), the cells were optically opaque and this gives strong PA signals. From SEM images, the cells, as marked by the arrows, had a typical size of 20–100 μm when they fully stretch (Fig. 3B) or form cell clusters (Fig. 3C).
Fig. 2.
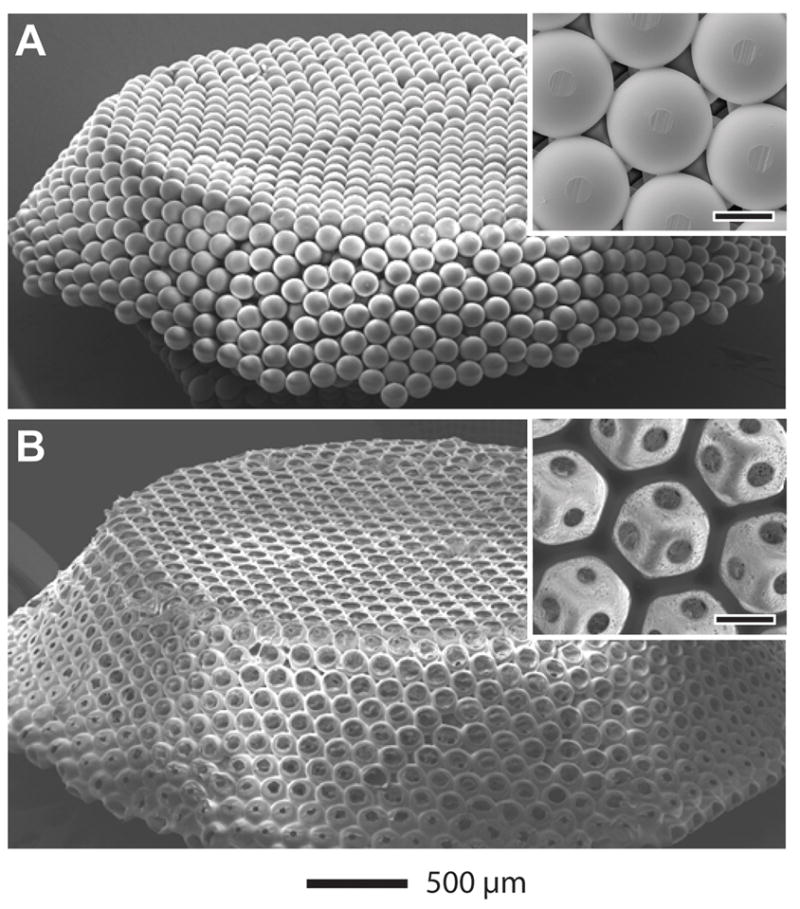
SEM images of A) a free-standing, opaline lattice of gelatin microsphere and B) a PLGA inverse opal scaffold. The insets show magnified views of the samples (scale bars: 100 μm).
Fig. 3.

A) Optical and B, C) SEM images of a PLGA inverse opal scaffold seeded with melanoma cells acquired at 14 days post-seeding. The images in (B) and (C) show scattered cells and a cluster of cells (indicated by arrows), respectively, inside the pores.
3.2. Photoacoustic imaging of melanoma cells in the scaffolds
The PA coronal and sagittal MAP images in Figure 4A clearly show how cells grew in a scaffold, with the capability of penetrating the whole cell/scaffold construct with a thickness of around 1.2 mm. Figure 4B shows a 3D depiction of the melanoma cells in the scaffold (Supplementary Movie S1). Individual cells or cell clusters could be identified (black dots or patches) in both the 2D and 3D images. This penetration depth is rather deep as compared to the conventional microscopy techniques. According to our experience, with the same melanoma cell-seeded scaffold, confocal microscopy and two-photon microscopy could only reach a depth of ~0.2 mm and ~0.3 mm, respectively. Interestingly, PAM system could still provide acceptable resolution at such a deep penetration depth. The PAM maintains relatively high spatial resolution over 1 mm in depth because the resolution is determined by the ultrasound parameters and ultrasound scattering is much weaker than optical scattering in biological tissues [27]. These images clearly show the advantage of PAM in penetration for characterizing cells in 3D scaffolds. In comparison, we also imaged a cell-free inverse opal scaffold with PAM. As expected, no dark dots or patches were observed because the optical absorption of the scaffold is low. Hence, we confirmed that the PA signals came from the melanoma cells rather than from the scaffold.
Fig. 4.

PA images of melanoma cells in a scaffold acquired at 14 days post-seeding. A) PA coronal (top) and sagittal (side) MAP images. The black dots correspond to melanoma cells. B) 3D depiction of the PA image, where the contour of the scaffold is marked by dotted lines. MAP: maximum amplitude projection.
3.3. Imaging of spatial distribution of melanoma cells inside the scaffold
The spatial distribution of cells in a porous scaffold is one of the most important issues in tissue engineering because it can affect cell-cell communication and ECM secretion [28]. A uniform distribution of cells is preferred, which can presumably induce a uniform deposition of ECM and result in minimum defective sites in the tissue [29–31]. However, currently, no suitable imaging techniques can readily penetrate a thick cell/scaffold construct to reveal the spatial distribution profile of the cells. In the present work, we compared the spatial distributions of cells in inverse opal scaffolds that were seeded and cultured using two different methods in order to demonstrate the ability of PAM to spatially resolve cells. A spinner flask was employed for dynamic cell seeding/culture. PAM scans were performed at day 1 and day 14. Figure 5, A–D, show PA coronal MAP images of each cell/scaffold construct within the depth range from 420 μm to 780 μm. For dynamic seeding and culture, the cells were uniformly distributed throughout the entire volume of the scaffold at day 1 (Fig. 5A), whereas the cells seeded using the stationary method were mainly distributed at the perimeter of the scaffold (Fig. 5B). The uniform distribution of cells could be attributed to an adequate convection of the medium due to the stirring in the dynamic method, facilitating the penetration of cells to the interior of the scaffold. However, there was no significant difference between these two samples after 14 days of culture (Fig. 5, C and D), indicating that the cells could also migrate to the center of the scaffold during culture due to the high interconnectivity of the scaffold.
Fig. 5.

PA images (MAP of the layer between 420 and 780 μm from the top of the scaffolds) of a scaffold seeded and cultured continuously in the spinner flask for (A) 1 day and (C) 14 days; and of a scaffold seeded with stationary method and cultured on a tilt-angle shaker for (B) 1 day and (D) 14 days.
To more accurately assess the cell distribution at a certain depth in the examined volume (420–780 μm planes), we mapped a series of sections with a layer thickness of 60 μm at day 14 (Fig. 6). Uniform cell distribution was observed across all layers, even in the central plane of the scaffold. Our results clearly showed that, PAM can resolve spatial distribution of cells inside a thick scaffold, and readily distinguish different cell distribution patterns. In principle, as a critical future of the imaging modality, sections at any depth of the volume can be constructed. Using PAM, a tissue-engineered scaffold can be conveniently examined noninvasively to determine if defect regions are present inside the construct (as well as the exact number and locations of defect sites) before the construct is implanted into a human body.
Fig. 6.

PA MAP images of melanoma cells in a scaffold 14 days post-seeding taken from different layers parallel to the top surface. The first layer started at 420 μm beneath the surface, and the layer spacing was 60 μm. Melanoma cells were seeded and culture with a spinner flask. The cells distributed uniformly in the center of the scaffold.
3.4. Chronic imaging and quantification of melanoma cells growth
So far, it has been rarely reported to temporally monitor and quantify cell proliferation in a 3D scaffold with relatively high spatial resolution. Fluorescence microscopy may be useful for long-term monitoring if the cells are labeled with live-cell dyes (e.g., cytoplasmic and membrane dyes [32]), or with intrinsic fluorescent proteins such as green fluorescent proteins (GFPs) [33]. However, the instability of the fluorescent dyes and proteins due to photobleaching can be a problem, and cell mitosis can dissipate the dyes as well. Thus, longitudinal quantification of cell numbers inside a 3D scaffold using fluorescence microscopy is a challenge. In contrast, PAM is a well-suited tool for chronically monitoring and quantifying cell proliferation in a 3D scaffold because it does not require any exogenous contrast agent. Melanoma cells were seeded into four inverse opal scaffolds with a thickness of 1.5 mm using a spinner flask and cultured in 12-well plates. At days 1, 3, 7, and 14 post-seeding, the scaffolds with cells were carefully taken out from the media, immobilized on a polydimethylsiloxane (PDMS) block, and immersed in warm PBS at 37 °C with 1% antibiotics for PAM imaging. Pure PDMS block was found not to generate PA signals, indicating no contribution from the PDMS block to the PA signals. Time-course PA coronal MAP images of the entire scaffold clearly show the growth of melanoma cells inside the scaffolds (Fig. 7A). We further utilized the collected PA volumetric data to quantify the cell numbers, which would be a critical feature of PAM. To elucidate the relationship between the PA signal amplitude and the number of melanoma cells in the scaffold, inverse opal scaffolds with different numbers of cells were scanned with PAM under identical conditions. The cells in the scaffolds were then completely released from the scaffolds with Accumax™ and manually counted with a hemocytometer. The signal amplitude from the PA volumetric data was found to be linearly correlated with the number of cells in the scaffold (Fig. S1).
Fig. 7.

A) Time course PA images (coronal MAP of the entire volume) of melanoma cells in a typical scaffold at 1, 3, 7 and 14 days post-seeding. B) Quantitative analysis of melanoma cells in scaffolds derived from both PA imaging (n = 4) and MTT cell viability analysis (n = 3). The data are presented as means ± standard errors. Melanoma cells were seeded with a spinner flask and cultured in still.
The cell numbers calculated from the PA volumetric data were plotted against different time points (Fig. 7B). It was observed that the number of cells increased with time during the first 7 days, and then started to decrease for the next 2 weeks. From the calibration curve, the average cell numbers at days 1, 3, 7, and 14 were calculated to be 4.9 × 10⁴, 2.8 × 10⁵, 3.4 × 10⁵, and 2.7 × 10⁵ per scaffold, respectively. A parallel cell MTT viability experiment was conducted. MTT assay is a typical method for accurately evaluating cell proliferation. Interestingly, the overall profile obtained from MTT assay had a trend similar to that from PAM, with a slight difference at the initial stage (day 1 to day 3 post cell-seeding). During the first 3 days, the cell proliferation rate estimated by the PAM data was approximately 1.8 times faster than the rate from the MTT assay. This difference could be attributed to the variation of cell seeding efficiency for each experimental group. The average cell number at day 1 post-seeding in the MTT group was 7.1 × 10⁴ as calculated from the MTT calibration curve (Fig. S1, B), which was approximately 1.5 times greater than that for the PAM group (4.9 × 10⁴). The higher density of cells presumably led to a slower proliferation rate due to the limited nutrients and space in the scaffolds. The average numbers of cells in the scaffolds for the MTT group at days 3, 7, and 14 were calculated to be 2.2 × 10⁵, 3.3 × 10⁵, and 2.6 × 10⁵, respectively, which were similar to those in the PAM group.
The decrease in cell population from PAM data after 7 days post-seeding does not seem to be reasonable because dead cells in the scaffolds could still be detected by PAM due to their inherent dark pigments. Thus, we hypothesized that during the culture period, due to the high interconnectivity of an inverse opal scaffold and the continuous orbital shaking, dead cells that lost adhesion would come from the scaffold into the culture medium, and most of the cells remaining in the scaffold should be alive. In fact, this hypothesis was verified by LIVE/DEAD staining and MTT assay. We collected non-adherent cells in the culture wells after 14 days of culture and stained them with LIVE/DEAD assay. It was found that most of the cells were dead. We also took 3 scaffolds out of the samples right after PAM scans at 14 days of culture and did an MTT assay, and calculated the average number of cells from the MTT calibration curve. The number of cells obtained from the MTT assay was around 1.9 × 10⁵, which corresponds to over 70% live cells in comparison to the number obtained from PAM data (2.7 × 10⁵) since MTT detects only metabolically active (live) cells. This high viability of cells also validated the non-invasive nature of PAM imaging modality. Our imaging technique clearly exhibits advantages over other current techniques. PAM scan rate is fast compared to any other imaging modalities. For such a scaffold with the same dimensions, it takes ~20 min for a confocal microscope to scan through in order to get a volumetric data of ~200 μm in depth. Due to the complexity in the scanning mechanisms and reconstruction algorithms, micro-CT and MRI require even longer times. By contrast, PAM only takes less than 10 min. This fast scanning rate for PAM gives it a unique ability to characterize live cells in thick, 3D scaffolds, and therefore, chronic monitoring of the same scaffold is possible.
Our results showed that, after continuous monitor for 2 weeks, the melanoma cells still had a high viability of over 70%. More importantly, by analyzing 3D volumetric data obtained from these continuous scans, we could quantify the number of cells inside the scaffold. The proliferation profile was found to be parallel to that obtained from the MTT biochemical assay, indicating the effective quantification by PAM. In comparison, it is difficult to use other imaging techniques to achieve such quantification of cell numbers in thick scaffolds, in that they suffer from long image acquisition times, poor imaging depths (e.g., for confocal optical microscope), invasiveness (e.g., for micro-CT), and limited resolution (e.g., for MRI).
For the details involved in the calculation of cell numbers from both PAM and MTT data in this section, please refer to the supplementary note.
4. Conclusion
We have demonstrated that PAM could be a powerful tool for investigating cell distributions in 3D scaffolds in a non-invasive manner. Melanoma cells were used as a model cell line due to their intrinsic dark pigment. The whole scaffold (1.2–1.5 mm in thickness) containing melanoma cells could be imaged and resolved in a 3D fashion. It is worth noting that we were able to chronically image the same cell/scaffold construct at different time points by PAM. It was confirmed that the continuous quantitative data obtained from PAM matched well with those measured using the biochemical MTT cell viability analysis. We believe that PAM will become a useful technique as an imaging modality for tissue engineering applications, especially when thick cell/scaffold constructs are involved, and this modality can also be extended to image other cell types labeled with contrast agents such as organic dyes.
Supplementary Material
Acknowledgments
This work was supported in part by an NIH Director’s Pioneer Award (DP1 OD000798) and startup funds from Washington University in St. Louis (to X.Y.). This work was also sponsored by NIH grants (R01 EB000712, R01 NS46214, R01 EB008085, and U54 CA136398, to L.V.W.). Part of the work was performed at the Nano Research Facility (NRF), a member of the National Nanotechnology Infrastructure Network (NNIN), which is supported by the NSF under award ECS-0335765. L.V.W. has a financial interest in Microphotoacoustics, Inc. and Endra, Inc., which, however, did not support this work.
Footnotes
Publisher's Disclaimer: This is a PDF file of an unedited manuscript that has been accepted for publication. As a service to our customers we are providing this early version of the manuscript. The manuscript will undergo copyediting, typesetting, and review of the resulting proof before it is published in its final citable form. Please note that during the production process errors may be discovered which could affect the content, and all legal disclaimers that apply to the journal pertain.
References
- 1.Langer R, Vacanti JP. Tissue engineering. Science. 1993;260:920–26. doi: 10.1126/science.8493529. [DOI] [PubMed] [Google Scholar]
- 2.Langer R, Vacanti JP, Vacanti CA, Atala A, Freed LE, Vunjak-Novakovic G. Tissue Engineering: Biomedical Applications. Tissue Eng. 1995;1:151–61. doi: 10.1089/ten.1995.1.151. [DOI] [PubMed] [Google Scholar]
- 3.Vacanti JP, Langer R. Tissue engineering: the design and fabrication of living replacement devices for surgical reconstruction and transplantation. Lancet. 1999;354:S32–4. doi: 10.1016/s0140-6736(99)90247-7. [DOI] [PubMed] [Google Scholar]
- 4.Ma PX. Scaffolds for tissue fabrication. Mater Today. 2004;7:30–40. [Google Scholar]
- 5.Hollister SJ. Porous scaffold design for tissue engineering. Nat Mater. 2005;4:518–24. doi: 10.1038/nmat1421. [DOI] [PubMed] [Google Scholar]
- 6.Kotov NA, Liu Y, Wang S, Cumming C, Eghtedari M, Vargas G, et al. Inverted colloidal crystals as three-dimensional cell scaffolds. Langmuir. 2004;20:7887–92. doi: 10.1021/la049958o. [DOI] [PubMed] [Google Scholar]
- 7.Liu Y, Wang S, Lee JW, Kotov NA. A floating self-assembly route to colloidal crystal templates for 3D cell scaffolds. Chem Mater. 2005;17:4918–24. [Google Scholar]
- 8.Choi S-W, Xie J, Xia Y. Chitosan-based inverse opals: three-dimensional scaffolds with uniform pore structures for cell culture. Adv Mater. 2009;21:2997–3001. doi: 10.1002/adma.200803504. [DOI] [PMC free article] [PubMed] [Google Scholar]
- 9.Stachowiak AN, Irvine DJ. Inverse opal hydrogel-collagen composite scaffolds as a supportive microenvironment for immune cell migration. J Biomed Mater Res A. 2008;85:815–28. doi: 10.1002/jbm.a.31661. [DOI] [PubMed] [Google Scholar]
- 10.Nichols JE, Cortiella J, Lee J, Niles JA, Cuddihy M, Wang S, et al. In vitro analog of human bone marrow from 3D scaffolds with biomimetic inverted colloidal crystal geometry. Biomaterials. 2009;30:1071–9. doi: 10.1016/j.biomaterials.2008.10.041. [DOI] [PMC free article] [PubMed] [Google Scholar]
- 11.Lee J, Cuddihy MJ, Cater GM, Kotov NA. Engineering liver tissue spheroids with inverted colloidal crystal scaffolds. Biomaterials. 2009;30:4687–94. doi: 10.1016/j.biomaterials.2009.05.024. [DOI] [PubMed] [Google Scholar]
- 12.Shotton DM. Confocal scanning optical microscopy and its applications for biological specimens. J Cell Sci. 1989;94:175–206. [Google Scholar]
- 13.Dumas D, Riquelme B, Werkmeister E, Isla ND, Stoltz JF. Multimodality of microscopy imaging applied to cartilage tissue engineering. In: Buckwalter JA, Lotz M, Stoltz JF, editors. Osteoarthritis, Inflammation and Degradation: A Continuum. Amsterdam: IOS Press; 2007. pp. 254–66. [Google Scholar]
- 14.Dorsey SM, Lin-Gibson S, Simon CG., Jr X-ray microcomputed tomography for the measurement of cell adhesionand proliferation in polymer scaffolds. Biomaterials. 2009;30:2967–74. doi: 10.1016/j.biomaterials.2009.02.032. [DOI] [PubMed] [Google Scholar]
- 15.van Lenthe GH, Hagenmüller H, Bohner M, Hollister SJ, Meinel L, Müller R. Nondestructive micro-computed tomography for biological imaging and quantification of scaffold-bone interaction in vivo. Biomaterials. 2007;28:2479–90. doi: 10.1016/j.biomaterials.2007.01.017. [DOI] [PubMed] [Google Scholar]
- 16.Yang Y, Dubois A, Qin X-p, Li J, Haj AE, Wang RK. Investigation of optical coherence tomography as an imaging modality in tissue engineering. Phys Med Biol. 2006;5:1649–59. doi: 10.1088/0031-9155/51/7/001. [DOI] [PubMed] [Google Scholar]
- 17.Landis FA, Cicerone MT, Cooper JA, Washburn NR, Dunkers JP. Developing metrology for tissue engineering: collinear optical coherence and confocal fluorescence microscopies. Proceedings of the 2004 IEEE International Symposium on Biomedical Imaging: From Nano to Macro; 2004 April 15–18; Arlington, VA, USA. pp. 1533–6. [Google Scholar]
- 18.Potter K, Sweet DE, Anderson P, Davis GR, Isogai N, Asamura S, et al. Non-destructive studies of tissue-engineered phalanges by magnetic resonance microscopy and X-ray microtomography. Bone. 2006;38:350–8. doi: 10.1016/j.bone.2005.08.025. [DOI] [PubMed] [Google Scholar]
- 19.Peptan IA, Hong L, Xu H, Magin RL. MR. Assessment of osteogenic differentiation in tissue-engineered constructs. Tissue Eng. 2006;12:843–51. doi: 10.1089/ten.2006.12.843. [DOI] [PubMed] [Google Scholar]
- 20.Kim C, Favazza C, Wang LV. In vivo photoacoustic tomography of chemicals: high-resolution functional and molecular optical imaging at new depths. Chem Rev. 2010;110:2756–82. doi: 10.1021/cr900266s. [DOI] [PMC free article] [PubMed] [Google Scholar]
- 21.Xu M, Wang LV. Photoacoustic imaging in biomedicine. Rev Sci Instrum. 2006;77:41101–22. [Google Scholar]
- 22.Weight RM, Viator JA, Dale PS, Caldwell CW, Lisle AE. Photoacoustic detection of metastatic melanoma cells in the human circulatory system. Opt Lett. 2006;31:2998–3000. doi: 10.1364/ol.31.002998. [DOI] [PubMed] [Google Scholar]
- 23.Oh J-T, Li M-L, Zhang HF, Maslov K, Stoica G, Wang LV. Three-dimensional imaging of skin melanoma in vivo by dual-wavelength photoacoustic microscopy. J Biomed Opt. 2006;11:34032–4. doi: 10.1117/1.2210907. [DOI] [PubMed] [Google Scholar]
- 24.Zhang HF, Maslov K, Stoica G, Wang LV. Functional photoacoustic microscopy for high-resolution and noninvasive in vivo imaging. Nat Biotechnol. 2006;24:848–51. doi: 10.1038/nbt1220. [DOI] [PubMed] [Google Scholar]
- 25.Choi S-W, Cheong IW, Kim J-H, Xia Y. Preparation of uniform microspheres using a simple fluidic device and their crystallization into close-packed lattices. Small. 2009;5:454–59. doi: 10.1002/smll.200801498. [DOI] [PubMed] [Google Scholar]
- 26.Maslov K, Stoica G, Wang LV. In vivo dark-field reflection-mode photoacoustic microscopy. Opt Lett. 2005;30:625–7. doi: 10.1364/ol.30.000625. [DOI] [PubMed] [Google Scholar]
- 27.Duck FA, editor. A comprehensive reference book. San Diego: Academic Press; 1990. Physical properties of tissue. [Google Scholar]
- 28.Levenberg S, Huang NF, Lavik E, Rogers AB, Itskovitz-Eldor J, Langer R. Differentiation of human embryonic stem cells on three-dimensional polymer scaffolds. Proc Natl Acad Sci U S A. 2003;100:12741–6. doi: 10.1073/pnas.1735463100. [DOI] [PMC free article] [PubMed] [Google Scholar]
- 29.Vunjak-Novakovic G, Obradovic B, Martin I, Bursac PM, Langer R, Freed LE. Dynamic cell seeding of polymer scaffolds for cartilage tissue engineering. Biotechnol Prog. 1998;14:193–202. doi: 10.1021/bp970120j. [DOI] [PubMed] [Google Scholar]
- 30.Wendt D, Marsano A, Jakob M, Heberer M, Martin I. Oscillating perfusion of cell suspensions through three-dimensional scaffolds enhances cell seeding efficiency and uniformity. Biotechnol Bioeng. 2003;84:205–14. doi: 10.1002/bit.10759. [DOI] [PubMed] [Google Scholar]
- 31.Wendt D, Stroebel S, Jakob M, John GT, Martin I. Uniform tissues engineered by seeding and culturing cells in 3D scaffolds under perfusion at defined oxygen tensions. Biorheology. 2006;43:481–8. [PubMed] [Google Scholar]
- 32.Parish CR. Fluorescent dyes for lymphocyte migration and proliferation studies. Immunol Cell Biol. 1999;77:499–508. doi: 10.1046/j.1440-1711.1999.00877.x. [DOI] [PubMed] [Google Scholar]
- 33.Yuste R. Fluorescence microscopy today. Nat Methods. 2005;2:902–4. doi: 10.1038/nmeth1205-902. [DOI] [PubMed] [Google Scholar]
Associated Data
This section collects any data citations, data availability statements, or supplementary materials included in this article.