

Abstract
We have developed a novel analyte injection method for the SensíQ Pioneer surface plasmon resonance-based biosensor referred to as ‘FastStep™’. By merging buffer and sample streams immediately prior to the reaction flow cells, the instrument is capable of automatically generating a two- or three-fold dilution series (of seven or five concentrations, respectively) from a single analyte sample. Using sucrose injections, we demonstrate that the production of each concentration within the step gradient is highly reproducible. For kinetic studies, we developed analysis software that utilizes the sucrose responses to automatically define the concentration of analyte at any point during the association phase. To validate this new approach, we compared the results of standard and FastStep injections for ADP binding to a target kinase and a panel of compounds binding to carbonic anhydrase II. Finally, we illustrate how FastStep can be used in a primary screening mode to obtain a full concentration series of each compound in a fragment library.
Keywords: label-free, small molecules, kinetics
Introduction
Fragment compound screening using surface plasmon resonance (SPR)-based biosensors is becoming a common method of kick-starting drug discovery programs. Compared to structure-based methods, label-free biosensor technology is more rapid and provides more information about specificity while requiring less target protein and lower amounts of compounds [1]. However, the growing interest in biosensor-based fragment screening has increased the demand for higher throughput. In order to improve the throughput of biosensors in general, we previously developed and validated novel injection methods like ‘one-shot kinetics’ [2] and ‘kinetic titrations’ [3]. In this report, we introduce a variation of the kinetic titration method we call ‘FastStep™’ injections.
The FastStep method involves injecting an analyte series from low to high concentration without buffer segments in between. This increases the speed of the assay compared to kinetic titrations, hence the term FastStep. In addition, the concentration gradient is automatically created within the instrument, thereby providing additional benefits as we will describe below.
The FastStep method has been incorporated into a new SPR-based biosensor from ICX Technologies called SensíQ Pioneer. Many of the hardware features of SensíQ are similar to those in the commonly used Biacore instruments. Both Biacore and SensíQ are flow cell-based systems (SensíQ has three flow cells which can be addressed independently or in a series and in either direction) with an injection-based autosampler. And similar to many Biacore instruments, the fluidic system in SensíQ is based on two syringes, one for running buffer and one for sample delivery (Fig. 1A).
Figure 1.

A. Cartoon of SensíQ Pioneer flow system. Two stepper motor pumps control syringes that can simultaneously deliver samples to a mixing compartment immediately prior to the set of three flow cells. Panels B and C are examples of analyte concentration profiles for standard and FastStep injections, respectively.
Both Biacore and SensíQ are capable of performing what we refer to as “standard” injections. As shown in Figure 1B, a standard injection creates an analyte concentration profile that is essentially square shaped or nearly so depending on the flow cell configuration and flow rate. The flow from the buffer syringe is turned off when the analyte is being injected. At the end of the association phase the analyte flow is stopped and system switches back to flowing buffer, which returns the analyte concentration in the flow cell to zero.
However, unlike Biacore instruments, SensíQ Pioneer is capable of mixing the buffer and sample streams immediately prior to the entrance of the flow cells. This feature makes it possible to vary the analyte concentration during an association phase. Using this approach the instrument is capable of automatically generating any shape of concentration profile; for example, going from low to high or high to low concentrations and in linear or nonlinear gradients. For step-gradient analyses, SensíQ Pioneer has been preprogrammed to run either a two- or three-fold dilution series (with seven or five steps in concentration, respectively) by adjusting the flow rates from the buffer and analyte syringes at the appropriate time as shown in Figure 1C.
We have also developed analysis software that provides the option of using the injection profile of sucrose to accurately define the concentration gradient throughout the injection series. To illustrate and validate the FastStep approach we use carbonic anhydrase II and a set of sulfonamide-based inhibitors which we have characterized previously using other technologies [4-8]. We then apply the FastStep method to screen fragments against a kinase target. The results illustrate how, by increasing sample throughput and decreasing sample preparation time, this approach addresses two bottlenecks in primary and secondary SPR-based fragment screening.
Materials and Methods
SensíQ Pioneer, COOH5 sensor chips, Qdat software, and coupling reagents were from ICX Technologies (www.discoversensiq.com). Carbonic anhydrase II (CAII), all sulfonamides, adenosine diphosphate (ADP), sucrose, HEPES, NaCl, MgCl2, and general laboratory reagents were purchased from Sigma Aldrich (www.sigmaaldrich.com), sulfo-NHS-LCLC-Biotin and streptavidin from Pierce (www.piercenet.com), and the Superdex-75 gel filtration column from GE Health Sciences (www.gehealthcare.com). The target kinase and a 320-compound fragment library were provided by Genzyme Corporation (Waltham, MA).
Sucrose FastStep
A COOH5 sensor chip was installed in the SensíQ Pioneer system, normalized with air, and primed with running buffer (10 mM HEPES, 150 mM NaCl, pH 7.4; HBS). A FastStep concentration series of sucrose (stock solution prepared at 20% w/v in running buffer) was injected seven times each using both a five- and seven-step dilution series programmed in the SensíQ Pioneer instrument. The flow rate was 250 μL/min and 200 μL/min, respectively. The higher than usual flow rates are required to establish a flow rate that is 100-fold above the lowest flow rate that the sample syringe pump can reliably produce. This constraint cannot be relaxed if both a fixed injection flow rate and a 100-fold analyte dilution range are required. For data analysis, the responses were zeroed by subtracting the average of ten seconds of data prior to the start of each injection.
Minimal biotinylation
CAII and the target kinase were each minimally biotinylated on ice for three hours using a equimolar concentration of sulfo-NHS-LCLC-biotin [10]. Both targets were passed through a Superdex-75 gel filtration column to remove any free biotin.
Streptavidin immobilization and target capturing
Streptavidin was immobilized at 25°C onto a COOH5 sensor chip using standard amine-coupling methods and HBS as the running buffer. The surface was activated with 0.5 mM EDC (1-ethyl 3-(3-dimethylaminpropyl)-carbodiimide hydrochloride) and 0.2 mM sulfo-NHS (sulfo-N-hydroxysuccinimide) for seven minutes, followed by a seven-minute injection of streptavidin at 10 ug/ml in 10 mM sodium acetate, pH 4.5, and finally a seven-minute blocking step of 1 M ethanolamine, pH 8.9. This coupling method resulted in a density ∼15,000 RU (resonance units) of streptavidin on all three flow cells of the COOH5 chip. Both the biotinylated CAII and target kinase were then captured to densities of ∼9000 RU.
Analysis of sulfonamide/CAII interactions
Sulfanilamide and 4-carboxybenzenesulfonamide (CBS) were each tested at 25°C for binding to the CAII and reference surfaces using 10 μM and 20 μM as the highest concentration, respectively. Each compound was tested using both the standard (with a manually prepared three-fold dilution series) and the FastStep injection methods at a flow rate of 200 uL/min. Each concentration in both methods was replicated seven times to establish reproducibility. Since the responses rapidly returned to baseline during the wash phase, no surface regeneration between binding cycles was required. The response data were processed in Qdat using a reference surface to correct for any bulk refractive index changes and blank injections for double referencing [11]. The binding profiles were fit globally to a 1:1 interaction model. For the FastStep injections, a sample of 20% sucrose was used to define the concentration gradient and applied automatically within Qdat during data analysis. Each of the seven repeated experiments was fit independently to generate the experimental standard deviations reported for each data set. Eight additional sulfonamide-based inhibitors (sulpiride, 4-(aminomethyl)benzenesulfonamide, benzenesulfonamide, 1,3-benzenedisulfonamide, furosemide, dansylamide, acetazoamide, and 6-ethoxy-2-benzothiazolesulfonamide were characterized using the 3-fold 5-step injection. Each compound was tested at 20 μM as the highest concentration and each binding test (except for the high-affinity binder, 6-ethoxy-2-benzothiazolesulfonamide) was replicated three times.
Analysis of ADP and fragment compounds
Using the standard injection method, ADP was tested at 25°C for binding to the target kinase and CAII surfaces using a two-fold dilution series starting with 300 uM as the highest concentration in HBS running buffer supplemented with 10 mM MgCl2. The entire ADP concentration series was tested in triplicate and responses at equilibrium were fit to a 1:1 interaction model to determine the binding affinity. Using two-fold, seven-step FastStep injections, ADP and a set of 320 fragment compounds were tested at 25°C for binding to the kinase and CAII surfaces using 100 uM as the highest concentration. In this analysis, 3% DMSO was added to the HBS-Mg buffer and ADP was run in duplicate as a positive control at the beginning of the fragment assay and then after every 96 samples. Response data were processed as described above and selected compounds were fit to a 1:1 interaction model.
Results
Two- and three-fold FastStep injections
In order to demonstrate the reproducibility of the step gradients created within the SensíQ instrument, we took advantage of the ability of SPR to monitor the refractive index of an injected sample. Figure 2 presents the response profiles for a FastStep three-fold (five steps; shown in blue) and a two-fold (seven steps; in black) dilution series of 20% sucrose. Note that each injection series is replicated seven times. The reproducibility is so high both in terms of similar start times at each step and the response level at each dilution step that it is in fact difficult to discern any differences between the replicate injections in the main panel of the Figure. To provide a better view of the replicates, the inset shows a zoomed-in view of the third step within the three-fold dilution series. The standard deviations in the overall response profile for both the two- and three-fold dilution series is less than 0.3%. This demonstrates that mechanically the internal stepping function within the SensíQ instrument is highly reproducible. This also allows us to use the profile of the sucrose injection to define the concentration of an analyte throughout the entire concentration profile. This is done by automatically fitting a smooth function to the sucrose response profile to remove any systematic deviations in the response that are visible between injection steps and then applying that profile to determine the analyte concentration at any time point. A separate injection of sucrose is run in standard mode to provide a measure of the response at 100% analyte concentration.
Figure 2.
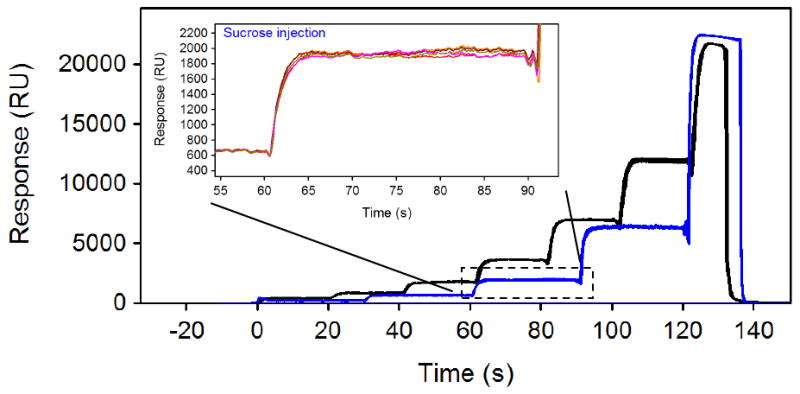
Sucrose concentration profiles created by two-fold (black lines) and three-fold (blue lines) FastStep injections of 20% sucrose using SensíQ Pioneer. For both concentration series, the responses for seven replicates are overlaid. The inset shows a zoomed-in view of the third step within the three-fold dilution series.
Validating FastStep injections
Biotinylated CAII was captured to a density of ∼9000 RU onto a streptavidin-immobilized COOH5 sensor chip (data not shown). Two sulfonamide-based inhibitors, sulfanilamide and 4-carboxybenzenesulfonamide (CBS) were tested for binding to the carbonic anhydrase II surface using the standard injection method (Fig. 3A and 3C) as well as with a three-fold FastStep injection (Fig. 3B and D). (Note that for the standard method, all analyte dilutions were performed manually, whereas the FastStep method simply required the preparation of a single solution of each analyte.) Each compound and injection series was tested seven times and the response data from each test was globally fit to a 1:1 interaction model to extract binding constants for each interaction. From a visual inspection of the response profiles we see that the SensíQ system produced highly reproducible data for both injection methods. The data from both methods also were well described by a simple 1:1 interaction model. The binding constants determined from the standard and FastStep injection methods are reported in Table 1. Within experimental error, the same binding constants were obtained from the standard and FastStep injection methods for both compounds.
Figure 3.
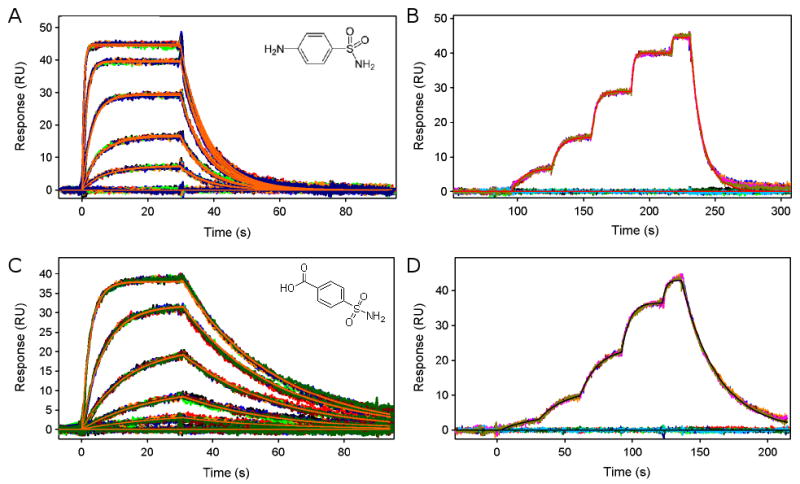
Sensorgrams of sulfanilamide and CBS binding to a CAII surface. Panels A and C depict the concentration profiles determined using the standard injection mode. Panels B and D show the responses from three-fold dilution series using FastStep injections. Starting concentrations were 10 μM for sulfanilamide and 20 μM for CBS. In each assay, every analyte concentration was tested seven times and the responses were globally fit to a 1:1 interaction model. Fits are shown by the smooth red lines in panels A to C and by the black line in D.
Table 1.
Binding constants determined at 25 °C.
| ka (M-1s-1) | kd (s-1) | KD (μM) | KD (μM) ProteOn (2) | KD (μM) Biacore (8) | |
|---|---|---|---|---|---|
| Sulpiride | 7.2(3)×103 | 0.284(4) | 39(1) | 76(20) | 48(10) |
| 4-(Aminomethyl)benzenesulfonamide | 7.3(2)×103 | 0.0384(1) | 5.2(2) | 3(2) | |
| Sulfanilamide (standard inj) | 3.56(3)×104 | 0.123(4) | 3.4(1) | ||
| Sulfanilamide | 3.58(9)×104 | 0.115(4) | 3.2(1) | 4.2(9) | 3(1) |
| 4-Carboxybenzenesulfonamide (standard inj) | 1.99(7)×104 | 0.0359(5) | 1.80(7) | ||
| 4-Carboxybenzenesulfonamide | 2.1(2)×104 | 0.0367(1) | 1.7(2) | 1.6(4) | 0.9(2) |
| Benzenesulfonamide | 1.35(2)×105 | 0.131(1) | 0.97(1) | 1.1(1) | 0.8(2) |
| 1,3-Benzenedisulfonamide | 1.79(2)×105 | 0.1101(5) | 0.613(8) | 0.64(7) | 0.8(7) |
| Furosemide | 7.06(9)×104 | 0.0353(1) | 0.500(6) | 0.8(1) | 1.0(2) |
| Dansylamide | 2.83(6)×105 | 0.106(1) | 0.374(9) | 0.8(3) | 0.4(1) |
| Acetazolamide | 1.23(1)×106 | 0.0174(7) | 0.0141(1) | 0.025(4) | 0.03(1) |
| 6-Ethoxy-2-benzothiazolesulfonamide | 1.00(3)×107 | 0.00112(2) | 0.000112(3) |
Numbers in parentheses represent the standard error in the last reported digit
Known CAII inhibitor screening
To further illustrate the capabilities of the FastStep injections we tested eight additional sulfonamide based CAII inhibitors that range in affinity from less than a nM to ∼50 uM. As expected, the shapes of the steps within an injection series varied depending on the binding kinetics (Fig. 4). These profiles are arranged from the weakest binder (sulpiride, A) to the tightest (6-ethoxy-2-benzothiazolesulfonamide, H). Seven inhibitors were tested three times and the overlays of the response profiles (red, blue, and black) demonstrate that they were all very reproducible. The highest-affinity compound, 6-ethoxy-2-benzothiazolesulfonamide, was only tested once since even at the lowest concentration step the binding sites were saturated and the compound dissociated slowly from CAII (therefore, replicate tests would require regenerating the surface between the tests). As listed in Table 1, the FastStep binding constants determined for this set of compounds are consistent with the values determined using other instruments, including BioRad ProteOn XPR36 (2) and from a benchmark study involving Biacore platforms (8).
Figure 4.
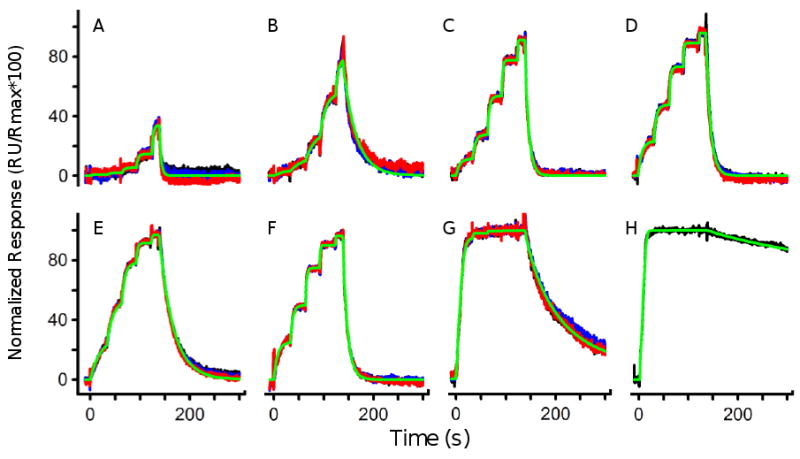
FastStep profiles of eight sulfonamide-based inhibitors binding to CAII. Sulpiride (A), 4-(aminomethyl)benzenesulfonamide (B), benzenesulfonamide (C), 1,3-benzenedisulfonamide (D), furosemide (E), dansylamide (F), acetazolamide (G), 6-ethoxy-2-benzothiazolesulfonamide (H) were characterized using the three-fold, five-step injection. Each compound was tested using 20 μM as the highest concentration and binding tests shown in A-G were replicated three times (shown by the red, blue and black lines). The green lines represent a fit to the response profiles using a 1:1 interaction model.
ADP binding to a target kinase
To further validate the application for the FastStep approach, we biotinylated a target kinase protein and captured it onto a COOH5 sensor chip at a density of ∼9000 RU. As a preliminary test for binding activity, we injected ADP in a two-fold dilution series with 300 uM as the highest concentration using standard injections. As shown in Figure 5, the seven-concentration dilution series was injected over the kinase and CAII surfaces and replicated three times. Binding responses were detectable, concentration dependent, and reproducible on the kinase surface (Fig. 5A) but no reliable ADP binding was observed on the negative-control CAII surface (Fig. 5B). The dissociation rate for the ADP/kinase complex is very fast with the response returning to baseline immediately during the dissociation phase. As shown in Figure 5C, the equilibrium response data fit well to a 1:1 interaction model and the triplicate repeats of the assay yielded an average KD of 43 ± 6 uM.
Figure 5.
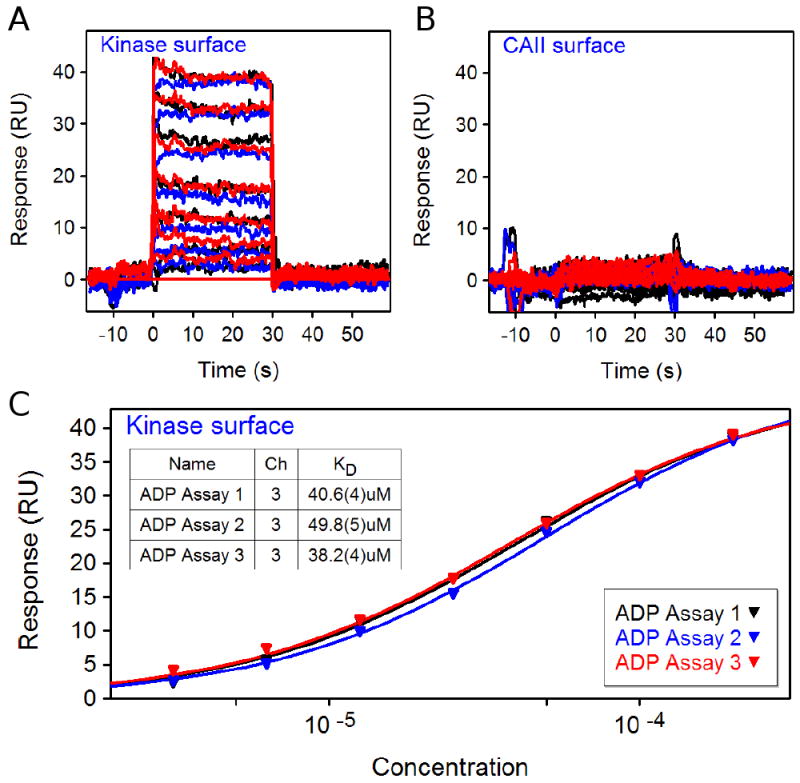
Panels A and B show three analyses of standard injections of ADP (two-fold dilution series starting at 300 uM) across kinase and CAII surfaces. C. Fits of the triplicate ADP equilibrium response data from the kinase surface to a 1:1 interaction.
Fragment screening with FastStep injections
Having demonstrated the kinase surface was active for nucleotide binding, we next set up a fragment screening assay for 320 compounds. Each compound was tested starting at 100uM in a two-fold, seven-step FastStep series. As a positive control, ADP was tested twice at the beginning of the assay (shown as black responses) and again in duplicate after the 96th (blue responses), 192th (brown), and 288th (green) samples.
Figure 6 shows the overlay of the binding responses for the ADP repeats throughout the screen. Several points are important to notice in this Figure. First, the duplicate analyses of ADP at each time point overlay well, demonstrating the reproducibility of the injections when tested back to back. Second, the ADP responses collected after every 96 samples are about 20% lower in response intensity. This signal decrease over time corresponds to a gradual decay of the kinase surface activity; the ability to track the activity of the surface throughout the screen is vital for accurate comparison of hits identified in the early and late stages of the screen [12]. And third, despite the kinase's gradual loss in binding activity, the data for each ADP FastStep injection fit well to a 1:1 interaction model (indicated by the red lines in Fig. 6). The affinities determined for the replicate assays averaged 41 ± 2 uM, which matches the affinity determined from the standard-injection analysis (Fig. 5).
Figure 6.
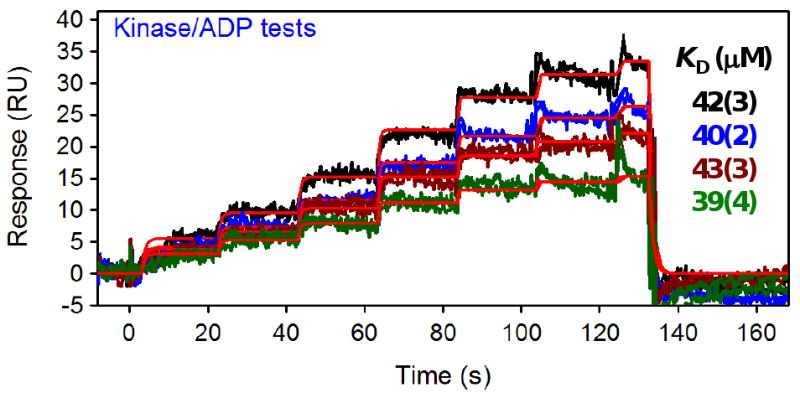
Replicates of a two-fold FastStep ADP dilution series throughout the screen of a fragment library against a kinase surface. The colored responses (black, blue, brown and green lines) represent duplicate test of ADP (injected at 300 uM as the highest concentration in a two-fold dilution series) at the beginning of the assay and after every 96 samples. Red lines represent the fit of the data to a 1: 1 interaction model to extract the affinities reported in the inset, with the number in parentheses indicating the standard error in the last digit.
Between the ADP binding tests, we collected FastStep data for a total of 320 fragment samples. Figure 7A and 7B show the responses from 96 samples injected over the CAII and kinase surfaces, respectively; some compounds bound specifically (and with a range of affinities) to the CAII surface and others bound to the kinase surface. To examine these responses in detail, we present examples of isolated plots for ten compounds in Figure 8.
Figure 7.
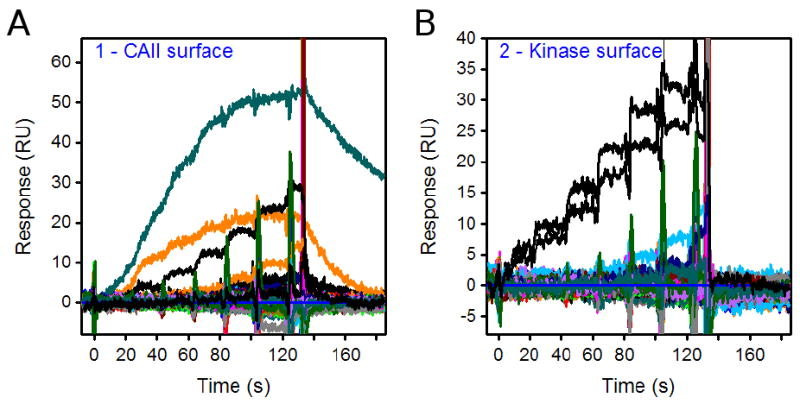
Overlays of FastStep responses for 96 fragments (each tested in a two-fold dilution series starting at 100 uM) over the (A) CAII and (B) kinase surfaces. In panel B, the black lines represent the responses for ADP tested before and after the analysis of 96 samples.
Figure 8.
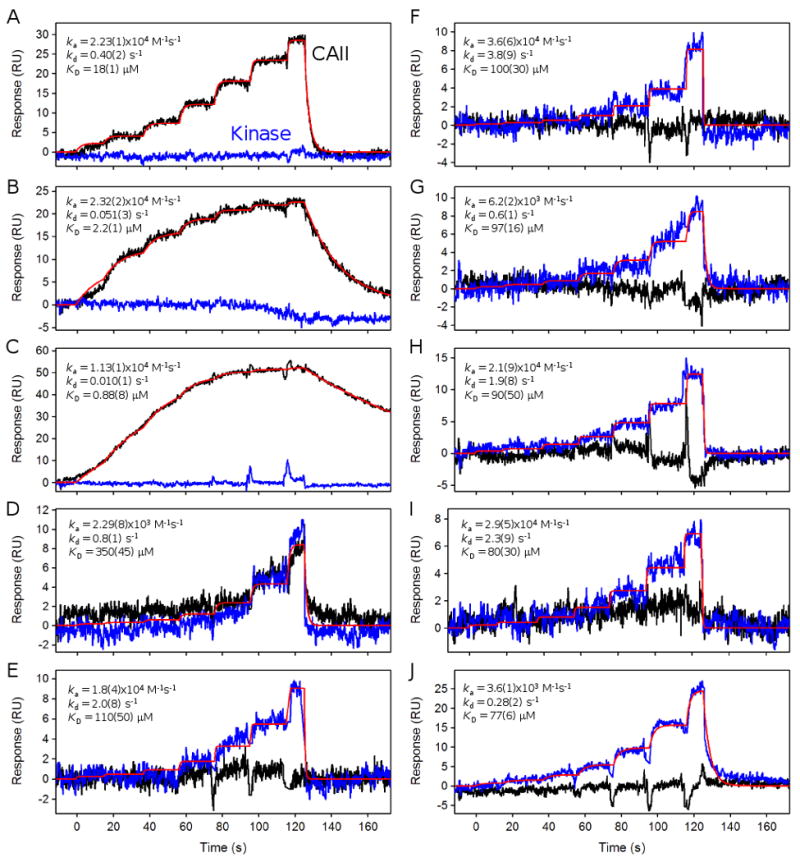
FastStep response profiles for selected compounds from a 320-fragment library that bind specifically to CAII (black lines) (panel A, B, and C), bind equally to both CAII and kinase (blue lines) (panel D), or bind specifically to the kinase (E to J). Red lines show a global fit to the response data used to extract the binding constants reported in each figure.
Plots A, B and C in Figure 8 highlight the responses from compounds that appear to specifically bind to the CAII surface (shown by black lines) and do not show significant binding to the target kinase surface (blue lines). The responses were fit well by a 1:1 interaction model (shown as red lines), which was used to extract the binding constants reported within each plot.
Plot D in Figure 8 shows an example of a compound that appears to bind equally to the CAII and kinase surfaces. Nonspecific protein binders like this one are fairly commonly encountered when fragment screening. Data like these emphasize the importance of screening fragments against multiple targets.
Plots E to J in Figure 8 are responses from six compounds that appear to bind specifically to the kinase surface. Note that most of these response intensities are not particularly large. The low signals are a combination of the small size of the fragments, their low affinity, and the fact that, in some cases, by the time they were assayed the kinase surface had lost significant activity (demonstrated by the periodic ADP tests). Global fits of the FastStep concentration series are shown by the red lines with the resulting binding constants inserted within each plot. Dissociation rate constants faster than 2 s-1 should be considered as estimates since there may not be enough separation between the binding response and the start of the wash-out phase to accurately define this binding parameter. However, in these cases there are response data at equilibrium for each step in the concentration series, which helps to accurately define the KD. The responses for the compound shown in plot J clearly display a slower decay from the kinase surface compared to compounds E to I.
Discussion
The FastStep injection method is designed to streamline biosensor assays by testing a full concentration series of analyte in one injection. Importantly, the concentration series is created directly within the SensíQ Pioneer biosensor system itself. The user simply prepares a single (the highest) concentration of the analyte to be tested. This saves preparation time, saves space in sample plates, and likely reduces pipetting errors. The user can choose to use either a two- or three-fold dilution series with seven or five steps, respectively. These dilutions effectively span a hundred-fold concentration range for the analyte. Because of the mechanics of the injection system, the time between each step is set to 26 and 30 seconds for the two- and three-fold steps, respectively. The user may select any amount of dissociation-phase time and can include standard regeneration injections. The FastStep method utilizes an injection of a highly refractive sample such as 20% sucrose to define the exact gradient that is created during the association phase. We showed that this gradient is extremely reproducible due to the accuracy of the stepper motor-driven syringe pumps. An advantage of SPR is that we can use the response for sucrose to define the concentration gradient for the analyte during data analysis. We have developed the Qdat software to apply this gradient automatically to the analyte injections during data analysis.
We used CAII to validate the FastStep injection approach since it is well characterized, stable, and readily available. And since the SensíQ instrument, as we demonstrated in Figures 2A and 2C, can also perform the standard injections (like those obtained from other biosensor platforms) as well as the FastStep injections, we could directly compare the two injection approaches. We found similar kinetic parameters for both injection methods. Further we showed that the binding affinities determined for a set of sulfonamide-based compounds correlated well with measurements made previously with BioRad's ProteOn system as well as from a multi-user benchmark study performed using Biacore. Together these results validate the new injection method.
In many respects, the kinase system we used to test fragment screening with FastStep is typical of the challenges we face in real-world applications. The binding of the control ADP showed the kinase surface lost about 20% of its activity over every 96 cycles. Since each FastStep binding cycle required about four minutes, the time between the ADP control tests was just over six and half hours. We did not observe a significant loss in ADP binding activity for the replicate tests of the standard injections (Fig. 5A and 5C) because these assays were recorded over a short period of time.) The advantage of the FastStep injections is that a full concentration series is collected within a short period of time for each analyte. Therefore, as we demonstrated for ADP, the loss in overall binding activity does not affect the affinity determination as each profile may be fit independently.
We identified a number of relatively tight binders to the CAII surface from the fragment screen (in fact, three ranged in affinity from 18 to 0.9 uM). Each was found to contain a sulfonamide group, which is a common feature of CAII inhibitors. In fact, we often use CAII as a control protein in fragment screens since it is easy to identify hits from a library that contain sulfonamides, which helps validate that the screening assay is working even if no positive hits are evident from the target surface.
In this fragment screen we found a number of potential binders to the kinase surface with affinities around 100 uM. While these are not exceptionally tight, they are typical affinities obtained from a primary screen of a fragment library and could provide a good starting point for further development. We are currently investigating compound/target complex formation using structural analysis.
Screening 320 compounds using the FastStep two-fold dilution series required a little over 24 hours to complete. The added information provided by the full concentration series helped to identify and characterize the binding affinity of the potential hits. Depending on the size of the fragment library, one may choose to run the primary and/or follow-up screens using the FastStep approach. Finally, automatically diluting samples within the instrument greatly simplifies sample preparation and represents a significant improvement in biosensor assay automation.
Acknowledgments
This work was supported by the NIH grant (GM P50 082545) awarded to DGM.
Footnotes
Publisher's Disclaimer: This is a PDF file of an unedited manuscript that has been accepted for publication. As a service to our customers we are providing this early version of the manuscript. The manuscript will undergo copyediting, typesetting, and review of the resulting proof before it is published in its final citable form. Please note that during the production process errors may be discovered which could affect the content, and all legal disclaimers that apply to the journal pertain.
References
- 1.Myszka DG, Rich RL. Implementing surface plasmon resonance biosensors in drug discovery. Pharm Sci Technol Today. 2000;3:310–317. doi: 10.1016/s1461-5347(00)00288-1. [DOI] [PubMed] [Google Scholar]
- 2.Bravman T, Bronner V, Lavie K, Notcovich A, Papalia GA, Myszka DG. Exploring ‘one-shot’ kinetics and small molecule analysis using the ProteOn® XPR36 array biosensor. Anal Biochem. 2006;358:281–288. doi: 10.1016/j.ab.2006.08.005. [DOI] [PubMed] [Google Scholar]
- 3.Karlsson R, Katsamba PS, Nordin H, Pol E, Myszka DG. Analyzing a kinetic titration series using affinity biosensors. Anal Biochem. 2006;349:136–147. doi: 10.1016/j.ab.2005.09.034. [DOI] [PubMed] [Google Scholar]
- 4.Day YSN, Baird CL, Rich RL, Myszka DG. Direct comparison of equilibrium, thermodynamic, and kinetic rate constants determined by surface- and solution-based biophysical methods. Prot Sci. 2002;11:1017–1025. doi: 10.1110/ps.4330102. [DOI] [PMC free article] [PubMed] [Google Scholar]
- 5.Myszka DG, Abdiche YN, Arisaka F, Byron O, Eisenstein E, Hensley P, Thomson JA, Lombardo CR, Schwarz F, Stafford W, Doyle ML. The ABRF-MIRG'02 Study: Assembly state, thermodynamic, and kinetic analysis of an enzyme/inhibitor interaction. J Biomolec Techniq. 2003;14:247–269. [PMC free article] [PubMed] [Google Scholar]
- 6.Myszka DG. Analysis of small molecule interactions using Biacore S51 technology. Anal Biochem. 2004;329:316–323. doi: 10.1016/j.ab.2004.03.028. [DOI] [PubMed] [Google Scholar]
- 7.Cannon MJ, Papalia GA, Navratilova I, Fisher RJ, Roberts LR, Worthy KM, Stephen AG, Marchesini GR, Collins EJ, Casper D, Qiu H, Satpaev D, Liparoto SF, Rice DA, Gorshkova II, Darling RJ, Bennett DB, Sekar M, Hommema E, Liang AM, Day ES, Inman J, Karlicek SM, Ullrich SJ, Hodges D, Chu T, Sullivan E, Simpson J, Rafique A, Luginbühl B, Nyholm Westin S, Bynum M, Cachia P, Li YJ, Kao D, Myszka DG. Comparative analyses of a small molecule/enzyme interaction by multiple users of Biacore technology. Anal Biochem. 2004;330:98–113. doi: 10.1016/j.ab.2004.02.027. [DOI] [PubMed] [Google Scholar]
- 8.Papalia GA, Leavitt S, Bynum MA, Katsamba PS, Wilton R, Qiu H, Steukers M, Wang S, Bindu L, Phogat S, Giannetti AM, Ryan TE, Pudlak VA, Matusiewicz K, Michelson KM, Nowakowski A, Pham-Baginski A, Brooks J, Tieman B, Bruce BD, Vaughn M, Baksh M, Cho YH, De Wit M, Smets A, Vandersmissen J, Michiels L, Myszka DG. Comparative analysis of ten small molecules binding to carbonic anhydrase II by different investigators using Biacore technology. Anal Biochem. 2006;359:94–105. doi: 10.1016/j.ab.2006.08.021. [DOI] [PubMed] [Google Scholar]
- 9.Navratilova I, Papalia GA, Rich RL, Bedinger D, Brophy S, Condon B, Deng T, Emerick AW, Guan HW, Hayden T, Heutmekers T, Hoorelbeke B, McCroskey MC, Murphy MM, Nakagawa T, Parmeggiani F, Qin X, Rebe S, Tomasevic N, Tsang T, Waddell MB, Zhang FF, Leavitt S, Myszka DG. Thermodynamic benchmark study with Biacore technology. Anal Biochem. 2007;364:67–77. doi: 10.1016/j.ab.2007.01.031. [DOI] [PubMed] [Google Scholar]
- 10.Papalia GA, Myszka DG. Exploring minimal biotinylation conditions for biosensor analysis using CAP chips. Anal Biochem. 2010;403:30–35. doi: 10.1016/j.ab.2010.03.044. [DOI] [PubMed] [Google Scholar]
- 11.Myszka DG. Improving biosensor analysis. J Mol Recog. 1999;12:279–284. doi: 10.1002/(SICI)1099-1352(199909/10)12:5<279::AID-JMR473>3.0.CO;2-3. [DOI] [PubMed] [Google Scholar]
- 12.Rich RL, Myszka DG. Kinetic analysis and fragment screening with FujiFilm AP-3000. Anal Biochem. 2010;402:170–178. doi: 10.1016/j.ab.2010.03.043. [DOI] [PubMed] [Google Scholar]