

Summary
Purpose
EEG-triggered functional magnetic resonance imaging (fMRI) was used to identify areas of brain activation during spontaneous spike-and-wave discharges (SWDs) in an epileptic rat strain under awake conditions.
Methods
Spontaneous absence seizures from 10 WAG/Rij rats were imaged by using T2*-weighted echo planar imaging at 4.7 Tesla. fMRI of the blood-oxygenation-level–dependent (BOLD) signal was triggered based on EEG recordings during imaging. Images obtained during spontaneous SWDs were compared with baseline images.
Results
Significant positive BOLD signal changes were apparent in several areas of the cortex and several important nuclei of the thalamus. In addition, no negative BOLD signal was found in any brain area.
Conclusions
We have shown that EEG-triggered BOLD fMRI can be used to detect cortical and thalamic activation related to the spontaneous SWDs that characterize absence seizures in awake WAG/Rij rats. These results draw an anatomic correlation between areas in which increased BOLD signal is found and those in which SWDs have been recorded. In addition, no negative BOLD signal was found to be associated with these spontaneous SWDs. We also demonstrated the technical feasibility of using EEG-triggered fMRI in a genetic rat model of absence seizure.
Keywords: Absence seizure, fMRI, Epilepsy, WAG/Rij, Imaging
Typical absence seizures consist of multiple, brief (≤20 s) impairments of consciousness with characteristic bilaterally synchronous 3-Hz spike-and-wave discharges (SWDs) on electroencephalography (EEG). A typical absence seizure is manifested behaviorally as a “staring spell” and can be accompanied by atonic postures such as drooping of the head and/or automatisms such as lip smacking (1).
Genetic rat models of absence epilepsy have been studied for many years and are thought to mimic more accurately the spontaneous seizures of human epilepsy than do drug-induced animal models. The strain of rats named WAG/Rij (Wistar Albino Glaxo strain bred in Rijswijk, the Netherlands) have been inbred for absence-like characteristics for >100 generations, which implies that they are homozygous (2,3). This strain exhibits spontaneous SWDs that have a frequency of 7 to 11 Hz, duration of 1 to 45 s, and an amplitude of 200 to 1,000 μV (4). As in the human condition, EEG changes are accompanied by immobile behavior and staring. Age-related changes in the number of SWDs have been found. At an age of 75 days, only 17% of rats experience a single SWD in a 4-h period, compared with 140 and 245 days, at which SWDs affected 83% and 100% of rats, respectively (5).
Electrophysiology recordings of the WAG/Rij model have been used to uncover the neural structures responsible for the generation and propagation of SWDs. Many of these studies have implicated the coupling of thalamic oscillations and cortical rhythms as the cause of the absence-like behaviors and EEG changes (6–8). Recently this rat model was used to study the coordinated electrical field activity between thalamic and cortical sites by using multielectrode recordings (9). Spontaneous SWDs were found to be associated first with activity in the perioral region of the somatosensory cortex, followed by cortical propagation and then thalamic activation.
In recent years, functional magnetic resonance imaging (fMRI) has come to the forefront as a powerful tool in neuroscience for noninvasive imaging of brain function. Increased neuronal activity is accompanied by a regional increase in metabolism followed by a large change in cerebral blood flow, which overcompensates for the increase in oxygen consumption. Blood-oxygenation-level–dependent (BOLD) fMRI is a technique sensitive to the oxygenation status of hemoglobin (10–14). BOLD imaging has been widely used to map brain functions and has recently been shown to correlate with evoked potential measurements (15). Although many fMRI studies have been confined to humans and anesthetized animals, the technology has recently been developed for imaging fully conscious animals (16–26).
The ability to detect BOLD signal changes that correlate with spontaneous epileptiform activity is possible with the use of EEG-triggered fMRI (27–31). This technique essentially consists of continuously monitoring the EEG of a subject in the magnet, with the operator manually triggering image acquisition on identifying seizure-related EEG changes (27,32–35). This procedure is possible because of the delay that exists between electrical neuronal activity and the associated hemodynamic changes. It has been shown that after brief neuronal activation, BOLD signal changes start to increase after ~2 s, peak after 4 to 7 s, and last for a total of ~10 s (36). One study using EEG-triggered fMRI in patients during interictal epileptiform activity found that BOLD signal changes correlated with the spatial location of discharges seen with EEG (27). Another issue concerning EEG-triggered fMRI is the number of spikes necessary to produce significant fMRI activation. It has been shown that single spikes (occurring as briefly as 100 ms) can be associated with regional changes of cerebral hemodynamics and are detectable as a BOLD signal (29).
In the present study, we used EEG-triggered fMRI of SWDs in the WAG/Rij model to determine the activity of several thalamic nuclei and cortical areas proposed to be integral to the formation and propagation of SWDs. Significant positive BOLD activation was found in the thalamus including the nucleus reticularis, ventral posteromedial/posterolateral nuclei, posterior nuclei, and mediodorsal nuclei. Significant positive BOLD also was found throughout the cortex including the sensory, parietal, and temporal cortices.
METHODS
Animals
Male WAG/Rij rats weighing 250 to 350 grams (150–200 days old) were obtained from Harlan Sprague–Dawley (The Netherlands). Animals were housed in pairs in Plexiglas cages (48 × 24 × 20 cm), maintained on a 12:12 h light/dark cycle (lights on at 7:00) and provided food and water ad libitum. All animals were acquired and cared for in accordance with the guidelines published in the Guide for the Care and Use of Laboratory Animals (National Institutes of Health Publications No. 85-23, Revised 1985).
Bench-top studies
Before imaging, studies were performed to characterize the number and duration of SWDs in awake, restrained rats. Five rats were initially anesthetized with 2 mg ketamine (Ketaset; Fort Dodge Animal Health, Fort Dodge, IA, U.S.A.) and 0.02 mg medetomidine (Domitor; Pfizer Animal Health, New York, NY, U.S.A.). Epidural cortical electrodes were secured in the skull and connected to an EEG recorder by using the Biopac system (BIOPAC Systems Inc., Goleta, CA, U.S.A.). Electrodes were placed over the frontal and parietal cortices at the following stereotaxic positions from bregma (frontal, 1.6 mm rostral, ±2.5 mm lateral; parietal, 1.6 mm caudal, ±2.5 mm lateral). Animals were secured in the restraining device used for functional imaging studies and injected with 0.1 mg atipamezole (Antisedan; Pfizer Animal Health) to reverse the anesthesia. The animal restrainer used for imaging consisted of a multiconcentric Plexiglas head and body holder with built-in radiofrequency dual coil electronics (Insight Neuroimaging Systems, LLC, Worcester, MA, U.S.A.). The average number and duration of SWDs were calculated based on 38 epochs of SWDs occurring in five rats.
Before imaging studies, animals used for imaging were acclimated to the restrainer and the imaging protocol. Animals were lightly anesthetized with 2% isoflurane and secured into the restrainer. When animals were fully conscious, the restraining unit was placed into a black opaque tube that served as a “mock scanner,” and a tape-recording of an MRI pulse sequence played for 90 min to simulate the bore of the magnet and an imaging protocol. This procedure was repeated every other day for 3 to 4 days. Previous work by our laboratory has shown that this acclimation procedure in rats significantly reduces body temperature, motor movements, heart rate, and plasma corticosterone levels by the third acclimation day (37).
Imaging studies
Just before the imaging session, 10 rats were anesthetized with ketamine and medetomidine, as in the bench-top studies described previously. A topical anesthetic of 2.5% lidocaine gel was applied to the skin of the scalp, and MR-compatible nonmagnetic epidural EEG electrodes were fixed to the skull. In addition, lidocaine gel was applied to soft tissue around the ear canals and the bridge of the nose, as these are pressure points in the restrainer. A plastic semicircular headpiece with blunted ear supports that fits into the ear canals was positioned over the ears. The head was placed into a cylindrical head holder with the animal's canines secured over a bite bar and ears positioned inside the head holder with adjustable screws fitted into lateral sleeves. An adjustable surface coil built into the head holder was pressed firmly on the head and locked into place. The body of the animal was placed into a body restrainer. The body restrainer “floats” down the center of the chassis connecting at the front and rear end-plates and buffered by rubber gaskets. The head piece locks into a mounting post on the front of the chassis. This design isolates all of the body movement from the head restrainer and minimizes motion artifact. Once the animal was positioned in the body holder, a volume coil was slid over the head restrainer and locked into position. This procedure takes 2 to 3 min. Animals are usually fully conscious at the end of the setup because atipamezole (Antisedan) is administered at the point the animal is placed into the head holder, as in the bench-top studies described previously.
The EEG signal was amplified inside the radiofrequency (RF)-shielded room by using a battery-operated preamplifier and converted to a fiberoptic signal, which was recorded with MP100 hardware and MP100 Manager Software (BIOPAC Systems Inc.). Similar setups have been used in previous human and animal imaging experiments (24,38).
All images were acquired by using a 4.7-T/40-cm (Oxford magnet Technology, Oxford, U.K.) horizontal magnet interfaced to a Paravision console (Bruker, Billerica, MA, U.S.A.). High-resolution anatomic data sets were acquired by using a fast spin echo (RARE) sequence (TR = 2.5 s; effective TE = 56 ms; echo train length = 8; field of view = 3 × 3 cm; data matrix 256 × 256; number of slices = 4; slice thickness = 1.0 mm). Functional images were acquired by using a two-segment gradient echo planar imaging (EPI) sequence (TR = 1,000 ms; TE = 25 ms; FOV = 3 × 3 cm; matrix = 128 × 128; number of slices = 4; slice thickness = 1.0 nm). Four contiguous functional images were acquired in 2 s, and each image acquisition included 15 sets of images for a total acquisition time of 30 s. The coordinates of slices collected, from rostral to caudal, are −1.5mm, −2.6 mm, −3.8 mm, and −4.8 mm, from bregma, respectively. The most caudal slice (−4.8mm) was excluded from analysis because it did not include significant thalamic and frontal–parietal structures.
Seizure image acquisition was triggered when SWDs were twice the background amplitude and lasted for >1 s (3). These criteria are important because two distinct types of SWDs have been reported in WAG/Rij rats, with only the type I SWDs representing true absence seizures (7). Postimaging analysis of the EEG changes was completed and imaging data discarded if these criteria were not met. Image acquisition was triggered manually, when SWDs were detected, with a delay of ~2.5 s. This delay is similar to other reports of EEG-triggered fMRI (27–31). Baseline images were acquired when the EEG showed a normal, awake pattern for >30 s, similar to that used in other EEG-triggered fMRI studies (27–31). Baseline image acquisitions were interspersed throughout each 1- to 2-h imaging session. Because artifact obscures the EEG during imaging, it is possible that spikes could have occurred, undetected, during these baseline acquisitions. However, this is unlikely because only five to six SWD episodes occur per hour, and more important, the seizure event has dramatic effects on BOLD signal activity, as noted in the activational maps and time-course graphs. No such changes in BOLD activity occurred in any of the baseline acquisitions. Observations of movies comprising all images during acquisition showed little motion artifact. Muscle movement associated with swallowing would occasionally affect image quality slightly in a single slice.
Regions of interest (ROIs) used for analysis included the sensory (S1), parietal (PtA), and temporal (Te) cortices, and several thalamic nuclei including the reticular thalamic nuclei (nRT), mediodorsal nucleus (MD), ventral posteromedial/posterolateral nuclei (VPM/VPL), and posterior thalamic nuclei (Po). These ROIs were drawn manually on the images, according to the Paxinos and Watson rat brain atlas, and analyzed for changes in BOLD signal intensity (39). Comparisons to create activation maps were done by first appending three baseline periods, collected at various times throughout the imaging session, to create one continuous baseline. With Stimulate's Student's two-tailed t test, this appended baseline was then compared with each seizure period collected for a given animal (40). Voxels whose BOLD percentage change, relative to the control period, was significantly different (either increased or decreased) at a 95% confidence level were overlaid onto their respective anatomic data set. No correction was made for multiple comparisons.
ROI analyses to calculate BOLD signal values and time-course plots were based on the signal values averaged across the voxels in each respective region. Because all ROIs are bilateral structures, the results from each hemisphere were combined. In total, 34 trains of SWDs in 10 rats were used for these ROI analyses. These values were averaged for the multiple seizures in each animal and then across all animals to determine average time courses and BOLD signal changes.
RESULTS
Bench-top studies were used to characterize the number and duration of SWDs in restrained rats. The average number of SWDs was 5.7/h (range, 3.5–8.2). The average duration of SWDs was 45.1 s/h (range, 18.4–67.2), with the average duration of a single train of SWDs being 8.1 s (range, 2.0–31.1).
EEG was recorded continuously while the animal was in the magnet, and a representative trace can be seen in Figure 1. This trace shows an example of seizure activity, the delay before imaging, and the masking of EEG activity once image acquisition began. Representative activation maps of three consecutive brain slices, together with delineations of representative thalamic and cortical ROIs, are shown in Figure 2. These are the activation maps of a single seizure. BOLD activation can be seen clustered throughout the S1, PtA, and Te cortices, along with several thalamic nuclei including the nRT, MD, VPM/VPL, and Po. No significant negative BOLD activation was seen for any seizures. To explore the negative BOLD response in the WAG/Rij model further, the pixel clustering and confidence interval used for creating the activation maps were decreased, to determine if the absence of negative BOLD was due to a lack of statistical power. The activation map in a few animals showed a few individual pixels of negative BOLD, which is not a significant finding.
FIG. 1.
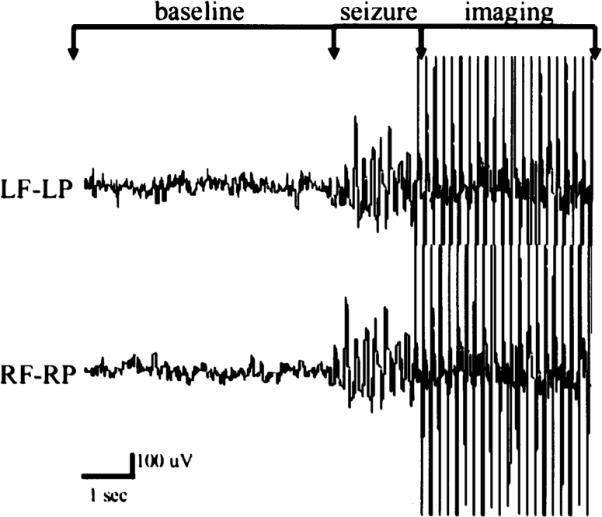
Representative EEG recording collected during functional magnetic resonance imaging (fMRI). Nonmagnetic epidural electrodes were placed in the frontal and parietal cortices to monitor seizure activity during the imaging session. Normal, awake EEG was present during baseline imaging. Imaging was triggered after the formation of epileptiform activity similar to that shown during the seizure period. Artifact due to image acquisition can be seen with a delay of ~2 s after seizure activity. RF, right frontal cortex; RP, right parietal cortex; LF, left frontal cortex; LP, left parietal cortex.
FIG. 2.

Activation maps of blood-oxygen-level–dependent (BOLD) signal responses during spontaneous spike-and-wave discharges. Colored pixels, the statistically significant (p < 0.05) pixels determined by t test analysis (for a single seizure) and overlaid onto the corresponding anatomy. Three consecutive slices through the brain are shown for an individual rat. The top row shows the regions of interest used for analysis. MD, mediodorsal thalamic nuclei; nRT, nucleus reticularis thalami; Po, posterior thalamic nuclear group; PtA, parietal association cortex; S1, sensory cortex; Te, temporal cortex; VPM/VPL, ventral posteromedial/posterolateral thalamic nucleus.
Figure 3 shows the group-average percentage changes of BOLD signal intensity for each of the ROIs (n = 34 seizures), above the baseline values. All cortical and thalamic areas analyzed showed significant positive BOLD signal, above baseline values. During seizures, the BOLD signal changes were ≥4% in both cortical and thalamic ROIs.
FIG. 3.

Change in blood-oxygen-level–dependent (BOLD) signal intensity for each region of interest (ROI). The BOLD signal intensity change during spike–wave discharges (SWDs) is shown for ROIs in the cortex and thalamus (mean ± SEM, n=34 seizures). All ROIs are bilateral structures, so the signal changes from each hemisphere were combined. BOLD signal was averaged for each seizure over the entire 30-s acquisition. MD, mediodorsal thalamic nuclei; nRT, nucleus reticularis thalami; Po, posterior thalamic nuclear group; PtA, parietal association cortex; S1, sensory cortex; Te, temporal cortex; VPM/VPL, ventral posteromedial/posterolateral thalamic nucleus.
BOLD signal time courses for each thalamic and cortical ROI are plotted in Figs. 4 and 5, respectively. These time-course plots were constructed by averaging the BOLD signal values for the ROIs at each time point, for both baseline and seizure periods. Three baseline periods, acquired during normal, awake EEG activity and lasting for >30 s are shown in the plots. The baseline periods lasted 30 s and were interspersed over the imaging session for each rat. Average baseline data varied ~2%, which is consistent with other fMRI studies of awake animals (25). BOLD activation corresponding to seizure activity is increased from the start of the image acquisition and remains elevated for most ROIs until the end of the acquisition period.
FIG. 4.

Change in blood-oxygen-level–dependent (BOLD) signal intensity over time for each region of interest (ROI) in the thalamus. All thalamic ROIs showed significant BOLD signal changes from baseline. All ROIs are bilateral structures, so the signal intensities from each hemisphere were combined. These plots were created by averaging the value for all seizures at each time point. Each image acquisition was 2 s. BOLD signal changes are shown for each baseline period, collected at different points throughout the imaging session. MD, mediodorsal thalamic nuclei; nRT, nucleus reticularis thalami; Po, posterior thalamic nuclear group; VPM/VPL, ventral posteromedial/posterolateral thalamic nucleus.
FIG. 5.

Change in blood-oxygen-level–dependent (BOLD) signal intensity over time for each region of interest (ROI) in the cortex. All cortical ROIs showed significant BOLD signal changes from baseline. All ROIs are bilateral structures, so the signal intensities from each hemisphere were combined. These plots were created by averaging the value for all seizures at each time point. Each image acquisition was 2 s. BOLD signal changes are shown for each baseline period, collected at different points throughout the imaging session. PtA, parietal association cortex; S1, sensory cortex; Te, temporal cortex.
DISCUSSION
These data show that spontaneous SWDs in the WAG/Rij rat strain correlate with cortical and thalamic BOLD fMRI signal activation. Cortical areas and thalamic nuclei that show BOLD activation in the current study have been implicated in the pathogenesis of SWDs in previous neurophysiological studies. Electrophysiology recordings of SWDs in WAG/Rij rats have implicated the same cortical areas and thalamic nuclei that have shown BOLD activation in the current study (6–9). Specific thalamic relay nuclei, such as the VPM/VPL, and nonspecific relay nuclei, such as the MD and Po, were found to contribute to the generation and diffuse nature of SWDs (6). In addition, the nRT is believed to be crucial for the synchronization of thalamic rhythmic oscillations (41–43). The robust BOLD activation seen in all these nuclei underscores their importance to the pathophysiology of this seizure disorder. Also, because SWDs are generalized over the cortex, it is not surprising that BOLD activation was found in the S1, PtA, and Te cortical areas. Conversely, no significant BOLD activation was found in the hippocampus in the current study, an area in which no SWDs have been previously recorded by using electrophysiology (44,45). Therefore it appears that the BOLD signal of fMRI is specific for areas and structures that contribute to or participate in the production of SWDs.
A few studies have measured brain metabolism during SWDs in rats. Cerebral energy metabolism in a strain of genetic absence epilepsy rats has been measured, and widespread increases were found in all brain structures, regardless of their ability to form SWDs (46). A previous fMRI study of SWDs in WAG/Rij rats, under continuous anesthesia, showed focal BOLD activation in anterior brain regions (47). Therefore fMRI patterns of BOLD activation appear to correlate better with the brain areas responsible for the generation and propagation of SWDs.
An fMRI study of γ-butyrolactone (GBL)-induced absence seizures in rats was recently completed in our laboratory and demonstrated positive BOLD activation patterns similar to those of the current spontaneous seizure model (24). The GBL drug-induced seizure caused positive BOLD activation in cortical areas and thalamic nuclei similar to those of the spontaneous seizure model. One difference between the two models, however, was the negative BOLD signal decreases present throughout the cortex in the GBL model. The WAG/Rij model had diffuse positive BOLD activations in the cortex, but no significant negative BOLD changes were found. It is possible that the negative BOLD changes of the previous study were specific for the GBL drug used to induce the seizures.
Three primary causes may be responsible for the occurrence of negative BOLD: (a) the rate of oxygen consumption (CMRO2) from areas of high synaptic and neuronal activity exceeds compensatory blood flow; (b) “vascular steal” (i.e., preferential flow to the most metabolically active areas leaving the abandoned areas facing less blood flow in the presence of a constant CMRO2); and (c) a reduction in brain activity and blood flow from basal levels (48). Because negative BOLD can occur as a result of one area of the brain being activated while another is deactivated, this discrepancy might simply be due to different neural pathways and mechanisms contributing to seizure activation in the drug model versus the genetic model. This is unlikely because alterations in γ-aminobutyric acid (GABA) neurotransmission are responsible, in part, for both the GBL and genetic models of absence seizures (49,50). A more plausible explanation is the severity of the seizures. In the WAG/Rij model, absences occur a few times per hour and last <10 s. With GBL, the seizure activity is unremitting and more representative of status epilepticus. The intense synaptic and neuronal activity with enhanced CMRO2 may exceed compensatory blood flow in areas outside the corticothalamic loop that is responsible for the initiation and maintenance of the SWDs.
Patterns of positive BOLD activation in both animal models implicate the same cortical and thalamic structures in the generation and propagation of SWDs. Therefore both the GBL drug-induced and WAG/Rij spontaneous models result in fMRI activation of the same brain structures during the SWDs that characterize absence epilepsy.
Acknowledgment
This work was supported by grants from the NIMH (R01-MH58700) and NINDS (F30-NS044672), and its contents are the sole responsibility of the authors and do not represent the official views of the NIH.
REFERENCES
- 1.Panayiotopoulos CP. Typical absence seizures and their treatment. Arch Dis Child. 1999;81:351–5. doi: 10.1136/adc.81.4.351. [DOI] [PMC free article] [PubMed] [Google Scholar]
- 2.Festing MFW. Inbred strains in biomedical research. MacMillan Press; London: 1979. pp. 267–96. [Google Scholar]
- 3.van Luijtelaar ELMJ, Coenen AML. Two types of electrocortical paroxysms in an inbred strain of rats. Neurosci Lett. 1986;70:393–7. doi: 10.1016/0304-3940(86)90586-0. [DOI] [PubMed] [Google Scholar]
- 4.Coenen AML, Drinkenburg WHIM, Inoue M, et al. Genetic models of absence epilepsy, with emphasis on the WAG/Rij strain of rats. Epilepsy Res. 1992;12:75–86. doi: 10.1016/0920-1211(92)90029-s. [DOI] [PubMed] [Google Scholar]
- 5.Coenen AML, van Luijtelaar ELJM. The WAG/Rij rat model for absence epilepsy: age and sex factors. Epilepsy Res. 1987;1:297–301. doi: 10.1016/0920-1211(87)90005-2. [DOI] [PubMed] [Google Scholar]
- 6.Inoue M, Duysens J, Vossen JMH, et al. Thalamic multiple-unit activity underlying spike-wave discharges in anesthetized rats. Brain Res. 1993;612:35–40. doi: 10.1016/0006-8993(93)91641-5. [DOI] [PubMed] [Google Scholar]
- 7.Midzianovskaia IS, Kuznetsova GD, Coenen AML, et al. Electro-physiological and pharmacological characteristics of two types of spike-wave discharges in WAG/Rij rats. Brain Res. 2001;911:62–70. doi: 10.1016/s0006-8993(01)02705-6. [DOI] [PubMed] [Google Scholar]
- 8.D'Arcangelo G, D'Antuono M, Biagini G, et al. Thalamocortical oscillations in a genetic model of absence seizures. Eur J Neurosci. 2002;16:2383–93. doi: 10.1046/j.1460-9568.2002.02411.x. [DOI] [PubMed] [Google Scholar]
- 9.Meeren HKM, Pijn JPM, van Luijtelaar ELJM, et al. Cortical focus drives widespread corticothalamic networks during spontaneous absence seizures in rats. J Neurosci. 2002;22:1480–95. doi: 10.1523/JNEUROSCI.22-04-01480.2002. [DOI] [PMC free article] [PubMed] [Google Scholar]
- 10.Ogawa S, Lee TM, Nayak AS, et al. Oxygenation-sensitive contrast in magnetic resonance image of rodent brain at high magnetic fields. Magn Reson Med. 1990;14:68–78. doi: 10.1002/mrm.1910140108. [DOI] [PubMed] [Google Scholar]
- 11.Ogawa S, Tank DW, Menon R, et al. Intrinsic signal changes accompanying sensory stimulation: functional brain mapping with magnetic resonance imaging. Proc Natl Acad Sci U S A. 1992;89:5951–5. doi: 10.1073/pnas.89.13.5951. [DOI] [PMC free article] [PubMed] [Google Scholar]
- 12.Ogawa S, Menon RS, Tank DW, et al. Functional brain mapping by blood oxygenation level-dependent contrast magnetic resonance imaging. Biophys J. 1993;64:803–12. doi: 10.1016/S0006-3495(93)81441-3. [DOI] [PMC free article] [PubMed] [Google Scholar]
- 13.Kwong KK, Belliveau JW, Chesler DA, et al. Dynamic magnetic resonance imaging of human brain activity during primary sensory stimulation. Proc Natl Acad Sci U S A. 1992;89:5675–9. doi: 10.1073/pnas.89.12.5675. [DOI] [PMC free article] [PubMed] [Google Scholar]
- 14.Bandettini PA, Wong EC, Hinks RS, et al. Time course EPI of human brain function during task activation. Magn Reson Med. 1992;25:390–7. doi: 10.1002/mrm.1910250220. [DOI] [PubMed] [Google Scholar]
- 15.Logothetis NK, Pauls J, Augath M, et al. Neurophysiological investigation of the basis of the fMRI signal. Nature. 2001;412:150–7. doi: 10.1038/35084005. [DOI] [PubMed] [Google Scholar]
- 16.Dubowitz DJ, Chen D-Y, Atkinson DJ, et al. Functional magnetic resonance imaging in macaque cortex. Neuroreport. 1998;9:2213–8. doi: 10.1097/00001756-199807130-00012. [DOI] [PubMed] [Google Scholar]
- 17.Dubowitz DJ, Chen D-Y, Atkinson DJ, et al. Direct comparison of visual cortex in human and non-human primates using functional magnetic resonance imaging. J Neurosci Methods. 2001;107:71–80. doi: 10.1016/s0165-0270(01)00353-3. [DOI] [PubMed] [Google Scholar]
- 18.Ferris CF, Snowden CT, King JA, et al. Functional imaging of brain activity in conscious monkeys responding to sexually arousing cues. Neuroreport. 2001;12:2231–6. doi: 10.1097/00001756-200107200-00037. [DOI] [PubMed] [Google Scholar]
- 19.Stefanacci L, Reber P, Costanza J, et al. FMRI of monkey visual cortex. Neuron. 1998;20:1051–7. doi: 10.1016/s0896-6273(00)80485-7. [DOI] [PubMed] [Google Scholar]
- 20.Logothetis NK, Guggenberger H, Peled S, et al. Functional imaging of the monkey brain. Nat Neurosci. 1999;2:555–62. doi: 10.1038/9210. [DOI] [PubMed] [Google Scholar]
- 21.Lahti KM, Ferris CF, Li F, et al. Imaging brain activity in conscious animals using functional MRI. J Neurosci Methods. 1998;82:75–82. doi: 10.1016/s0165-0270(98)00037-5. [DOI] [PubMed] [Google Scholar]
- 22.Zhang Z, Andersen AH, Avison MJ, et al. Functional MRI of apomorphine activation of the basal ganglia in awake rhesus monkeys. Brain Res. 2000;852:290–6. doi: 10.1016/s0006-8993(99)02243-x. [DOI] [PubMed] [Google Scholar]
- 23.Zhang Z, Andersen AH, Grodin R, et al. Pharmacological MRI mapping of age-associated changes in basal ganglia circuitry of awake rhesus monkeys. Neuroimage. 2001;14:1159–67. doi: 10.1006/nimg.2001.0902. [DOI] [PubMed] [Google Scholar]
- 24.Tenney JR, Duong TQ, King JA, et al. Corticothalamic modulation during absence seizures in rats: a functional MRI assessment. Epilepsia. 2003;44:1133–40. doi: 10.1046/j.1528-1157.2003.61002.x. [DOI] [PMC free article] [PubMed] [Google Scholar]
- 25.Brevard ME, Duong TQ, King JA, et al. Changes in MRI signal intensity during hypercapnic challenge under conscious and anesthetized conditions. Magn Reson Imaging. 2003;21:995–1001. doi: 10.1016/s0730-725x(03)00204-2. [DOI] [PMC free article] [PubMed] [Google Scholar]
- 26.Sicard K, Shen Q, Brevard ME, et al. Regional cerebral blood flow and BOLD responses in conscious and anesthetized rats under basal and hypercapnic conditions: implications for functional MRI studies. J Cereb Blood Flow Metab. 2003;23:472–81. doi: 10.1097/01.WCB.0000054755.93668.20. [DOI] [PMC free article] [PubMed] [Google Scholar]
- 27.Krakow K, Woermann FG, Symms MR, et al. EEG-triggered functional MRI of interictal epileptiform activity in patients with partial seizures. Brain. 1999;122:1679–88. doi: 10.1093/brain/122.9.1679. [DOI] [PubMed] [Google Scholar]
- 28.Krakow K, Lemieux L, Messina D, et al. Spatio-temporal imaging of focal interictal epileptiform activity using EEG-triggered functional MRI. Epileptic Disord. 2001;3:67–74. [PubMed] [Google Scholar]
- 29.Krakow K, Messina D, Lemieux L, et al. Functional MRI activation of individual interictal epileptiform spikes. Neuroimage. 2001;13:502–5. doi: 10.1006/nimg.2000.0708. [DOI] [PubMed] [Google Scholar]
- 30.Archer JS, Briellmann RS, Syngeniotis A, et al. Spike-triggered fMRI in reading epilepsy: involvement of left frontal cortex working memory area. Neurology. 2003;60:415–21. doi: 10.1212/wnl.60.3.415. [DOI] [PubMed] [Google Scholar]
- 31.Archer JS, Briellman RS, Abbott DF, et al. Benign epilepsy with centrotemporal spikes: spike triggered fMRI shows somato-sensory cortex activity. Epilepsia. 2003;44:200–4. doi: 10.1046/j.1528-1157.2003.02502.x. [DOI] [PubMed] [Google Scholar]
- 32.Warach S, Ives JR, Sclaug G, et al. EEG-triggered echo-planar functional MRI in epilepsy. Neurology. 1996;47:89–93. doi: 10.1212/wnl.47.1.89. [DOI] [PubMed] [Google Scholar]
- 33.Seeck M, Lazeyras F, Michel CM, et al. Non-invasive epileptic focus localization using EEG-triggered functional MRI and electromagnetic tomography. Electroencephalogr Clin Neurophysiol. 1998;106:508–12. doi: 10.1016/s0013-4694(98)00017-0. [DOI] [PubMed] [Google Scholar]
- 34.Patel MR, Blum A, Pearlman JD, et al. Echo-planar functional MR imaging of epilepsy with concurrent EEG monitoring. AJNR Am J Neuroradiol. 1999;20:1916–9. [PMC free article] [PubMed] [Google Scholar]
- 35.Symms MR, Allen PJ, Woermann FG, et al. Reproducible localization of interictal epileptiform discharges using EEG-triggered fMRI. Phys Med Biol. 1999;44:N161–8. doi: 10.1088/0031-9155/44/7/403. [DOI] [PubMed] [Google Scholar]
- 36.Rosen BR, Buckner RL, Dale AM. Event-related functional MRI: past, present, and future. Proc Natl Acad Sci U S A. 1998;95:773–80. doi: 10.1073/pnas.95.3.773. [DOI] [PMC free article] [PubMed] [Google Scholar]
- 37.King JA, Brevard ME, Messenger TL, et al. Evaluation of acclimation of conscious rats for magnetic resonance imaging studies. Behav Brain Res. 2003 submitted. [Google Scholar]
- 38.Ives JR, Warach S, Schmitt F, et al. Monitoring the patient's EEG during echo planar MRI. Electroencephalogr Clin Neurophysiol. 1993;87:417–20. doi: 10.1016/0013-4694(93)90156-p. [DOI] [PubMed] [Google Scholar]
- 39.Paxinos G, Watson C. The rat brain in stereotaxic coordinates. Academic Press; San Diego: 1998. [DOI] [PubMed] [Google Scholar]
- 40.Strupp JP. Stimulate: a GUI based fMRI analysis software package. Neuroimage. 1996;3:S607. [Google Scholar]
- 41.Vergnes M, Marescaux C. Cortical and thalamic lesions in rats with genetic absence epilepsy. J Neural Transm. 1992;35:71–83. doi: 10.1007/978-3-7091-9206-1_5. [DOI] [PubMed] [Google Scholar]
- 42.Seidenbecher T, Staak R, Pape HC. Relations between cortical and thalamic cellular activities during absence seizures in rats. Eur J Neurosci. 1998;10:1103–12. doi: 10.1046/j.1460-9568.1998.00123.x. [DOI] [PubMed] [Google Scholar]
- 43.Slaght SJ, Leresche N, Deniau JM, et al. Activity of thalamic reticular neurons during spontaneous genetically determined spike and wave discharges. J Neurosci. 2002;22:2323–34. doi: 10.1523/JNEUROSCI.22-06-02323.2002. [DOI] [PMC free article] [PubMed] [Google Scholar]
- 44.Vergnes M, Marescaux C, Depaulis A, et al. Spontaneous spike and wave discharges in thalamus and cortex in a rat model of genetic petit mal-like seizures. Exp Neurol. 1987;96:127–36. doi: 10.1016/0014-4886(87)90174-9. [DOI] [PubMed] [Google Scholar]
- 45.Vergnes M, Marescaux C, Depaulis A. Mapping of spontaneous spike and wave discharges in Wistar rats with genetic generalized non-convulsive epilepsy. Brain Res. 1990;523:87–91. doi: 10.1016/0006-8993(90)91638-w. [DOI] [PubMed] [Google Scholar]
- 46.Nehlig A, Vergnes M, Marescaux C, et al. Mapping of cerebral energy metabolism in rats with genetic generalized nonconvulsive epilepsy. J Neural Transm. 1992;35:141–53. doi: 10.1007/978-3-7091-9206-1_10. [DOI] [PubMed] [Google Scholar]
- 47.Blumenfeld H. From molecules to networks: cortical/subcortical interactions in the pathophysiology of idiopathic generalized epilepsy. Epilepsia. 2003;44:7–15. doi: 10.1046/j.1528-1157.44.s.2.2.x. [DOI] [PubMed] [Google Scholar]
- 48.Shmuel A, Yacoub E, Pfeuffer J, et al. Sustained negative BOLD, blood flow and oxygen consumption response and its coupling to the positive response in the human brain. Neuron. 2002;36:1195–210. doi: 10.1016/s0896-6273(02)01061-9. [DOI] [PubMed] [Google Scholar]
- 49.Hu RQ, Banerjee PK, Snead OC. Regulation of γ-aminobutyric acid (GABA) release in cerebral cortex in the γ-hydroxybutyric acid (GHB) model of absence seizures in rat. Neuropharmacology. 2000;39:427–39. doi: 10.1016/s0028-3908(99)00152-5. [DOI] [PubMed] [Google Scholar]
- 50.Coenen AML, van Luijtelaar ELJM. Genetic animal models for absence epilepsy: a review of the WAG/Rij strain of rats. Behav Genet. 2003;33:635–55. doi: 10.1023/a:1026179013847. [DOI] [PubMed] [Google Scholar]