

Abstract
Rationale
Physiological changes (such as heart rate and respiration rate) associated with strong pharmacological stimuli could change the blood-oxygenation-level-dependent (BOLD) functional magnetic resonance imaging (fMRI) mapping signals, independent of neural activity.
Objectives
This study investigates whether the physiological changes per se associated with systemic cocaine administration (1 mg/kg) contaminate the BOLD fMRI signals by measuring BOLD and cerebral blood flow (CBF) fMRI and estimating the cerebral metabolic rate of oxygen (CMRO2) changes.
Materials and methods
BOLD and CBF fMRI was performed, and changes in CMRO2 were estimated using the BOLD biophysical model.
Results
After systemic cocaine administration, blood pressure, heart rate, and respiration rate increased, fMRI signals remained elevated after physiological parameters had returned to baseline. Cocaine induced changes in the BOLD signal within regions of the reward pathway that were heterogeneous and ranged from −1.2 to 5.4%, and negative changes in BOLD were observed along the cortical surface. Changes in CBF and estimated CMRO2 were heterogeneous and positive throughout the brain, ranging from 14 to 150% and 10 to 55%, respectively.
Conclusions
This study demonstrates a valuable tool to investigate the physiological and biophysical basis of drug action on the central nervous system, offering the means to distinguish the physiological from neural sources of the BOLD fMRI signal.
Keywords: Multimodal imaging, CMRO2, BOLD, CBF, Pharmacological fMRI, Biophysical model, Arterial spin labeling, Hypercapnic calibration
Introduction
Cocaine is a psychostimulant that is frequently abused and has reinforcing characteristics that can establish a state of addiction characterized by motivated, drug-seeking behavior and by a loss of the ability to control use (American Psychiatric Association 1994; Nestler et al. 2001). Cocaine mediated activation of the mesolimbic dopamine system has been observed using a variety of techniques (Marota et al. 2000; Porrino et al. 1988; Stein and Fuller 1992), and these and other studies have illustrated the complexity of the brain’s response to cocaine, whereby activation occurs in many brain regions beyond the limits of the dopaminergic reward pathway (Bardo 1998; Kelley 2004; Nestler 2002). Consequently, the successful development of therapies to treat cocaine addiction may require detailed information about the changes that cocaine induces in the activity of other large-scale neural networks within the brain (O’Brien 2003), and the acquisition of this information may be facilitated by experimental techniques that are able to observe changes in neural activity in vivo after systemic cocaine challenge.
Functional magnetic resonance imaging (fMRI) is a powerful and noninvasive technique to map brain functions ranging from perception to cognition at higher spatial and temporal resolution than alternative techniques, such as positron emission tomography (PET). Traditional fMRI experiments infer changes in neural activity from changes in surrogate signals such as blood-oxygen-level-dependent (BOLD) contrast, cerebral blood flow (CBF), and cerebral blood volume (CBV). While studies based on changes in BOLD contrast comprise the majority of published fMRI research, the relationship of BOLD contrast to neural activation entails a complex interaction between changing regional metabolic demands and compensatory responses by the cerebral vasculature. The interpretation of BOLD signals may not be straightforwardly associated with stimuli that cause significant physiological changes because these stimuli may cause fMRI signal changes that are independent of changes in neural activity.
Changes in BOLD contrast arise from changes in the venous concentration of deoxyhemoglobin and from changes in CBV (Boxerman et al. 1995; Ogawa et al. 1993). While fully oxygenated hemoglobin is diamagnetic, deoxygenated hemoglobin is paramagnetic, and its presence creates microscopic distortions in the magnetic field surrounding erythrocytes. The interaction of water molecules with these field distortions causes a change in the transverse relaxation rate of the blood that is dependent on deoxyhemoglobin concentration and that can be detected by MRI (Thulborn et al. 1982). Increased neural activity leads to a cascade of events that include increased in metabolic by-products and blood flow regulating factors (such as CO2 and NO) that lead to vasodilation, causing a regional increase in CBF. Interestingly, this increase in blood flow overcompensates for the increased oxygen metabolic demand, reducing the deoxyhemoglobin concentration which can be observed as increased BOLD signal.
The use of fMRI to investigate cocaine’s effects on neural circuitry in humans and in animal models have been reported (Breiter et al. 1997; Honey and Bullmore 2004; Luo et al. 2003; Mandeville et al. 2001; Stein 2001). Systemic administration of cocaine and other pharmacological agents can cause significant changes in cardiovascular physiology (heart rate, respiration rate, and blood pressure) (Pitts et al. 1987) and changes in vascular tone, potentially modulating the fMRI signals independent of changes in neuronal activity and complicating the interpretation of BOLD fMRI data (Gollub et al. 1998; Kaufman et al. 2001; Marota et al. 2000; Stein 2001).
In addition to conventional BOLD fMRI, changes in cerebral metabolic rate of oxygen (CMRO2) could also be estimated to serve as a metabolic marker for changes in neural activity (Hyder 2004). Stimulus-evoked CMRO2 changes can be estimated from BOLD and CBF measurements using a biophysical model of the BOLD signal and a calibration experiment (Davis et al. 1998; Hoge et al. 1999a; Kim et al. 1999; Ogawa et al. 1993). A brief and mild hypercapnic challenge (~5% CO2 over a few minutes) does not alter neural metabolism but does modulate CBF and BOLD contrast (Hafkenshiel and Friedland 1952; Kety and Schmidt 1948), revealing the regionally specific coupling of changes in CBF to changes in BOLD under isometabolic conditions. The proportionality constant M relating BOLD and CBF changes reflects the maximum BOLD response that can be expected from a given region. Combining the parameter M with measured changes in CBF and BOLD contrast after a functional stimulation, CMRO2 change can be calculated. This noninvasive technique has been used to map CMRO2 changes after sensory stimulations in both humans (Davis et al. 1998; Hoge et al. 1999a; Kim et al. 1999; Ogawa et al. 1993) and in animal models (Liu et al. 2004; Mandeville et al. 1999).
The goal of this study was to apply the CMRO2 fMRI technique to investigate the potential physiological effects of cocaine on the hemodynamic (CBF and BOLD) signals and to study the coupling among BOLD, CBF, and CMRO2 changes for brain regions involved in the reward pathway. CMRO2 fMRI requires multiple measurements that include BOLD, CBF, or CBV associated with the stimulus and associated with a hypercapnic calibration. This may not be feasible for experiments in which stimuli cannot be repeatedly administered. In this study, we overcame this limitation by using the two-coil arterial spin labeling technique to simultaneously measure BOLD and CBF (Duong et al. 2000a; Silva et al. 1999), making it possible to perform CMRO2 fMRI of a single cocaine administration in the same subject and the same setting.
Materials and methods
Animal preparation
Eleven cocaine naïve male Sprague–Dawley rats (300–375 g) were studied. The left femoral vein and artery were catheterized to administer cocaine and monitor physiology, respectively. Rats were anesthetized with 2.5% gaseous isoflurane (Phoenix Pharmaceutical, St. Joseph, MO) during surgery and immobilized in an MRI-compatible stereotaxic headset. The isoflurane level was reduced to 1.1% during imaging experiments, and rats breathed spontaneously without mechanical ventilation at all times. Mean arterial blood pressure (MABP), heart rate (HR), and respiration rate (RR) were measured continuously using a Biopak Systems data acquisition system (Santa Barbara, CA). HR and RR were derived from high and low frequency oscillations of the MABP signal, respectively. Before cocaine administration, hypercapnic (5% CO2) challenge experiments were performed for derivation of the calibration parameter (M) map (Davis et al. 1998). During cocaine challenge experiments, a 1.0-mg/kg cocaine dose (1.0 ml/kg injection volume) was administered intravenously via the femoral vein over a period of approximately 10 s.
MRI experiments
Combined CBF and BOLD measurements were made on a 4.7 T/40 cm magnet (Oxford, UK), Bruker Biospec console (Bruker BioSpin, Billerica, MA), and a 20-G/cm gradient insert of 12 cm inner diameter (ID) capable of 120-μs rise time. An actively decoupled 2.3-cm ID surface coil was used for brain imaging and a neck coil for perfusion labeling as previously described (Duong et al. 2000b; Liu et al. 2004; Silva et al. 1999). Images were acquired using the continuous arterial spin-labeling technique with a single-shot, gradient echo, echo-planar-imaging sequence, and continuous arterial spin labeling was accomplished with a 1.7-s square radio frequency pulse to the labeling coil in the presence of 1.0-G/cm gradient along the direction of blood flow in the carotid arteries, satisfying the adiabatic inversion condition. The sign of the frequency offset was reversed during acquisition of non-labeled images. MRI parameters were: data matrix=64×64, field of view (FOV)=2.3 cm×2.3 cm, eight 1.5-mm thick slices, TE=15 ms, and TR=2 s. During the calibration experiments, 30 pairs of images (2 min) were acquired during baseline and 60 pairs during the hypercapnic challenge. During the cocaine challenge experiments, after a stabilization period of 15 min after the termination of the hypercapnic calibration experiment, 50 pairs of images (3.3 min) were acquired during baseline, and an additional 160 pairs were acquired after cocaine administration (11.7 min). High-resolution anatomical images (128×128, RARE) were acquired for co-registration of images with an atlas.
Data analysis
Data were analyzed using custom software developed in the Java programming language (Sun Microsystems). A BOLD image time series was derived from the non-labeled data set of CBF measurements, and a CBF image time series was generated by calculating CBF values pixel-by-pixel for each image (Silva et. al. 1999). BOLD and CBF time series data were analyzed pixel by pixel using a generalized linear model (GLM) approach (Worsley and Friston 1995) with a single-step box-car model for both the hypercapnic challenge and cocaine challenge data sets. P values corresponding to zero correlation were obtained for each pixel and used as thresholds. Percent change maps of BOLD and CBF for the hypercapnic challenge and cocaine challenge experiments were created using only pixels with P values below 0.01, with all other pixels set to 0 to reduce artifacts in maps calculated subsequently. The data illustrated in Fig. 2 were produced from one subject by normalizing each BOLD and CBF repetition with an average of 40 baseline repetitions, and ΔCMRO2 were calculated independently for each repetition.
Fig. 2.

Time dependent changes in BOLD, CBF, and CMRO2 for a single subject. Time dependent changes measured for two regions of interest are shown: black lines represent primary somatosensory cortex (S1) and red lines represent nucleus accumbens (Nac). The dashed black line represents the single step model used for analysis
A biophysical model for calculating relative CMRO2 changes and strategy for calibration using mild hypercapnia (Davis et al. 1998; Hoge et al. 1999a) were used to calculate M maps and CMRO2 percent change maps. M maps were calculated from the hypercapnic challenge BOLD and CBF percent change maps according to Eq. 1, where the subscripts H%chg and %chg designate percent change values obtained during the hypercapnic and cocaine challenge experiments, respectively. The exponents a and β have values 0.38 (Ueki et al. 1988) and 1.5 (Madsen et al. 1998), respectively, and pixels containing physiologically meaningless M values (imaginary values, negative values, and infinite values) were identified and excluded from subsequent map and ROI calculations.
| (1) |
CMRO2 percent change maps were calculated according to Eq. 2, where subscripts indicate percent change maps obtained during the cocaine challenge experiment. A single, group average M map (N=9) was created for use in Eq. 2.
| (2) |
Each slice of the maps and anatomical images from each subject were manually co-registered to an atlas (Paxinos and Watson 1998) using custom software and the following degrees of freedom: x and y translation, independent x and y scale, and rotation about the z axis. The original images were then resampled in the transformation to the atlas coordinate system, and a new set of images was created. Regions of interest (ROIs) were defined and used to measure average values from the ΔCBF, ΔBOLD, ΔCMRO2, and M maps of each subject. ROI analysis was performed on the periaqueductal gray (PAG), substantia nigra (SN), ventral tegmental area (VTA), hippocampus (HIP), primary somatosensory cortex (S1), ventral posterolateral thalamic nucleus (VPL), lateral globus pallidus (LGP), cingulate cortex (CG), nucleus accumbens (NAC), and striatum. Co-registered maps of all subjects were averaged together for visualization.
Results
After cocaine administration, MABP increased from a baseline of 113±14 mmHg (mean±standard deviation) to 137±33 mmHg (P<0.05) during injection and remain elevated at 119±15 mmHg for 1 to 2 min after injection (P<0.05). Respiration rate increased from a baseline of 81±7 to 89±8 bpm (P<0.05) during injection and further increased to 103±16 bpm (P<0.05) 1 to 2 min after injection. Heart rate dipped slightly from a baseline of 405±49 to 394±39 bpm (P=0.13) during injection and increased slightly to 419±42 bpm (P<0.05) 1 to 2 min after injection. All parameters returned to baseline levels within 5 min after cocaine administration.
Figure 1 illustrates the changes in BOLD, CBF, and CMRO2 after systemic cocaine challenge. Maps were co-registered, averaged together, overlaid on anatomical images, and areas outside the brain were masked. The parameter M varied between 0.08 and 0.17 across the regions investigated, consistent with results from a previous study obtained under similar experimental conditions (Liu et al. 2004). M was appreciably higher in the vicinity of large draining veins, consistent with previous observations in humans (Davis et al. 1998) and in rats (Liu et al. 2004). The spatial distribution of the parameter M did not vary significantly between subjects, hence, an average M map was calculated for nine subjects (Fig. 1: panel M, Table 1) and the ΔCMRO2 maps for each animal were calculated using this average M map.
Fig. 1.
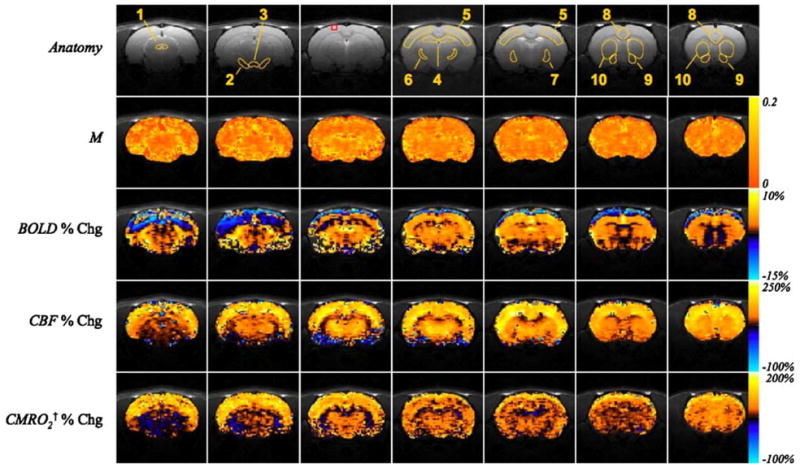
The average calibration parameter M and average changes in BOLD, CBF, and estimated CMRO2 in the anesthetized rat brain after intravenous administration of 1.0-mg/kg cocaine (N = 11). Orange and blue color scales at right of panels represent positive and negative changes, respectively, between the baseline period and the period following the cocaine challenge, except in the visualization of the M map (N = 9) where the orange scale shown at the right represents positive values only. The ranges of the color scales for each map are indicated. ROIs outlined in the anatomy images are: 1—periaqueductal gray (PAG); 2—substantia nigra (SN); 3—ventral tegmental area (VTA); 4—hippocampus (HIP); 5—primary somato-sensory cortex (S1); 6—ventral posterolateral thalamic nucleus (VPL); 7—lateral globus pallidus (LGP); 8—cingulate cortex (CG); 9—nucleus accumbens (NAC); 10—striatum. The red box illustrates a cortical ROI exhibiting negative BOLD and positive CBF and CMRO2 changes that is quantified in Table 1. †ΔCMRO2 maps were calculated using the average M map from nine subjects
Table 1.
Quantitative changes in BOLD, CBF, estimated CMRO2 and the parameter M in various regions of interest after intravenous administration of 1.0-mg/kg cocaine
| MN=9 | Δ BOLDN=11 | Δ CBFN=11 | |||
|---|---|---|---|---|---|
| PAG | 0.05±0.005 | 0.1±0.2* | 16±1 | 10±3 | |
| SN | 0.17±0.01 | 5.4±1.0 | 25±5 | 12±3 | |
| VTA | 0.16±0.02 | −1.2±0.5 | 14±3 | 14±3 | |
| Hip | 0.11±0.005 | 1.5±0.2 | 52±4 | 24±3 | |
| S1 | 0.12±0.01 | 3.7±0.2 | 80±6 | 46±4 | |
| VPL | 0.11±0.01 | 2.5±0.2 | 80±6 | 24±4 | |
| LGP | 0.08±0.01 | 1.4±0.1 | 49±3 | 17±2 | |
| CG | 0.18±0.01 | 3.6±0.4 | 128±9 | 55±5 | |
| NAc | 0.09±0.01 | 0.6±0.2* | 64±7 | 34±5 | |
| Striatum | 0.11±0.01 | 1.6±0.2 | 80±6 | 33±3 | |
| Cortical ROI | 0.15±0.04 | −10.1±6.9* | 123±25 | 187±46 |
(Mean±SEM, N=11 for BOLD, CBF, CMRO2 and N = 9 for M). All changes are significant with respect to baseline (P< 0.01) except where noted by (*)
Percent change maps calculated using a single M map combined from 9 subjects
P>0.01
PAG Periaqueductal gray, SN substantia nigra, VTA ventral tegmental area HIP hippocampus, S1 primary somatosensory cortex, VPL ventral posterolateral thalamic nucleus, LGP lateral globus pallidus, CG cingulate cortex, NAC nucleus accumbens
The BOLD signal increased in cortical, extrapyramidal, and midbrain regions after cocaine challenge (Fig. 1: panel ΔBOLD). Negative changes in BOLD after cocaine administration appeared in the striatum and CA1 and CA2 fields of the caudal hippocampus, and negative BOLD was observed on the cortical surface. In contrast, CBF consistently increased after cocaine administration across all studied regions of the brain (Fig. 1: panel ΔCBF). BOLD, CBF, and CMRO2 of different brain structures analyzed are summarized in Table 1. S1 and CG exhibited larger increases than midbrain nuclei, and only a moderate increase was observed in the hippocampus. Modest, but significant increases in CBF within the VTA and SN must be interpreted cautiously because of low signal to noise, susceptibility artifacts, and partial volume effects in these regions. Changes in CMRO2 after cocaine administration were positive in all regions of the brain studied, ranging from 17 to 38% (Table 1 and Fig. 1: panel ΔCMRO2). In cortical regions exhibiting decreases in BOLD, increases were observed in CBF and ΔCMRO2 suggesting that the negative BOLD signal change within these cortical areas is not the result of image or motion artifacts (Table 1: Cortical ROI). The time courses of BOLD, CBF, and CMRO2 for a representative subject (Fig. 2) illustrate the rapid and sustained increases in BOLD and CBF within S1, while increases in BOLD and CBF were considerably smaller within the NAc.
The parameter M is a proportionality constant that describes the changes in BOLD with changes in CBF. Iso-contour lines in Fig. 3a illustrate the expected changes in BOLD and CBF for given changes in CMRO2 within a region having an M value of 0.10 and illustrate that negative changes in BOLD may be observed in regions experiencing dramatically increased oxidative metabolism, potentially leading to erroneous inferences made from BOLD measurements alone. Data points in Fig. 3a indicate the observed changes in BOLD and CBF within regions with M values equal to 0.1 ± 0.02. CMRO2 increased within these and all other regions investigated. Changes in CBF and CMRO2 were linearly coupled by a ratio of approximately 2.8:1 (Pearson’s r=0.92) (Fig. 3b), and BOLD and CMRO2 were also roughly linearly correlated (r=0.79) (Fig. 3c). Two regions, the VTA and PAG, exhibited a negative and near-zero BOLD response but showed a significant increase in CBF, corresponding to an increase in CMRO2 (Fig. 3c). One region, the SN, deviated significantly from the correlative relationship observed between changes in BOLD, CBF, and CMRO2 exhibited by the other regions investigated, and the large increase in BOLD could be an artifact.
Fig. 3.

Relationship among CBF, BOLD, and CMRO2 changes following intravenous administration of 1-mg/kg cocaine obtained for different brain regions. (Mean±SEM, N=11). a CBF and BOLD changes for the regions of similar M value (Hip, S1, VPL, LGP, NAc, and striatum). Iso-contour lines indicate the expected coupling of changes in CBF and changes in BOLD under conditions of increased or decreased CMRO2 (M=0.10). b, c Changes in CMRO2 as a function of CBF and BOLD changes. Lines indicate the least square linear regressions for data points which are indicated by closed circles, (Pearson’s r: b: 0.92, c: 0.79). The substantia nigra (open circle) was excluded from the regression analysis in b and c
Discussion
This study demonstrates BOLD, CBF, and CMRO2 functional MRI after intravenous cocaine administration in the anesthetized rat with concomitant physiological measurements (MABP, HR, and RR). Cocaine evoked significant and heterogeneous changes in BOLD, CBF, and CMRO2 within the mesocortical limbic pathway and throughout other regions of the brain. With the exception of negative BOLD changes in some cortical surface areas and within the VTA, BOLD, CBF, and CMRO2, changes were positive. Brain regions exhibiting increases in CMRO2 are consistent with regions identified as having increased metabolism of glucose in 2-deoxyglucose autoradiography studies reported previously (Porrino et al. 1988), and the changes in CBF that were observed are consistent with previously reported results.
BOLD fMRI of cocaine using similar doses has been previously reported in rats (Chen et al. 2001; Luo et al. 2003; Mandeville et al. 2001), although the magnitude and sign of the BOLD responses varied between labs. Negative BOLD near the surface of the cortex (but not in the subcortical structures) associated with cocaine challenge was consistently observed in this study. Such negative BOLD could be due to a marked cocaine-evoked increase in deoxyhemoglobin concentration in the large draining veins on the cortical surface (Krings et al. 1999) particularly at high field strength. Spin-echo BOLD experiments which yield contrast that is less sensitive to macrovascular contributions than the gradient-echo acquisitions used herein may provide insights into the origin of this negative BOLD signal, and may suppress macro-vascular BOLD changes overestimating CMRO2 change (Table 1).
While others have reported scattered negative BOLD responses throughout the brain (Luo et al. 2003), our previous forepaw stimulation studies under identical experimental conditions (Liu et al. 2004) did not show negative BOLD changes on the cortical surface. This suggests that the negative BOLD effect observed in this study is biological in origin and related to the effects of systemic cocaine challenge. Mandeville et al. 2001 did not observe significant negative BOLD changes at 2 T. These differences may be due to differences in experimental conditions (e.g., anesthetics and ventilation protocols) and possibly due to magnetic field dependent effects. Anesthesia, in particular, has been shown to impact the measured BOLD signal (Sicard et al. 2003). In addition, variations between labs may suggest that BOLD fMRI is more susceptible to nonneural physiological modulations and the precise experimental conditions of pharmacological studies, relative to sensory stimulation. For example, BOLD signal change is strongly dependent on baseline CBF and blood oxygenation (Sicard et al. 2003; Uludag et al. 2004). Vasoconstriction after cocaine administration (Kaufman et al. 2001; Luo et al. 2003) has been shown to cause negative changes in BOLD and CBF (Gollub et al. 1998); although this is difficult to reconcile with our and with others’ measurements of increases in CBF or CBV after a cocaine challenge, vasoconstriction is consistent with cocaine’s action as a sympathomimetic.
In contrast to the BOLD data, CBF increases after cocaine administration were reasonably consistent across different labs, despite differences in experimental conditions, anesthetics, and measurement techniques. Positive CBF increases were observed throughout the brain and were particularly pronounced in the neocortices. Our results are in good agreement with Stein and Fuller (1992) who reported CBF increases as measured by using [14C]iodoantipyrene in awake rats after intravenous cocaine administration. Our estimated CBV changes obtained from CBF and the Grubb et. al.’s relation (Grubb et al. 1974) in the cingulate gyrus (CG), nucleus accumbens (NAc), motor cortex (S1), dorsal thalamus (VPL), and striatum are linearly correlated (r=0.96) with the CBV changes obtained with MION contrast agent (Marota et al. 2000), although our overall CBV changes were slightly larger (data not shown).
Non-invasive CMRO2 fMRI offers a valuable surrogate measure of neural activation. Increased neural activity has been shown to be correlated with an increased rate of glucose metabolism (CMRGlu) (Kennedy et al. 1976; Sokoloff et al. 1977) and CBF (Jones et al. 2004), however, the magnitude of stimulus-evoked changes in CMRO2 remains controversial. Following Fox and Raichle’s initial study using PET (Fox et al. 1988), stimulus-evoked CMRO2 changes have been reported to be negligible (Fox et al. 1988; Madsen et al. 1998), smaller than the CBF and CMRGlu increases (Davis et al. 1998; Hoge et al. 1999b; Kim et al. 1999; Mandeville et al. 1999), or increased by 200–400% (Hyder et al. 1996). A recent study suggests that neural metabolism during stimulation is primarily oxidative (Kasischke et al. 2004). Although CMRO2 changes associated with cocaine administration have not been reported previously for comparison, the magnitudes of CMRO2 changes reported in this study were consistent with those reported using various sensory stimuli.
Future experiments using micro-PET imaging may provide a valuable basis for comparison of ΔCMRO2 in small animals after sensory stimulation or pharmacological challenge. Nonetheless, a few studies have demonstrated the consistency of MRI-based ΔCMRO2 over a wide range of experimental conditions (Sicard et al. 2003; Uludag et al. 2004). The mean ΔCMRO2 values are not skewed by noise (although the uncertainties increase) due to the self-correcting nature of the ΔCMRO2 formalism (Davis et al. 1998; Liu et al. 2004). Finally, the use of a two-coil configuration yielded a relatively high signal to noise ratio of the CBF signal, and the use of simultaneous measurements of BOLD and CBF avoided variations that could be present if the two measurements were made in a sequential manner. This approach makes it possible to perform BOLD and CBF measurements and estimate CMRO2 changes after cocaine administration in a single setting, within the same animal.
Conclusions
This study demonstrates for the first time CMRO2 fMRI of cocaine and to study the potential physiological perturbations caused by systemic cocaine challenge on the hemodynamic (BOLD and CBF) fMRI signals. Multimodal fMRI measurements provide complementary surrogate assays of neural activation that facilitate the identification of image artifacts and corroborate inferences of neural activity. The approach herein presents a valuable tool to study the physiological and biophysical basis of drug actions on the central nervous system and offers the means to discriminate the physiological from neural effects of drugs on the fMRI signals. This approach could have many other applications, such as fMRI of acute stroke and its dynamic evolution, where ischemia-induced physiological perturbation is expected to alter the cerebral hemodynamics independently of changes in neural activity.
Acknowledgments
This work was supported in part by research grants from the National Institute of Neurological Disorders and Stroke (NINDS, R01 NS045879), the American Heart Association (SDG 0430020N), and the National Institute on Drug Abuse (NIDA, R01DA13517). All experiments were performed in accordance with guidelines for the care and use of mammals in neuroscience and behavioral research (National Research Council 2003) and in compliance with the laws of the United States.
Contributor Information
Karl F. Schmidt, Center for Comparative Neuroimaging, University of Massachusetts, Worcester, MA, USA
Marcelo Febo, Center for Comparative Neuroimaging, University of Massachusetts, Worcester, MA, USA.
Qiang Shen, Yerkes Imaging Center, Emory University, 954 Gatewood Road, Atlanta, GA 30329, USA, Tel.: +1-404-727-9991, Fax: +1-404-712-9917.
Feng Luo, Center for Comparative Neuroimaging, University of Massachusetts, Worcester, MA, USA.
Kenneth M. Sicard, Center for Comparative Neuroimaging, University of Massachusetts, Worcester, MA, USA
Craig F. Ferris, Center for Comparative Neuroimaging, University of Massachusetts, Worcester, MA, USA
Elliot A. Stein, Neuroimaging Research Branch, National Institute on Drug Abuse, National Institutes of Health, Baltimore, MD, USA
Timothy Q. Duong, Email: tduong@emory.edu, Yerkes Imaging Center, Emory University, 954 Gatewood Road, Atlanta, GA 30329, USA, Tel.: +1-404-727-9991, Fax: +1-404-712-9917
References
- American Psychiatric Association. Diagnostic and statistical manual of mental disorders: DSM-IV. 4. American Psychiatric Association; Washington, District of Columbia: 1994. [Google Scholar]
- Bardo MT. Neuropharmacological mechanisms of drug reward: beyond dopamine in the nucleus accumbens. Crit Rev Neurobiol. 1998;12:37–67. doi: 10.1615/critrevneurobiol.v12.i1-2.30. [DOI] [PubMed] [Google Scholar]
- Boxerman JL, Bandettini PA, Kwong KK, Baker JR, Davis TL, Rosen BR, Weisskoff RM. The intravascular contribution to fMRI signal change: Monte Carlo modeling and diffusion-weighted studies in vivo. Magn Reson Med. 1995;34:4–10. doi: 10.1002/mrm.1910340103. [DOI] [PubMed] [Google Scholar]
- Breiter HC, Gollub RL, Weisskoff RM, Kennedy DN, Makris N, Berke JD, Goodman JM, Kantor HL, Gastfriend DR, Riorden JP, Mathew RT, Rosen BR, Hyman SE. Acute effects of cocaine on human brain activity and emotion. Neuron. 1997;19:591–611. doi: 10.1016/s0896-6273(00)80374-8. [DOI] [PubMed] [Google Scholar]
- Chen YC, Mandeville JB, Nguyen TV, Talele A, Cavagna F, Jenkins BG. Improved mapping of pharmacologically induced neuronal activation using the IRON technique with super-paramagnetic blood pool agents. J Magn Reson Imaging. 2001;14:517–524. doi: 10.1002/jmri.1215. [DOI] [PubMed] [Google Scholar]
- Davis TL, Kwong KK, Weisskoff RM, Rosen BR. Calibrated functional MRI: mapping the dynamics of oxidative metabolism. Proc Natl Acad Sci USA. 1998;95:1834–1839. doi: 10.1073/pnas.95.4.1834. [DOI] [PMC free article] [PubMed] [Google Scholar]
- Duong TQ, Kim DS, Ugurbil K, Kim SG. Spatiotemporal dynamics of the BOLD fMRI signals: toward mapping submillimeter cortical columns using the early negative response. Magn Reson Med. 2000a;44:231–242. doi: 10.1002/1522-2594(200008)44:2<231::aid-mrm10>3.0.co;2-t. [DOI] [PubMed] [Google Scholar]
- Duong TQ, Silva AC, Lee SP, Kim SG. Functional MRI of calcium-dependent synaptic activity: cross correlation with CBF and BOLD measurements. Magn Reson Med. 2000b;43:383–392. doi: 10.1002/(sici)1522-2594(200003)43:3<383::aid-mrm10>3.0.co;2-q. [DOI] [PubMed] [Google Scholar]
- Fox PT, Raichle ME, Mintun MA, Dence C. Nonoxidative glucose consumption during focal physiologic neural activity. Science. 1988;241:462–464. doi: 10.1126/science.3260686. [DOI] [PubMed] [Google Scholar]
- Gollub RL, Breiter HC, Kantor H, Kennedy D, Gastfriend D, Mathew RT, Makris N, Guimaraes A, Riorden J, Campbell T, Foley M, Hyman SE, Rosen B, Weisskoff R. Cocaine decreases cortical cerebral blood flow but does not obscure regional activation in functional magnetic resonance imaging in human subjects. J Cereb Blood Flow Metab. 1998;18:724–734. doi: 10.1097/00004647-199807000-00003. [DOI] [PubMed] [Google Scholar]
- Grubb RL, Jr, Raichle ME, Eichling JO, Ter-Pogossian MM. The effects of changes in PaCO2 on cerebral blood volume, blood flow, and vascular mean transit time. Stroke. 1974;5:630–639. doi: 10.1161/01.str.5.5.630. [DOI] [PubMed] [Google Scholar]
- Hafkenshiel J, Friedland C. Physiology of the cerebral circulation in essential hypertension: The effects of 5% carbon dioxide mixtures on cerebral hemodynamics and oxygen metabolism. J Pharmacol Exp Ther. 1952;34:391–392. [Google Scholar]
- Hoge RD, Atkinson J, Gill B, Crelier GR, Marrett S, Pike GB. Investigation of BOLD signal dependence on cerebral blood flow and oxygen consumption: the deoxyhemoglobin dilution model. Magn Reson Med. 1999a;42:849–863. doi: 10.1002/(sici)1522-2594(199911)42:5<849::aid-mrm4>3.0.co;2-z. [DOI] [PubMed] [Google Scholar]
- Hoge RD, Atkinson J, Gill B, Crelier GR, Marrett S, Pike GB. Linear coupling between cerebral blood flow and oxygen consumption in activated human cortex. Proc Natl Acad Sci USA. 1999b;96:9403–9408. doi: 10.1073/pnas.96.16.9403. [DOI] [PMC free article] [PubMed] [Google Scholar]
- Honey G, Bullmore E. Human pharmacological MRI. Trends Pharmacol Sci. 2004;25:366–374. doi: 10.1016/j.tips.2004.05.009. [DOI] [PubMed] [Google Scholar]
- Hyder F. Neuroimaging with calibrated FMRI. Stroke. 2004;35:2635–2641. doi: 10.1161/01.STR.0000143324.31408.db. [DOI] [PubMed] [Google Scholar]
- Hyder F, Chase JR, Behar KL, Mason GF, Siddeek M, Rothman DL, Shulman RG. Increased tricarboxylic acid cycle flux in rat brain during forepaw stimulation detected with 1H[13C] NMR. Proc Natl Acad Sci USA. 1996;93:7612–7617. doi: 10.1073/pnas.93.15.7612. [DOI] [PMC free article] [PubMed] [Google Scholar]
- Jones M, Hewson-Stoate N, Martindale J, Redgrave P, Mayhew J. Nonlinear coupling of neural activity and CBF in rodent barrel cortex. Neurolmage. 2004;22:956–965. doi: 10.1016/j.neuroimage.2004.02.007. [DOI] [PubMed] [Google Scholar]
- Kasischke KA, Vishwasrao HD, Fisher PJ, Zipfel WR, Webb WW. Neural activity triggers neuronal oxidative metabolism followed by astrocytic glycolysis. Science. 2004;305:99–103. doi: 10.1126/science.1096485. [DOI] [PubMed] [Google Scholar]
- Kaufman MJ, Levin JM, Maas LC, Kukes TJ, Villafuerte RA, Dostal K, Lukas SE, Mendelson JH, Cohen BM, Renshaw PF. Cocaine-induced cerebral vasoconstriction differs as a function of sex and menstrual cycle phase. Biol Psychiatry. 2001;49:774–781. doi: 10.1016/s0006-3223(00)01091-x. [DOI] [PubMed] [Google Scholar]
- Kelley AE. Memory and addiction; shared neural circuitry and molecular mechanisms. Neuron. 2004;44:161–179. doi: 10.1016/j.neuron.2004.09.016. [DOI] [PubMed] [Google Scholar]
- Kennedy C, Des Rosiers MH, Sakurada O, Shinohara M, Reivich M, Jehle JW, Sokoloff L. Metabolic mapping of the primary visual system of the monkey by means of the autoradiographic [14C]deoxyglucose technique. Proc Natl Acad Sci USA. 1976;73:4230–4234. doi: 10.1073/pnas.73.11.4230. [DOI] [PMC free article] [PubMed] [Google Scholar]
- Kety S, Schmidt C. The effects of altered arterial tensions of carbon dioxide and oxygen on cerebral blood flow and cerebral oxygen consumption of normal young men. Jouranl of Clinical Investigations. 1948;27:484–491. doi: 10.1172/JCI101995. [DOI] [PMC free article] [PubMed] [Google Scholar]
- Kim SG, Rostrup E, Larsson HB, Ogawa S, Paulson OB. Determination of relative CMRO2 from CBF and BOLD changes: significant increase of oxygen consumption rate during visual stimulation. Magn Reson Med. 1999;41:1152–1161. doi: 10.1002/(sici)1522-2594(199906)41:6<1152::aid-mrm11>3.0.co;2-t. [DOI] [PubMed] [Google Scholar]
- Krings T, Erberich SG, Roessler F, Reul J, Thron A. MR blood oxygenation level-dependent signal differences in parenchymal and large draining vessels: implications for functional MR imaging. AJNR Am J Neuroradiol. 1999;20:1907–1914. [PMC free article] [PubMed] [Google Scholar]
- Liu ZM, Schmidt KF, Sicard KM, Duong TQ. Imaging oxygen consumption in forepaw somatosensory simulation in rats under isoflurane anesthesia. Magn Reson Med. 2004;52:277–285. doi: 10.1002/mrm.20148. [DOI] [PMC free article] [PubMed] [Google Scholar]
- Luo F, Wu G, Li Z, Li SJ. Characterization of effects of mean arterial blood pressure induced by cocaine and cocaine methiodide on BOLD signals in rat brain. Magn Reson Med. 2003;49:264–270. doi: 10.1002/mrm.10366. [DOI] [PubMed] [Google Scholar]
- Madsen PL, Linde R, Hasselbalch SG, Paulson OB, Lassen NA. Activation-induced resetting of cerebral oxygen and glucose uptake in the rat. J Cereb Blood Flow Metab. 1998;18:742–748. doi: 10.1097/00004647-199807000-00005. [DOI] [PubMed] [Google Scholar]
- Mandeville JB, Jenkins BG, Kosofsky BE, Moskowitz MA, Rosen BR, Marota JJ. Regional sensitivity and coupling of BOLD and CBV changes during stimulation of rat brain. Magn Reson Med. 2001;45:443–447. doi: 10.1002/1522-2594(200103)45:3<443::aid-mrm1058>3.0.co;2-3. [DOI] [PubMed] [Google Scholar]
- Mandeville JB, Marota JJ, Ayata C, Moskowitz MA, Weisskoff RM, Rosen BR. MRI measurement of the temporal evolution of relative CMRO(2) during rat forepaw stimulation. Magn Reson Med. 1999;42:944–951. doi: 10.1002/(sici)1522-2594(199911)42:5<944::aid-mrm15>3.0.co;2-w. [DOI] [PubMed] [Google Scholar]
- Marota JJ, Mandeville JB, Weisskoff RM, Moskowitz MA, Rosen BR, Kosofsky BE. Cocaine activation discriminates dopaminergic projections by temporal response: an fMRI study in Rat. Neurolmage. 2000;11:13–23. doi: 10.1006/nimg.1999.0520. [DOI] [PubMed] [Google Scholar]
- Nestler EJ. From neurobiology to treatment: progress against addiction. Nat Neurosci. 2002;5(Suppl):1076–1079. doi: 10.1038/nn945. [DOI] [PubMed] [Google Scholar]
- Nestler EJ, Hyman SE, Malenka RC. Molecular neuropharmacology: a foundation for clinical neuroscience. McGraw-Hill; New York: 2001. [Google Scholar]
- O’Brien CP. Research advances in the understanding and treatment of addiction. Am J Addict. 2003;12(Suppl 2):S36–47. [PubMed] [Google Scholar]
- Ogawa S, Menon RS, Tank DW, Kim SG, Merkle H, Ellermann JM, Ugurbil K. Functional brain mapping by blood oxygenation level-dependent contrast magnetic resonance imaging. A comparison of signal characteristics with a biophysical model. Biophys J. 1993;64:803–812. doi: 10.1016/S0006-3495(93)81441-3. [DOI] [PMC free article] [PubMed] [Google Scholar]
- Paxinos G, Watson C. The rat brain in stereotaxic coordinates. 4. Academic; New York: 1998. [DOI] [PubMed] [Google Scholar]
- Pitts DK, Udom CE, Marwah J. Cardiovascular effects of cocaine in anesthetized and conscious rats. Life Sci. 1987;40:1099–1111. doi: 10.1016/0024-3205(87)90573-x. [DOI] [PubMed] [Google Scholar]
- Porrino LJ, Domer FR, Crane AM, Sokoloff L. Selective alterations in cerebral metabolism within the mesocorticolimbic dopaminergic system produced by acute cocaine administration in rats. Neuropsychopharmacology. 1988;1:109–118. doi: 10.1016/0893-133x(88)90002-4. [DOI] [PubMed] [Google Scholar]
- Sicard K, Shen Q, Brevard ME, Sullivan R, Ferris CF, King JA, Duong TQ. Regional cerebral blood flow and BOLD responses in conscious and anesthetized rats under basal and hypercapnic conditions: implications for functional MRI studies. J Cereb Blood Flow Metab. 2003;23:472–481. doi: 10.1097/01.WCB.0000054755.93668.20. [DOI] [PMC free article] [PubMed] [Google Scholar]
- Silva AC, Lee SP, Yang G, Iadecola C, Kim SG. Simultaneous blood oxygenation level-dependent and cerebral blood flow functional magnetic resonance imaging during forepaw stimulation in the rat. J Cereb Blood Flow Metab. 1999;19:871–879. doi: 10.1097/00004647-199908000-00006. [DOI] [PubMed] [Google Scholar]
- Sokoloff L, Reivich M, Kennedy C, Des Rosiers MH, Patlak CS, Pettigrew KD, Sakurada O, Shinohara M. The [14C] deoxyglucose method for the measurement of local cerebral glucose utilization: theory, procedure, and normal values in the conscious and anesthetized albino rat. J Neurochem. 1977;28:897–916. doi: 10.1111/j.1471-4159.1977.tb10649.x. [DOI] [PubMed] [Google Scholar]
- Stein EA. fMRI: a new tool for the in vivo localization of drug actions in the brain. J Anal Toxicol. 2001;25:419–424. doi: 10.1093/jat/25.5.419. [DOI] [PubMed] [Google Scholar]
- Stein EA, Fuller SA. Selective effects of cocaine on regional cerebral blood flow in the rat. J Pharmacol Exp Ther. 1992;262:327–334. [PubMed] [Google Scholar]
- Thulborn KR, Waterton JC, Matthews PM, Radda GK. Oxygenation dependence of the transverse relaxation time of water protons in whole blood at high field. Biochim Biophys Acta. 1982;714:265–270. doi: 10.1016/0304-4165(82)90333-6. [DOI] [PubMed] [Google Scholar]
- Ueki M, Linn F, Hossmann KA. Functional activation of cerebral blood flow and metabolism before and after global ischemia of rat brain. J Cereb Blood Flow Metab. 1988;8:486–494. doi: 10.1038/jcbfm.1988.89. [DOI] [PubMed] [Google Scholar]
- Uludag K, Dubowitz DJ, Yoder EJ, Restom K, Liu TT, Buxton RB. Coupling of cerebral blood flow and oxygen consumption during physiological activation and deactivation measured with fMRI. Neuromage. 2004;23:148–155. doi: 10.1016/j.neuroimage.2004.05.013. [DOI] [PubMed] [Google Scholar]
- Worsley KJ, Friston KJ. Analysis of fMRI time-series revisited—again. Neurolmage. 1995;2:173–181. doi: 10.1006/nimg.1995.1023. [DOI] [PubMed] [Google Scholar]