

Abstract
Cell cycle checkpoints play critical roles in the maintenance of genomic integrity and inactivation of checkpoint genes, and are frequently perturbed in most cancers. In a case-control study of 299 non-small cell lung cancer cases and 550 controls in Maryland, we investigated the association between γ-radiation-induced G2/M arrest in cultured blood lymphocytes and lung cancer risk, and examined genotype-phenotype correlations between genetic polymorphisms of 20 genes involving in DNA repair and cell cycle control and γ-radiation-induced G2/M arrest. The study was specifically designed to examine race and gender differences in risk factors. Our data indicated that a less efficient DNA damage-induced G2/M checkpoint was associated with an increased risk of lung cancer in African American women with an adjusted odds ratio (OR) of 2.63 (95% CI = 1.01 – 7.26); there were no statistically significant associations for Caucasians, or African American men. When the African American women were categorized into quartiles, a significant reverse trend of decreased G2/M checkpoint function and increased lung cancer risk was present, with lowest-vs-highest quartile OR of 13.72 (95% CI = 2.30 – 81.92, Ptrend < 0.01). Genotype-phenotype correlation analysis indicated that polymorphisms in ATM, CDC25C, CDKN1A, BRCA2, ERCC6, TP53, and TP53BP1 genes were significantly associated with the γ-radiation-induced G2/M arrest phenotype. This study provides evidence that a less efficient G2/M checkpoint is significantly associated with lung cancer risk in African American women. The data also suggested that the function of G2/M checkpoint is modulated by genetic polymorphisms in genes involved in DNA repair and cell cycle control.
Keywords: Lung cancer, Cell cycle checkpoints, G2/M checkpoint, DNA damage, genotype-phenotype correlation
Introduction
Lung cancer is the leading cause of cancer mortality in the USA and worldwide. In the USA in 2008, an estimated 215,020 new lung cancer diagnoses and 161,840 deaths occurred (1). Although cigarette smoking is the major risk factor in the development of lung cancer, only 10–15% of all smokers develop lung cancer in their lifetime (2), suggesting that there are host differences in susceptibility to lung carcinogens. Previous studies support a hereditary influence on lung cancer risk. For example, individuals with a positive family history of lung cancer have a 2-fold increased risk of developing lung cancer (3). Genetic variations in DNA repair pathway have be shown to modulate the effect of tobacco smoking on lung cancer risk (4;5).
Genomic integrity of mammalian cells is maintained by a complex, highly conserved, and well-regulated defense system consisting of DNA repair, cell cycle checkpoints, and apoptosis. Cell cycle checkpoints determine a temporary arrest at a specific stage of the cell cycle to allow the cell to correct possible defects (6;7). Mammalian cell cycle progression is primarily regulated by the cyclin-dependent kinases, the CDKs, which interact with cyclins and CDK inhibitors as positive and negative regulators of the cell cycle, respectively (8) (9). At least two checkpoints detect DNA damage: one at the G1/S transition and one at the G2/M transition. The G1/S check point prevents the cell from replicating damaged DNA. Considerable experimental evidence support the view that the loss of the G1/S checkpoint can lead to genomic instability, inappropriate survival of genetically damaged cells, and contributes to the clonal evolution of malignancy (10–14). The G2/M checkpoint is activated by DNA damage and by incompletely replicated DNA. This checkpoint prevents chromosome segregation if the chromosome is not intact. The signaling pathway leading to G2 arrest after DNA damage is frequently altered or mutated in human cancer (15–17).
DNA lesions may be left unrepaired in cells with disrupted or suboptimal cell cycle checkpoints. If unrepaired DNA lesions are replicated or transmitted to daughter cells, the genomic integrity of the progeny cells will be compromised. Several observations indicate that defects in the regulation of G1/S or G2/M checkpoints may play a critical role in human tumorigenesis. For example, non-neoplastic cells from individuals with familial cancer predisposition display a higher than average frequency of mitotic chromosomal breaks after irradiation (18;19). Cells from patients with ataxia telangiectasia undergo “suboptimal arrest” after irradiation in the G2 phase (20–23). Altered expressions of cyclins A, B, and CDC2, which are all potential targets of mitotic checkpoint control, occur in some cancers (24). Mutations in cell cycle control genes, such as p53 and p21 (CDKN1A), have also been directly linked to chromosomal aberrations and genomic instability (25–27). More recently, we and others have reported that patients with lung cancer were more likely to exhibit deficiencies in cell cycle checkpoints, as measured by in vitro cellular response to carcinogen exposure (28;29).
Previously, we reported our initial findings that less efficient G2/M checkpoint function was associated with an increased risk of lung cancer in African Americans (28). Here we report the final results with a larger sample size (299 cases and 550 controls) and examined genotype-phenotype correlations using a multigenic pathway approach. We seek to test the hypothesis that deficiencies in response to DNA damage-induced cell cycle regulation contribute to the risk of developing lung cancer and genetic polymorphisms in DNA repair and/or cell cycle control genes affect G2/M checkpoint function. The study aims are: i) determine the association between γ-radiation-induced G2/M arrest and lung cancer risk; ii) examine the correlations between G2/M arrest phenotype and genetic polymorphisms in DNA repair and cell cycle control genes.
Material and Methods
Study population
The study population accrual and eligibility criteria have been described previously (30). The 299 lung cancer patients were recruited from seven hospitals in the Baltimore, Maryland, metropolitan area between 1999 and 2004. All cases were histologically confirmed non-small cell lung cancer patients. Population controls (n =322) were recruited from the same Maryland counties of residence as the lung cancer cases by screening information obtained from the Maryland Department of Transportation (MDT), which allowed us to obtain a random sample of controls, frequency-matched to the cases by age. African-American population controls were oversampled by design. Hospital controls (N = 228) were cancer-free patients recruited from the same hospital as cases, and were frequency-matched to the cases by gender, race, age, and smoking status. The overall participation rates of the study population for eligible subjects were 90%, 88% and 88% for cases, population- and hospital-controls, respectively. Among the cases, the distribution of gender and race was similar between participants and non- participants, and among the control groups, the distribution of gender was also similar. However, African American males were significantly more likely to be non- participants in both population and hospital control groups.
Eligibility criteria
Eligible subjects had to be either Caucasian or African American, free of known diagnosis of HIV, HCV and HBV; born in the United States; a resident of Baltimore City or its adjacent counties or counties of the Maryland Eastern Shore; able to speak English well enough to be interviewed; non-institutionalized; and currently not taking antibiotics or immunosuppressive medications (e.g., steroids). Subjects who had undergone surgery provided a blood sample either before the surgery or three months after the surgery. Subjects who had undergone chemotherapy or radiation therapy were excluded from this study. Chemotherapy, radiation therapy and active infections are known to affect the growth potential of the lymphocytes, and so we excluded such subjects to maximize the validity of the results.
The study was approved by the Institutional Review Boards of the National Cancer Institute, University of Maryland Baltimore, the Johns Hopkins University School of Medicine, Sinai Hospital, MedStar Research Institute, and the Research Ethics Committee of Bon Secours Baltimore Health System. After informed consent was obtained, cases and controls received a structured, in-person interview assessing prior medical and cancer history, tobacco use, alcohol use, current medications, occupational history, family medical history, reproductive history and estrogen use, recent nutritional supplements and caffeine intake, and socioeconomic characteristics. Blood was obtained by trained interviewers in heparinized tubes. Aliquots of the blood samples were transferred within 24 hours of collection to the Laboratory of Human Carcinogenesis at the National Cancer Institute for laboratory analyses. Laboratory personnel were blinded to case-control status of study subjects.
Blood cultures and preparation of chromosome spreads
Blood cultures were set up within 48 hours after the samples were obtained. One ml of fresh whole blood was added to 9 ml of RPMI-1640 medium, supplemented with 15% fetal bovine serum, 1.5% of phytohemagglutinin, 2 mM L-glutamine and 100 units/ml each of penicillin and streptomycin. After the cells were cultured for 90 hours at 37°C, the cells were exposed to 1.0 gray γ-radiation at the rate of 1.26 gray per minute using a gamma irradiator (J.L. Shepherd, model Mark II) at room temperature (RT) and incubated at 37°C for an additional 3 hours. Colcemid (0.2 μg/ml) was added to the culture 2 hours after γ-radiation and incubated for additional 1 hour at 37°C. The cells were treated in a hypotonic solution (0.06 M KCl) for 25 minutes at RT and fixed in the fixative (3 parts of methanol with 1 part of acetic acid). The cells were dropped onto a clean microscopic slide, air dried, and stained with 4% Gurr’s Giemsa solution (BDH Laboratory Supplies, England).
Mitotic index ascertainment
Giemsa-stained slides were examined using a Nikon Eclipse E400 microscope with 40x objective. At least 1000 cells were counted manually per subject and the percentage of metaphase cells was recorded. If less than 5 metaphase cells were found in 1000 cells, then 5000 cells were counted. If less than 10 metaphase cells were found in 5000 cells in the untreated (control) culture, the culture was regarded as failed (1.3% of the total subjects) and the subjects were excluded from statistical analyses. The γ-radiation-induced G2/M arrest was defined as the percentage of mitotic cells in the untreated culture minus the percentage of mitotic cells in the γ-radiation-treated culture from the same subject. The mitotic index in the untreated cultures were considered baseline mitotic index and used as an indicator of cell growth. The slides were labeled with the study ID and scored without the knowledge of case-control status.
Genotyping
Subjects were genotyped for a total of 54 SNPs (suppl. Table 1) mapped to 20 genes involved in DNA repair and cell cycle control: ATM, BRCA2, CDC25C, CDKN1A, CDKN2A, CHEK1, CHEK2, ERCC2, ERCC4, ERCC6, GADD45A, GADD45B, GADD45G, NBS, TP53, TP53BP1, TP73, WRN, XRCC1, XRCC3. The 54 SNPs in these genes were chosen based on the following criteria: (i) the allele variant gene is potentially functionally important, based on previous publications or because the allele variant results in a change of the amino acid sequence of the protein; (ii) the polymorphism will likely affect protein expression/stability/activity or mRNA splicing/stability; (iii) an association between the genotype and cancer risk was previously shown; and (iv) the variant allele is common (> 5%). Genomic DNA was extracted from buffy coats stored at −80°C using the Flexi Gene DNA kit (Qiagen, Valencia, CA). Genotyping was done in the Genotyping Core Facility of NCI using 5′ exonuclease assay (TaqMan TM) (31). Sequences of primers and probes can be found at http:/snp500cancer.nci.nih.gov. Genotyping was repeated for 15% of the samples that were randomly selected to check the accuracy of genotyping and the results indicated that the concordant rates were 99% or greater.
Statistical analyses
The Chi-square goodness-of-fit test was used to examine the distribution of categorical variables and Student t test was used to examine the distribution of continuous variables between cases and controls or between genotypes. Departures from Hardy-Weinberg equilibrium (HWE) were evaluated using Chi-square tests, using the observed genotype frequencies obtained from the data and the expected genotype frequencies. Multivariate logistic regression was used to analyze the relationship between lung cancer risk and G2/M arrest phenotype or between G2/M arrest phenotype and SNPs. Smoking status was classified into three categories: never smokers -individuals who had never smoked more than 100 cigarettes in their life; former smokers -individuals who had smoked more than 100 cigarettes in their life, were not active smokers at the time of interview and had quit more than 6 months prior to their interview; and current smokers -individuals who had smoked more than 100 cigarettes in their life, were active smokers at the time of interview or had quit less than 6 months prior to their interview. All P values were two-sided. All analyses were performed using SAS software, version 9 (SAS Institute Inc., Cary, NC).
Results
Population descriptive characteristics
Descriptive characteristics of the 299 lung cancer cases and the 550 controls are summarized in Table 1. There was no difference in gender distribution among groups, or age distribution among male subjects, however female hospital controls tended to be younger than both cases and population controls (P < 0.001). Overall, in this study, 66% of participants were Caucasians; African Americans were 49% in the population control group and 28% in the hospital control group, reflecting the study design. Cases were significantly more likely to be smokers (P < 0.01) compared to both control groups (Table 1). Hospital controls were more likely to smoke compared to population controls.
Table 1.
Characteristics of Study Population
| Cases (N=299) | Hospital Controls (N=228) | Pa | Population Controls (N=322) | Pb | |
|---|---|---|---|---|---|
| Age (y), mean (SD) | 66.7 (10.6) | 65.74(10.7) | 0.26 | 66.9 (8.8) | 0.79 |
| Male | 67.0 (10.1) | 69.0 (9.6) | 0.08 | 68.0 (7.9) | 0.34 |
| Female | 66.5 (11.1) | 62.78 (10.8) | <0.01 | 65.9 (9.6) | 0.59 |
| Gender, N (%) | |||||
| Male | 144 (48) | 108 (47) | 165 (51) | ||
| Female | 155 (52) | 120 (53) | 0.86 | 157 (49) | 0.44 |
| Race, N (%) | |||||
| African American | 81 (27) | 64 (28) | 157 (49) | ||
| Caucasian | 218 (73) | 164 (72) | 0.80 | 165 (51) | <0.01 |
| Smoking status, N (%) | |||||
| Never | 14 (5) | 29 (13) | 128 (40) | ||
| Former | 127 (42) | 124 (54) | 154 (48) | ||
| Current | 158 (53) | 75 (33) | <0.01 | 40 (12) | <0.01 |
| Pack-years, N (%) | |||||
| ≤20 | 50 (18) | 36 (18) | 98 (52) | ||
| 21–40 | 92 (32) | 57 (29) | 53 (28) | ||
| 41–60 | 83 (29) | 51 (25) | 31 (16) | ||
| >60 | 59 (21) | 55 (28) | 0.33 | 8 (4) | <0.01 |
Pa: comparison between cases and hospital controls
Pb: comparison between cases and population controls
G2/M arrest and lung cancer risk
The results for the γ-radiation-induced G2/M arrest between case-control groups are presented in Table 2 and Figure 1. Overall, cases were significantly more likely to exhibit a low mean percentage of G2/M arrest (1.28%) compared to hospital (1.40%) and population (1.42%) controls. When stratified by gender or race, case-control differences maintained statistical significance for women (P <0.01), but not men (P = 0.92). There were statistically significant differences overall for African Americans (P = 0.02), but not for Caucasians (P = 0.47). When stratified by both race and gender, the percentage of G2/M arrest was significantly lower in cases than in controls only for the African American women (P = 0.02), and the results were borderline significant in Caucasian women (P = 0.07). We noted that the comparison of women to men in control subjects revealed that the women had an average 20% higher γ-radiation-induced G2/M arrest than that of men. There were no significant differences in mean percentage of G2/M arrest between the two control groups. Therefore, the two control groups were combined for the subsequent multivariate analyses.
Table 2.
Mean Percent Gamma-radiation-induced G2/M Arrest by Host Factors
| Cases | Hospital controls | Population controls | Combined controls | ||||||||
|---|---|---|---|---|---|---|---|---|---|---|---|
| N | Mean (SD) | N | Mean (SD) | Pa | N | Mean (SD) | Pb | N | Mean (SD) | Pc | |
| Overall | 299 | 1.28 (0.84) | 228 | 1.40 (0.82) | 0.08 | 322 | 1.42 (0.81) | 0.03 | 550 | 1.41 (0.81) | 0.03 |
| Gender | |||||||||||
| Male | 144 | 1.30 (0.85) | 108 | 1.38 (0.83) | 0.48 | 165 | 1.27 (0.82) | 0.71 | 273 | 1.31 (0.82) | 0.92 |
| Female | 155 | 1.26 (0.83) | 120 | 1.43 (0.81) | 0.07 | 157 | 1.57 (0.77) | <0.01 | 277 | 1.52 (0.79) | <0.01 |
| Race | |||||||||||
| AA | 81 | 1.31 (0.84) | 64 | 1.48 (0.71) | 0.19 | 157 | 1.57 (0.84) | 0.02 | 221 | 1.54 (0.80) | 0.02 |
| CA | 218 | 1.27 (0.84) | 164 | 1.38 (0.85) | 0.21 | 165 | 1.27 (0.76) | 0.97 | 329 | 1.32 (0.81) | 0.47 |
| Gender/Race | |||||||||||
| AA/Male | 38 | 1.29 (0.81) | 24 | 1.42 (0.61) | 0.53 | 79 | 1.44 (0.89) | 0.34 | 103 | 1.43 (0.83) | 0.34 |
| AA/Female | 43 | 1.32 (0.88) | 40 | 1.52 (0.77) | 0.26 | 78 | 1.71 (0.76) | 0.01 | 118 | 1.64 (0.77) | 0.02 |
| CA/Male | 106 | 1.31 (0.86) | 84 | 1.36 (0.89) | 0.64 | 86 | 1.11 (0.71) | 0.10 | 170 | 1.23 (0.81) | 0.48 |
| CA/Female | 112 | 1.24 (0.81) | 80 | 1.39 (0.82) | 0.19 | 79 | 1.44 (0.77) | 0.08 | 159 | 1.42 (0.80) | 0.07 |
| Smoking Status | |||||||||||
| Never | 14 | 1.09 (0.63) | 29 | 1.27 (0.90) | 0.45 | 128 | 1.54 (0.71) | 0.03 | 157 | 1.49 (0.75) | 0.06 |
| Former | 127 | 1.32 (0.83) | 124 | 1.40 (0.76) | 0.39 | 154 | 1.33 (0.86) | 0.89 | 278 | 1.36 (0.82) | 0.59 |
| Current | 158 | 1.27 (0.86) | 75 | 1.47 (0.89) | 0.11 | 40 | 1.33 (0.86) | 0.68 | 115 | 1.42 (0.88) | 0.16 |
AA =African American, CA =Caucasian
Pa comparison between cases and hospital controls
Pb comparison between cases and population controls
Pc comparison between cases and combined controls
Figure 1.
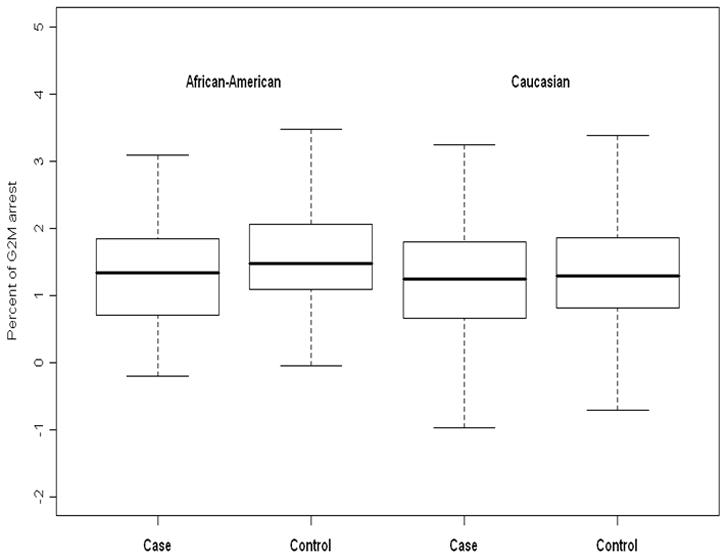
Box and whiskers plots to compare the distribution of percent of G2/M arrest between cases and controls, stratifying by race. In African-Americans, the mean percent of G2/M arrest is significantly higher in controls than in cases (p = 0.02). In Caucasians, there is no significant difference in the mean percent of G2/M arrest between cases and controls (p = 0.47).
Logistic regression analysis was used to estimate the lung cancer risk by G2/M arrest phenotype. In this analysis, the percent of G2/M arrest was dichotomized into low/high (less efficient/more efficient) groups using the median value (1.40 %) in the combined controls as the cut point. When comparing the overall control group to cases, having a low G2/M arrest score was not significantly associated with increased lung cancer risk. The adjusted odds ratio (aOR) was 1.01 (95% Confidence Interval [CI] = 0.69–1.47), which was adjusted for age, race, gender, pack-years and baseline mitotic index (Table 3). When stratified by gender or race, there was some evidence for an association between less efficient G2/M checkpoint scores and lung cancer risk in African Americans (aOR = 1.64, 95% CI = 0.81 – 3.33). When the G2/M arrest was categorized by quartiles, a borderline significant inverse trend for the association between G2/M arrest and lung cancer risk was observed in African Americans (Ptrend = 0.05, Table 3). When the study subjects were further stratified both race and gender, a significant association between G2/M arrest and lung cancer risk was observed only in African American women (aOR = 2.63, 95% CI = 1.01–7.26). A significant inverse trend for the association between G2/M arrest and lung cancer risk also was seen in African American women (Ptrend < 0.01), with a lowest-vs-highest quartile OR of 13.72 (95% CI = 2.30–81.92). No significant associations between G2/M arrest and lung cancer risk were observed in African American males, Caucasian males and Caucasian females (Table 3). We observed no statistically significant interaction between G2/M arrest phenotype and race, and between G2/M arrest phenotype and gender.
Table 3.
Lung Cancer Risk Estimates by Gamma-radiation-induced G2/M Arrest
| G2/M arrest | Cases | Controls | OR 1 (95%CI) | OR2 (95%CI) |
|---|---|---|---|---|
| Overall | ||||
| Above median | 133 | 275 | 1.00 | 1.00 |
| Below median | 166 | 275 | 1.22 (0.91–1.64) | 1.01 (0.69–1.47) |
| By quartiles | ||||
| 4th quartile | 66 | 142 | 1.00 | 1.00 |
| 3rd quartile | 67 | 133 | 0.98 (0.64–1.52) | 0.86 (0.53–1.39) |
| 2nd quartile | 63 | 136 | 0.97 (0.63–1.51) | 0.80 (0.47–1.36) |
| 1st quartile | 103 | 139 | 1.43 (0.95–2.15) | 1.08 (0.59–1.96) |
| Ptrend | 0.08 | 0.73 | ||
| Males | ||||
| Above median | 65 | 124 | 1.00 | 1.00 |
| Below median | 79 | 149 | 0.99 (0.64–1.52) | 0.83 (0.48–1.44) |
| By quartiles | ||||
| 4th quartile | 32 | 54 | 1.00 | 1.00 |
| 3rd quartile | 33 | 70 | 0.77 (0.41–1.45) | 0.63 (0.32–1.27) |
| 2nd quartile | 31 | 69 | 0.80 (0.42–1.51) | 0.60 (0.28–1.28) |
| 1st quartile | 48 | 80 | 0.91 (0.50–1.66) | 0.58 (0.24–1.41) |
| Ptrend | ||||
| Females | ||||
| Above median | 68 | 151 | 1.00 | 1.00 |
| Below median | 87 | 126 | 1.44 (0.95–2.18) | 1.19 (0.70–2.04) |
| By quartiles | ||||
| 4th quartile | 34 | 88 | 1.00 | 1.00 |
| 3rd quartile | 34 | 63 | 1.16 (0.63–2.12) | 1.09 (0.55–2.14) |
| 2nd quartile | 32 | 67 | 1.08 (0.59–2.00) | 0.99 (0.47–2.09) |
| 1st quartile | 55 | 59 | 2.03 (1.15–3.57) | 1.79 (0.78–4.08) |
| Ptrend | 0.02 | 0.17 | ||
| African Americans | ||||
| Above median | 36 | 126 | 1.00 | 1.00 |
| Below median | 45 | 95 | 1.58 (0.90–2.77) | 1.64 (0.81–3.33) |
| By quartiles | ||||
| 4th quartile | 18 | 69 | 1.00 | 1.00 |
| 3rd quartile | 18 | 57 | 0.83 (0.36–1.92) | 0.96 (0.38–2.39) |
| 2nd quartile | 17 | 53 | 0.93 (0.41–2.09) | 1.14 (0.43–3.03) |
| 1st quartile | 28 | 42 | 2.16 (1.00–4.64) | 2.97 (0.96–9.19) |
| Ptrend | 0.05 | 0.05 | ||
| African American/Males | ||||
| Above median | 18 | 55 | 1.00 | 1.00 |
| Below median | 20 | 48 | 1.16 (0.52–2.59) | 0.95 (0.35–2.61) |
| By quartiles | ||||
| 4th quartile | 9 | 24 | 1.00 | 1.00 |
| 3rd quartile | 9 | 31 | 0.67 (0.21–2.17) | 0.57 (0.16–1.99) |
| 2nd quartile | 9 | 24 | 0.79 (0.25–2.51) | 0.60 (0.15–2.35) |
| 1st quartile | 11 | 24 | 1.13 (0.37–3.44) | 0.74 (0.15–3.58) |
| Ptrend | 0.75 | 0.78 | ||
| African American/Females | ||||
| Above median | 18 | 71 | 1.00 | 1.00 |
| Below median | 25 | 47 | 2.02 (0.91–4.49) | 2.63 (1.01–7.26) |
| By quartiles | ||||
| 4th quartile | 9 | 45 | 1.00 | 1.00 |
| 3rd quartile | 9 | 26 | 0.92 (0.27–3.15) | 1.76 (0.43–7.18) |
| 2nd quartile | 8 | 29 | 1.00 (0.32–3.19) | 2.24 (0.54–9.33) |
| 1st quartile | 17 | 18 | 3.61 (1.23–10.61) | 13.72 (2.30–81.92) |
| Ptrend | 0.03 | <0.01 | ||
| Caucasians | ||||
| Above median | 97 | 149 | 1.00 | 1.00 |
| Below median | 121 | 180 | 1.09 (0.77–1.56) | 0.82 (0.52–1.29) |
| By quartiles | ||||
| 4th quartile | 48 | 73 | 1.00 | 1.00 |
| 3rd quartile | 49 | 76 | 0.98 (0.58–1.65) | 0.76 (0.42–1.36) |
| 2nd quartile | 46 | 83 | 0.93 (0.55–1.58) | 0.64 (0.34–1.22) |
| 1st quartile | 75 | 97 | 1.20 (0.74–1.95) | 0.70 (0.34–1.44) |
| Ptrend | 0.46 | 0.41 | ||
| Caucasian/Males | ||||
| Above median | 47 | 69 | 1.00 | 1.00 |
| Below median | 59 | 101 | 0.91 (0.55–1.52) | 0.77 (0.40–1.49) |
| By quartiles | ||||
| 4th quartile | 23 | 30 | 1.00 | 1.00 |
| 3rd quartile | 24 | 39 | 0.80 (0.37–1.73) | 0.66 (0.28–1.54) |
| 2nd quartile | 22 | 45 | 0.75 (0.34–1.63) | 0.57 (0.22–1.44) |
| 1st quartile | 37 | 56 | 0.85 (0.41–1.74) | 0.55 (0.19–1.62) |
| Ptrend | 0.72 | 0.33 | ||
| Caucasian/Females | ||||
| Above median | 50 | 80 | 1.00 | 1.00 |
| Below median | 62 | 79 | 1.28 (0.78–2.12) | 0.88 (0.46–1.68) |
| By quartiles | ||||
| 4th quartile | 25 | 43 | 1.00 | 1.00 |
| 3rd quartile | 25 | 37 | 1.11(0.54–2.28) | 0.81 (0.36–1.82) |
| 2nd quartile | 24 | 38 | 1.11 (0.53–2.35) | 0.71 (0.28–1.77) |
| 1st quartile | 38 | 41 | 1.54 (0.78–3.03) | 0.83 (0.31–2.22) |
| Ptrend | 0.22 | 0.75 | ||
OR1: adjusted for age, pack-years, gender and race (where appropriate)
OR2: adjusted for baseline mitotic index, age, pack-years, gender and race (where appropriate)
Genotype-phenotype correlations
All polymorphisms examined were in Hardy-Weinberg equilibrium in African American and Caucasian controls except XRCC1 R194W in African American controls and ERCC4 E875G, WRN C1367R, WRN IVS18-3168C>T and CHEK1 I471V in Caucasian controls. Thus these SNPs were removed from the analysis. Within the assayed genotypes, high degrees of linkage disequilibrium (LD) were observed for three SNPs in TP53BP1 (r2 = 0.56 to 0.78) and three SNPs in ERCC6 (r2 = 0.84 to 0.98) in both African American and Caucasian control groups, which is consistent with previous reports (32). To evaluate if genetic polymorphisms were associated with the G2/M arrest phenotype, we examined the association between 49 SNPs and percent of G2/M arrest. This part of the analysis was restricted to the control subjects only (hospital- and population-controls combined). We first compared the mean percent of G2/M arrest by genotypes of each SNP. We found that the mean percent of G2/M arrest differed significantly between genotypes of 10 SNPS in 6 genes: ATM Ex1-81G>A, ATM D126E, BRCA2 N272H, CDC25C Ex1-62T>G, CDKN1A S31R, TP53 1474bp 3′ of STP C>T, TP53BP1 IVS4+703G>T, TP53BP1 IVS1+544G>A, TP53BP1 IVS2+7G>A, and TP53BP1 D353E (Table 4). Using the dichotomized form of G2/M arrest (as defined above), the logistic regression analysis revealed that three ERCC6 SNPs were significantly associated with the G2/M arrest phenotype (Table 5). The association between these 13 SNPs and lung cancer risk were examined and no significant association was observed for any individual SNP (suppl. Table 2).
Table 4.
Mean Percent of Gamma-radiation-induced G2/M Arrest by Genotypes in Controls
| Genotype | N | Mean (SD) | P† | Genotype | N | Mean (SD) | P† |
|---|---|---|---|---|---|---|---|
| ATM Ex1-81G>A | TP53 1474bp 3′ of STP C>T | ||||||
| GG | 132 | 1.62 (0.86) | CC | 155 | 1.51 (0.90) | ||
| GA | 214 | 1.38 (0.81) | 0.01 | CT | 165 | 1.51 (0.72) | 0.96 |
| AA | 100 | 1.33 (0.74) | 0.01 | TT | 67 | 1.24 (0.77) | 0.02 |
| GA+AA | 314 | 1.36 (0.79) | 0.03 | CT+TT | 232 | 1.38 (0.73) | 0.03 |
| ATM D126E | CDKN1A S31R | ||||||
| TT | 396 | 1.43 (0.79) | CC | 408 | 1.39 (0.81) | ||
| TA | 56 | 1.54 (0.88) | 0.29 | CA | 99 | 1.50 (0.85) | 0.22 |
| AA | 4 | 2.63 (0.24) | 0.01 | AA | 16 | 1.86 (0.93) | 0.02 |
| TA+AA | 60 | 1.62 (0.89) | 0.09 | CA+AA | 115 | 1.55 (0.87) | 0.06 |
| BRCA2 N372H | CDC25C Ex1-62T>G | ||||||
| AA | 308 | 1.48 (0.81) | TT | 317 | 1.48 (0.81) | ||
| AC | 181 | 1.36 (0.82) | 0.11 | TG | 69 | 1.20 (0.80) | 0.01 |
| CC | 29 | 1.11 (0.90) | 0.02 | GG | 5 | 1.38 (0.71) | 0.80 |
| AC+CC | 210 | 1.23 (0.83) | 0.03 | TG+GG | 74 | 1.22 (0.79) | 0.01 |
| ERCC6 M1097V | TP53BP1 IVS4+703G>T | ||||||
| AA | 300 | 1.44 (0.80) | GG | 140 | 1.33 (0.85) | ||
| AG | 135 | 1.51 (0.80) | 0.38 | GT | 168 | 1.43 (0.79) | 0.27 |
| GG | 21 | 1.41 (0.71) | 0.90 | TT | 151 | 1.58 (0.78) | 0.01 |
| AG+GG | 156 | 1.46 (0.80) | 0.41 | GT+TT | 319 | 1.50 (0.78) | 0.04 |
| ERCC6 Q1413R | TP53BP1 IVS16+36T>C | ||||||
| AA | 303 | 1.43 (0.81) | TT | 295 | 1.44 (0.81) | ||
| AG | 130 | 1.5 (0.85) | 0.45 | TC | 141 | 1.46 (0.80) | 0.63 |
| GG | 21 | 1.4 (0.75) | 0.86 | CC | 10 | 1.34 (0.73) | 0.68 |
| AG+GG | 151 | 1.48 (0.83) | 0.51 | TC+CC | 151 | 1.38 (0.72) | 0.81 |
| ERCC6 R1213G | TP53BP1 IVS1+544G>A | ||||||
| AA | 294 | 1.43 (0.80) | GG | 143 | 1.35 (0.87) | ||
| AG | 142 | 1.50 (0.82) | 0.40 | GA | 179 | 1.42 (0.79) | 0.07 |
| GG | 23 | 1.39 (0.71) | 0.84 | AA | 138 | 1.58 (0.76) | 0.02 |
| AG+GG | 165 | 1.48 (0.81) | 0.52 | GA+AA | 317 | 1.48 (0.79) | 0.02 |
| GADD45A Ex1+16A>T | TP53BP1 IVS2 + 7G>A | ||||||
| TT | 464 | 1.41 (0.81) | GG | 259 | 1.40 (0.84) | ||
| TA | 42 | 1.61 (0.72) | 0.11 | GA | 135 | 1.46 (0.78) | 0.22 |
| AA | 7 | 0.99 (1.04) | 0.16 | AA | 66 | 1.63 (0.77) | 0.04 |
| TA+AA | 49 | 1.52 (0.79) | 0.32 | GA+AA | 201 | 1.55 (0.82) | 0.04 |
| TP53 P72R | TP53BP1 D353E | ||||||
| GG | 238 | 1.40 (0.82) | CC | 141 | 1.34 (0.85) | ||
| GC | 206 | 1.41 (0.82) | 0.27 | CG | 168 | 1.42 (0.79) | 0.30 |
| CC | 82 | 1.53 (0.78) | 0.21 | GG | 152 | 1.57 (0.78) | 0.01 |
| GC+CC | 288 | 1.47 (0.82) | 0.20 | CG+GG | 320 | 1.49 (0.79) | 0.06 |
p-values are comparing the means between wild-type homozygote group and heterozygote group or variant homozygote group or combined heterozygote and variant homozygote group.
Notes: None of the other 32 SNPs that were examined (see supplementary Table 1) showed any significant associations with G2/M arrest phenotype
Table 5.
Estimates of Association between Gamma-radiation-induced G2/M Arrest and Genotypes among Controls
| Genotype | G2/M arrest high/low | OR(95%CI) | Genotype | G2/M arrest high/low | OR(95%CI) |
|---|---|---|---|---|---|
| ATM Ex1-81G>A | TP53 1474bp 3′ of STP C>T | ||||
| GG | 79/53 | 1.00 | CC | 90/65 | 1.00 |
| GA | 110/104 | 1.09 (0.58–2.03) | CT | 101/64 | 0.64 (0.36–1.16) |
| AA | 51/49 | 0.95 (0.45–2.04) | TT | 31/36 | 1.07 (0.5–2.27) |
| GA+AA | 161/153 | 0.98 (0.67–1.43) | CT+TT | 132/100 | 0.75 (0.43–1.30) |
| ATM D126E | CDKN1A S31R | ||||
| TT | 212/184 | 1.00 | CC | 208/200 | 1.00 |
| TA | 33/23 | 1.16 (0.48–2.88) | CA | 56/43 | 1.12 (0.62–2.05) |
| AA | 4/0 | - | AA | 13/3 | 0.66 (0.14–3.1) |
| TA+AA | 37/23 | 1.05 (0.46–2.38) | CA+AA | 69/46 | 0.84 (0.51–1.37) |
| BRCA2 N372H | CDC25C Ex1-62T>G | ||||
| AA | 174/134 | 1.00 | TT | 185/132 | 1.00 |
| AC | 88/93 | 0.98 (0.59–1.62) | TG | 29/40 | 0.80 (0.39–1.69) |
| CC | 12/17 | 0.75 (0.26–2.21) | GG | 3/2 | 0.65 (0.04–10.3) |
| AC+CC | 100/110 | 0.93 (0.62–1.38) | TG+GG | 32/42 | 1.15 (0.59–2.22) |
| ERCC6 M1097V | TP53BP1 IVS4+703G>T | ||||
| AA | 153/147 | 1.00 | GG | 66/74 | 1.00 |
| AG | 87/48 | 0.32 (0.18–0.58) | GT | 88/80 | 0.99 (0.53–1.85) |
| GG | 10/11 | 1.09 (0.34–3.51) | TT | 95/56 | 0.62 (0.31–1.28) |
| AG+GG | 97/59 | 0.56 (0.36–0.88) | GT+TT | 183/136 | 0.81 (0.54–1.24) |
| ERCC6 Q1413R | TP53BP1 IVS16+36T>C | ||||
| AA | 154/149 | 1.00 | TT | 156/139 | 1.00 |
| AG | 82/48 | 0.36 (0.2–0.65) | TC | 79/62 | 0.90 (0.53–1.54) |
| GG | 10/11 | 0.95 (0.28–3.18) | CC | 5/5 | 1.98 (0.37–10.49) |
| AG+GG | 92/59 | 0.57 (0.36–0.89) | TC+CC | 84/67 | 0.95 (0.56–1.60) |
| ERCC6 R1213G | TP53BP1 IVS1+544G>A | ||||
| AA | 148/146 | 1.00 | GG | 68/75 | 1.00 |
| AG | 90/52 | 0.38 (0.22–0.67) | GA | 94/85 | 0.91 (0.49–1.69) |
| GG | 11/12 | 0.92 (0.29–2.86) | AA | 87/51 | 0.62 (0.27–1.43) |
| AG+GG | 101/64 | 0.59 (0.38–0.91) | GA+AA | 181/136 | 0.85 (0.46–1.56) |
| GADD45A Ex1+16A>T | TP53BP1 IVS2 +7G>A | ||||
| TT | 243/221 | 1.00 | GG | 122/137 | 1.00 |
| TA | 28/14 | 0.94 (0.36–2.46) | GA | 74/61 | 0.99 (0.53–1.85) |
| AA | 2/5 | 6.45 (0.87–48.04) | AA | 42/24 | 0.62 (0.31–1.28) |
| TA+AA | 30/19 | 1.28 (0.53–3.11) | GA+AA | 116/85 | 0.81 (0.54–1.24) |
| TP53 P72R | TP53BP1 D353E | ||||
| GG | 125/113 | 1.00 | CC | 67/74 | 1.00 |
| GC | 111/95 | 1.19 (0.70–2.00) | CG | 87/81 | 0.95 (0.31–1.77) |
| CC | 45/37 | 1.27 (0.62–2.60) | GG | 95/57 | 0.62 (0.30–1.26) |
| GC+CC | 156/132 | 1.21 (0.74–1.98) | CG+GG | 182/138 | 0.83 (0.55–1.26) |
ORs are adjusted for age, gender, race, pack-years and baseline mitotic index
None of the other 32 SNPs that were examined (see supplementary Table 1) showed any significant association with G2/M arrest phenotype
Classifying such genotypes showing significant correlation to the less-efficient (low) G2/M arrest as “adverse” genotypes, we assessed the genotype-phenotype correlation using combinations of 4 SNPs from 4 genes. The selection of SNPs for combined analysis was based on: (i) significant associations (p < 0.05) between the SNP and G2/M phenotype from single SNP analysis; (ii) rare allele frequency > 0.20 for statistical power; (iii) in case of linked SNPs within a gene (ERCC6 and TP53BP1), one SNP was randomly selected to represent that gene. Using the 0 or 1 adverse genotypes as the reference group, individuals who carry 2, 3 and 4 adverse genotypes were significantly more likely to have less-efficient G2/M arrest phenotype (Ptrend = 0.01, Table 6) in the overall study population. When stratified by race, carrying 2, 3 or 4 adverse genotypes showed significant trend association with less-efficient G2/M arrest phenotype in Caucasians (Ptrend = 0.05) and non-significant trend of association in African Americans (Ptrend = 0.10, Table 6). We observed no significant interaction between race and genotypes.
Table 6.
Estimates of Association between Gamma-radiation-induced G2/M Arrest and Combined Adverse Genotypes among Controls
| No. of adverse genotypes | G2/M arrest low/high | Mean % G2/M arrest (SD) | OR (95% CI) | Ptrend |
|---|---|---|---|---|
| All subjects | ||||
| 0–1 | 23/39 | 1.57 (0.81) | 1.00 | |
| 2 | 63/89 | 1.50 (0.80) | 1.52 (0.68–3.36) | |
| 3 | 80/82 | 1.31 (0.82) | 2.15 (0.97–4.78) | |
| 4 | 33/22 | 1.44 (0.68) | 3.20 (1.19–8.54) | 0.01 |
| Caucasians | ||||
| 0–1 | 13/17 | 1.43 (0.82) | 1.00 | |
| 2 | 34/50 | 1.43 (0.80) | 0.90 (0.30–2.71) | |
| 3 | 58/49 | 1.30 (0.85) | 1.70 (0.58–4.97) | |
| 4 | 28/17 | 1.31 (0.67) | 2.26 (0.67–7.57) | 0.05 |
| African Americans | ||||
| 0–1 | 10/22 | 1.69 (0.80) | 1.00 | |
| 2 | 29/39 | 1.60 (0.74) | 2.82 (0.85–9.37) | |
| 3 | 22/33 | 1.56 (0.88) | 2.68 (0.75–9.53) | |
| 4 | 5/5 | 1.37 (0.71) | 5.21 (0.72–37.7) | 0.10 |
The adverse genotypes were the GA or AA genotypes of ATM Ex1-81G>A, the AA genotype of the ERCC6 Q1413R, the CG or CC genotypes of the TP53 P72R, and the GG genotype of the TP53BP1 IVS2+7G>A
ORs are adjusted for age, gender, race, pack-years, and baseline mitotic index
Discussion
In this report, we confirmed our previous findings that deficiency in DNA damage-induced G2/M arrest is associated with an increased risk of lung cancer in African Americans in this population (28). Originally, we reported on 216 cases and 340 controls. The larger sample size in the present report allowed for increased statistical power to conduct stratified analyses by cross classification of race and gender, in which we found that the association for G2/M arrest and lung cancer risk was restricted to African American women with an aOR of 2.6. Further, we assessed the role for genetic polymorphisms for affecting G2/M arrest phenotypes and found that polymorphisms in ATM, CDC25C, CDKN1A, BRCA2, ERCC6, TP53, and TP53BP1 genes were significantly associated with the γ-radiation-induced G2/M arrest phenotype.
Lung cancer is more common in African Americans than in any other racial/ethnic group in the United States (33), and cigarette smoking prevalence does not by itself provide a viable explanation for this observation (34). Previous studies indicated that among smokers, African Americans were more susceptible to lung cancer than whites (35). Among the smokers, the relative risk of lung cancer is significantly higher in both African American males (RR = 1.67) and African American females (RR = 1.20), compared to white males or females (35). The increased risk is more prominent among light smokers (pack-years < 30)(35). Among former smokers, the relative risk of lung cancer is 1.30 and 1.44 in African American men and African American women respectively, compared to white men and women (36). The explanation for the observed racial variation in lung cancer susceptibility remains to be determined. One possible explanation for this disparity in lung cancer risk is that African American smokers are more susceptible to lung carcinogens from cigarette smoke than white smokers.
Genetically-mediated host factors may modulate the carcinogenic effect of tobacco smoke, and these host factors could distribute differently among racial groups. There is compelling evidence to indicate that the distribution of genetic polymorphisms throughout the human genome follows ethnic and/or racial composition of populations (37;38) and these genetic variations may be associated with a difference in risk for disease among the racial groups (39). For example, some studies have reported ethnic variation in blood levels of nicotine and cotinine after controlling for cigarette consumption (40). CYP2A6, the primary nicotine metabolic enzyme, shows significant allelic variation among racial and ethnic groups (41). Documented differences in allele frequencies between African Americans and whites for genes involved in DNA repair (42) and hormone metabolism (43) also have been shown to contribute to differences in lung cancer (44), breast cancer (42;45), and prostate cancer (46) risk. Our group has previously reported that haplotypes of TP53 were significantly associated with lung cancer risk in African Americans, but not in Caucasians (47). TP53 protein plays a key role in DNA repair and cell cycle control.
Cell cycle checkpoints regulate progression through the cell cycle, ensuring that each step takes place only once and in the right sequence. It has long been known that DNA-damaging agents induce a cell cycle arrest, buying time for repair, and thus, protecting the organism from the deleterious consequences of mutations (27;48). Deficient or “leaky” cell cycle checkpoints could lead to significant accumulation of genetic mutations when the host is exposed to carcinogens, i.e., cigarette smoking, and consequently increasing cancer risk further. Our data suggest that deficiency in DNA damage-induced G2/M checkpoint function may contribute to the increased susceptibility to lung cancer in African American women. If confirmed by other studies, these data provide some clues to the relatively high lung cancer incidence experienced by African American women.
We observed no significant association between the efficiency of DNA damage-induced G2/M arrest and lung cancer risk in Caucasians. In a large case-control study of predominantly Caucasian subjects, Xing et al reported that a less efficient G2/M checkpoint was associated with a modestly increased lung cancer risk (OR = 1.28) in Caucasians and further analyses indicated that the case-control difference in the percent of G2/M cell accumulation was only significant in Caucasian women, but not in Caucasian men (29). They did not report the estimated odds ratio for Caucasian women. Although we did not find a significant association between G2/M checkpoint and lung cancer risk in Caucasians, we did observe a borderline significant (P = 0.07) case-control difference of mean percent G2/M arrest in Caucasian women.
The genotype-phenotype associations observed in this study support our hypothesis that polymorphisms in genes involving in DNA damage response affect the function of the cell cycle checkpoint. We found that the mean percent of DNA damage-induced G2/M arrest differs significantly by genotypes of 10 SNPs of 6 genes (ATM, BRCA2, CDC25C, CDKN1A, TP53, TP53BP1, Table 4). Logistic regression analysis found that SNPs in ERCC6 were significantly associated with the DNA damage-induced G2/M arrest phenotype. However, the association between G2/M arrest and any individual SNP was modest. For example, the risk of having a less-efficient G2/M arrest was not significant when considering TP53 P72R or TP53BP1 IVS2+7G>A separately. When genotypes were combined and the effects were assessed by total number of adverse genotypes across a panel of genes, a consistent trend of strong associations were presented. The rationale for combining multiple SNPs for analysis is based on the concept that proteins of the cell cycle checkpoint and DNA repair pathways cooperate to carry out their highly coordinated functions. For example, it is possible that a less efficient variant TP53BP1 protein will have a diminished ability to recruit other proteins to activate p53, and a less efficient ERCC6 will not be able to coordinate competently the repair processes. Individuals carrying the multiple less efficient variant forms of these gene products will be at greater risk to have dysfunctional cell cycle control, hence increased cancer risk. Our data support this hypothesis.
Genetic polymorphisms have been intensively studied in terms of their associations with risk of various cancers (49). The rationale behind these gene-cancer risk associations is that these genetic polymorphisms may result in alterations in gene products (i.e. protein structures) that affect the phenotypes (i.e. DNA repair capacity). However, the functions or phenotypes of the majority of these genetic polymorphisms are unknown and data on genotype-phenotype correlation are sparse. Two recent studies have examined the correlations between genetic variants in nucleotide excision repair pathway and BPDE-mutagen sensitivity and BPDE-induced DNA adducts level in cultured blood lymphocytes (50;51). Lin et al reported that several SNPs in XPC, XPA and RAD23B were associated with mutagen sensitivity phenotype, and combined analysis of multiple SNPs revealed a significant dose-response relationship between increasing mutagen sensitivity with increasing number of adverse genotypes (51). In a separate study, Zhao et al reported that the genotypes and haplotypes of ERCC1 and XPD is significantly associated with level of BPDE-induced DNA adducts in cultured peripheral blood lymphocytes. Both mutagen sensitivity and BPDE-induced DNA adduct levels are considered reflective of the cellular DNA repair capacity. In the present study, we demonstrated that genetic polymorphisms in cell cycle control/DNA repair pathways are associated with the function of G2/M checkpoint. Together, these data indicate that intermediate phenotypes of cancer susceptibility are useful tools to characterize potential function of SNPs, and to further the understanding of genetic contributions to lung cancer risk.
Our study has moderate sample size and this limited our ability to consider adjustment for multiple comparisons for the genotype-phenotype correlation analysis. There is a chance of reporting false positive association between the SNPs and G2/M arrest phenotype. In the present study, a total of 49 SNPs were examined using a p-value ≤0.05, thus the expected number of false positive SNPs is 3 (0.05 × 49 = 3). The observed number of positive SNPs (N = 13) with a p-value ≤ 0.05 is much larger than expected by chance (N = 3), suggesting that many of the identified SNPs are potentially true positive SNPs. The significant dose response relationship observed in the analysis of combined effects of 4 positive SNPs provided further evidence of true association (Table 6). Future larger studies are warranted to validate these new findings.
In summary, we have reported that a less-efficient G2/M checkpoint is significantly associated with lung cancer risk in African American women. Our data also suggest that genetic polymorphisms in ATM, BRCA2, CDC25C, CDKN1A, ERCC6, TP53 and TP53BP1 modulate the G2/M checkpoint function. Importantly, we found that the combination of multiple SNPs in the cell cycle control/DNA repair pathway is strongly associated with DNA damage-induced G2/M arrest phenotype. Future studies are warranted to further examine evidence supporting the hypothesis that genotypic and phenotypic differences underlie the observed disparities in lung cancer incidence between African Americans and Caucasians.
Supplementary Material
Acknowledgments
We thank Terrence Clemmons, Candice Collins, Bonnie Cooper, Laura Hall, Carolyn Harris, Daniel Harris, Mike Mullins, Dawn Tucker and Jonas Nelson for recruiting study subjects, and Betty Williams for data coding and editing. We thank John Cottrell for processing and handling the samples and Audrey Salabes for examining medical records. The assistance of the physicians and staff of the following hospitals: Baltimore Veterans Administration Medical Center, Bon Secours Hospital, Harbor Hospital Center, Johns Hopkins Bayview Medical Center, The Johns Hopkins Hospital and the University of Maryland Medical Center, and Sinai Hospital have made this study possible. This project is supported by intramural fund of US National Cancer Institute and a grant from the National Center for Minority Health and Health Disparities.
Abbreviations
- SNPs
Single Nucleotide Polymorphisms
- Arg
arginine
- Pro
proline
- HWE
Hardy-Weinberg equilibrium
Footnotes
Brief Statement: This study provides evidence that less efficient G2/M checkpoint is significantly associated with lung cancer risk in African American women. Common genetic polymorphisms in genes involving DNA repair and cell cycle control are associated with DNA damage-induced G2/M arrest phenotype.
References
- 1.Jemal A, Siegel R, Ward E, Hao Y, Xu J, Murray T, Thun MJ. Cancer statistics, 2008. CA Cancer J Clin. 2008;58:71–96. doi: 10.3322/CA.2007.0010. [DOI] [PubMed] [Google Scholar]
- 2.Mattson ME, Pollack ES, Cullen JW. What are the odds that smoking will kill you? Am J Public Health. 1987;77:425–31. doi: 10.2105/ajph.77.4.425. [DOI] [PMC free article] [PubMed] [Google Scholar]
- 3.Matakidou A, Eisen T, Houlston RS. Systematic review of the relationship between family history and lung cancer risk. Br J Cancer. 2005;93:825–33. doi: 10.1038/sj.bjc.6602769. [DOI] [PMC free article] [PubMed] [Google Scholar]
- 4.Spitz MR, Wei Q, Dong Q, Amos CI, Wu X. Genetic susceptibility to lung cancer: the role of DNA damage and repair. Cancer Epidemiol Biomarkers Prev. 2003;12:689–98. [PubMed] [Google Scholar]
- 5.Neumann AS, Sturgis EM, Wei Q. Nucleotide excision repair as a marker for susceptibility to tobacco-related cancers: a review of molecular epidemiological studies. Mol Carcinog. 2005;42:65–92. doi: 10.1002/mc.20069. [DOI] [PubMed] [Google Scholar]
- 6.Hartwell LH, Kastan MB. Cell cycle control and cancer. Science. 1994;266:1821–8. doi: 10.1126/science.7997877. [DOI] [PubMed] [Google Scholar]
- 7.Hartwell LH, Weinert TA. Checkpoints: controls that ensure the order of cell cycle events. Science. 1989;246:629–34. doi: 10.1126/science.2683079. [DOI] [PubMed] [Google Scholar]
- 8.Schwartz GK, Shah MA. Targeting the cell cycle: a new approach to cancer therapy. J Clin Oncol. 2005;23:9408–21. doi: 10.1200/JCO.2005.01.5594. [DOI] [PubMed] [Google Scholar]
- 9.DiPaola RS. To arrest or not to G(2)-M Cell-cycle arrest : commentary re: A. K. Tyagi et al., Silibinin strongly synergizes human prostate carcinoma DU145 cells to doxorubicin-induced growth inhibition, G(2)-M arrest, and apoptosis. Clin. cancer res. 8:3512–3519, 2002. Clin Cancer Res. 2002;8:3311–4. [PubMed] [Google Scholar]
- 10.Kuerbitz SJ, Plunkett BS, Walsh WV, Kastan MB. Wild-type p53 is a cell cycle checkpoint determinant following irradiation. Proc Natl Acad Sci U S A. 1992;89:7491–5. doi: 10.1073/pnas.89.16.7491. [DOI] [PMC free article] [PubMed] [Google Scholar]
- 11.Kastan MB, Onyekwere O, Sidransky D, Vogelstein B, Craig RW. Participation of p53 protein in the cellular response to DNA damage. Cancer Res. 1991;51:6304–11. [PubMed] [Google Scholar]
- 12.Hollstein M, Sidransky D, Vogelstein B, Harris CC. p53 mutations in human cancers. Science. 1991;253:49–53. doi: 10.1126/science.1905840. [DOI] [PubMed] [Google Scholar]
- 13.Livingstone LR, White A, Sprouse J, Livanos E, Jacks T, Tlsty TD. Altered cell cycle arrest and gene amplification potential accompany loss of wild-type p53. Cell. 1992;70:923–35. doi: 10.1016/0092-8674(92)90243-6. [DOI] [PubMed] [Google Scholar]
- 14.Kessis TD, Slebos RJ, Nelson WG, Kastan MB, Plunkett BS, Han SM, Lorincz AT, Hedrick L, Cho KR. Human papillomavirus 16 E6 expression disrupts the p53-mediated cellular response to DA damage. Proc Natl Acad Sci U S A. 1993;90:3988–92. doi: 10.1073/pnas.90.9.3988. [DOI] [PMC free article] [PubMed] [Google Scholar]
- 15.Smith GC, Divecha N, Lakin ND, Jackson SP. DNA-dependent protein kinase and related proteins. Biochem Soc Symp. 1999;64:91–104. [PubMed] [Google Scholar]
- 16.Rotman G, Shiloh Y. ATM: a mediator of multiple responses to genotoxic stress. Oncogene. 1999;18:6135–44. doi: 10.1038/sj.onc.1203124. [DOI] [PubMed] [Google Scholar]
- 17.Bell DW, Varley JM, Szydlo TE, Kang DH, Wahrer DC, Shannon KE, Lubratovich M, Verselis SJ, Isselbacher KJ, Fraumeni JF, Birch JM, Li FP, et al. Heterozygous germ line hCHK2 mutations in Li-Fraumeni syndrome. Science. 1999 Dec 24;286:2528–31. doi: 10.1126/science.286.5449.2528. [DOI] [PubMed] [Google Scholar]
- 18.Parshad R, Sanford KK, Jones GM. Chromosomal radiosensitivity during the G2 cell-cycle period of skin fibroblasts from individuals with familial cancer. Proc Natl Acad Sci U S A. 1985;82:5400–3. doi: 10.1073/pnas.82.16.5400. [DOI] [PMC free article] [PubMed] [Google Scholar]
- 19.Knight RD, Parshad R, Price FM, Tarone RE, Sanford KK. X-ray-induced chromatid damage in relation to DNA repair and cancer incidence in family members. Int J Cancer. 1993;54:589–93. doi: 10.1002/ijc.2910540412. [DOI] [PubMed] [Google Scholar]
- 20.Canman CE, Lim DS. The role of ATM in DNA damage responses and cancer. Oncogene. 1998;17:3301–8. doi: 10.1038/sj.onc.1202577. [DOI] [PubMed] [Google Scholar]
- 21.Nagasawa H, Latt SA, Lalande ME, Little JB. Effects of X-irradiation on cell-cycle progression, induction of chromosomal aberrations and cell killing in ataxia telangiectasia (AT) fibroblasts. Mutat Res. 1985;148:71–82. doi: 10.1016/0027-5107(85)90209-x. [DOI] [PubMed] [Google Scholar]
- 22.Sanford KK, Parshad R, Price FM, Jones GM, Tarone RE, Eierman L, Hale P, Waldmann TA. Enhanced chromatid damage in blood lymphocytes after G2 phase × irradiation, a marker of the ataxia-telangiectasia gene. J Natl Cancer Inst. 1990;82:1050–4. doi: 10.1093/jnci/82.12.1050. [DOI] [PubMed] [Google Scholar]
- 23.Taylor AM, Metcalfe JA, McConville C. Increased radiosensitivity and the basic defect in ataxia telangiectasia. Int J Radiat Biol. 1989;56:677–84. doi: 10.1080/09553008914551901. [DOI] [PubMed] [Google Scholar]
- 24.Jiang W, Zhang YJ, Kahn SM, Hollstein MC, Santella RM, Lu SH, Harris CC, Montesano R, Weinstein IB. Altered expression of the cyclin D1 and retinoblastoma genes in human esophageal cancer. Proc Natl Acad Sci U S A. 1993;90:9026–30. doi: 10.1073/pnas.90.19.9026. [DOI] [PMC free article] [PubMed] [Google Scholar]
- 25.Wei Q, Cheng L, Amos CI, Wang LE, Guo Z, Hong WK, Spitz MR. Repair of tobacco carcinogen-induced DNA adducts and lung cancer risk: a molecular epidemiologic study. J Natl Cancer Inst. 2000;92:1764–72. doi: 10.1093/jnci/92.21.1764. [DOI] [PubMed] [Google Scholar]
- 26.Liu MC, Gelmann EP. P53 gene mutations: case study of a clinical marker for solid tumors. Semin Oncol. 2002;29:246–57. doi: 10.1053/sonc.2002.32900. [DOI] [PubMed] [Google Scholar]
- 27.Molinari M. Cell cycle checkpoints and their inactivation in human cancer. Cell Prolif. 2000;33:261–74. doi: 10.1046/j.1365-2184.2000.00191.x. [DOI] [PMC free article] [PubMed] [Google Scholar]
- 28.Zheng YL, Loffredo CA, Alberg AJ, Yu Z, Jones RT, Perlmutter D, Enewold L, Krasna MJ, Yung R, Shields PG, Harris CC. Less efficient g2-m checkpoint is associated with an increased risk of lung cancer in African Americans. Cancer Res. 2005;65:9566–73. doi: 10.1158/0008-5472.CAN-05-1003. [DOI] [PMC free article] [PubMed] [Google Scholar]
- 29.Xing J, Spitz MR, Lu C, Zhao H, Yang H, Wang W, Stewart DJ, Wu X. Deficient G2-M and S checkpoints are associated with increased lung cancer risk: a case-control analysis. Cancer Epidemiol Biomarkers Prev. 2007;16:1517–22. doi: 10.1158/1055-9965.EPI-07-0111. [DOI] [PubMed] [Google Scholar]
- 30.Zheng YL, Loffredo CA, Yu Z, Jones RT, Krasna MJ, Alberg AJ, Yung R, Perlmutter D, Enewold L, Harris CC, Shields PG. Bleomycin-induced chromosome breaks as a risk marker for lung cancer: A case-control study with population and hospital controls. Carcinogenesis. 2003;24:269–74. doi: 10.1093/carcin/24.2.269. [DOI] [PubMed] [Google Scholar]
- 31.Morin PA, Saiz R, Monjazeb A. High-throughput single nucleotide polymorphism genotyping by fluorescent 5′ exonuclease assay. Biotechniques. 1999;27:538–40. 542, 544. doi: 10.2144/99273rr02. [DOI] [PubMed] [Google Scholar]
- 32.Matakidou A, el GR, Webb EL, Rudd MF, Bridle H, Eisen T, Houlston RS. Genetic variation in the DNA repair genes is predictive of outcome in lung cancer. Hum Mol Genet. 2007;16:2333–40. doi: 10.1093/hmg/ddm190. [DOI] [PubMed] [Google Scholar]
- 33.Ries L, Melbert D, Krapcho M. SEER cancer statistics review, 1975–2004. Bethesda, MD: National Cancer Institute; 2006. [Google Scholar]
- 34.Pinsky PF. Racial and ethnic differences in lung cancer incidence: how much is explained by differences in smoking patterns? (United States) Cancer Causes Control. 2006;17:1017–24. doi: 10.1007/s10552-006-0038-2. [DOI] [PubMed] [Google Scholar]
- 35.Haiman CA, Stram DO, Wilkens LR, Pike MC, Kolonel LN, Henderson BE, Le ML. Ethnic and racial differences in the smoking-related risk of lung cancer. N Engl J Med. 2006;354:333–42. doi: 10.1056/NEJMoa033250. [DOI] [PubMed] [Google Scholar]
- 36.Risch N. Dissecting racial and ethnic differences. N Engl J Med. 2006;354:408–11. doi: 10.1056/NEJMe058265. [DOI] [PubMed] [Google Scholar]
- 37.Weber WW. Populations and genetic polymorphisms. Mol Diagn. 1999;4:299–307. doi: 10.154/MODI00400299. [DOI] [PubMed] [Google Scholar]
- 38.Garte S. The role of ethnicity in cancer susceptibility gene polymorphisms: the example of CYP1A1. Carcinogenesis. 1998;19:1329–32. doi: 10.1093/carcin/19.8.1329. [DOI] [PubMed] [Google Scholar]
- 39.Shields PG, Harris CC. Cancer risk and low-penetrance susceptibility genes in gene-environment interactions. J Clin Oncol. 2000;18:2309–15. doi: 10.1200/JCO.2000.18.11.2309. [DOI] [PubMed] [Google Scholar]
- 40.Benowitz NL, Perez-Stable EJ, Herrera B, Jacob P., III Slower metabolism and reduced intake of nicotine from cigarette smoking in Chinese-Americans. J Natl Cancer Inst. 2002;94:108–15. doi: 10.1093/jnci/94.2.108. [DOI] [PubMed] [Google Scholar]
- 41.Nakajima M, Yokoi T. Interindividual variability in nicotine metabolism: C-oxidation and glucuronidation. Drug Metab Pharmacokinet. 2005;20:227–35. doi: 10.2133/dmpk.20.227. [DOI] [PubMed] [Google Scholar]
- 42.Duell EJ, Millikan RC, Pittman GS, Winkel S, Lunn RM, Tse CK, Eaton A, Mohrenweiser HW, Newman B, Bell DA. Polymorphisms in the DNA repair gene XRCC1 and breast cancer. Cancer Epidemiol Biomarkers Prev. 2001;10:217–22. [PubMed] [Google Scholar]
- 43.Kuehl P, Zhang J, Lin Y, Lamba J, Assem M, Schuetz J, Watkins PB, Daly A, Wrighton SA, Hall SD, Maurel P, Relling M, et al. Sequence diversity in CYP3A promoters and characterization of the genetic basis of polymorphic CYP3A5 expression. Nat Genet. 2001;27:383–91. doi: 10.1038/86882. [DOI] [PubMed] [Google Scholar]
- 44.Wu X, Zhao H, Amos CI, Shete S, Makan N, Hong WK, Kadlubar FF, Spitz MR. p53 Genotypes and Haplotypes Associated With Lung Cancer Susceptibility and Ethnicity. J Natl Cancer Inst. 2002;94:681–90. doi: 10.1093/jnci/94.9.681. [DOI] [PubMed] [Google Scholar]
- 45.Bailey LR, Roodi N, Verrier CS, Yee CJ, Dupont WD, Parl FF. Breast cancer and CYPIA1, GSTM1, and GSTT1 polymorphisms: evidence of a lack of association in Caucasians and African Americans. Cancer Res. 1998;58:65–70. [PubMed] [Google Scholar]
- 46.Tang YM, Green BL, Chen GF, Thompson PA, Lang NP, Shinde A, Lin DX, Tan W, Lyn-Cook BD, Hammons GJ, Kadlubar FF. Human CYP1B1 Leu432Val gene polymorphism: ethnic distribution in African-Americans, Caucasians and Chinese; oestradiol hydroxylase activity; and distribution in prostate cancer cases and controls. Pharmacogenetics. 2000;10:761–6. doi: 10.1097/00008571-200012000-00001. [DOI] [PubMed] [Google Scholar]
- 47.Mechanic LE, Bowman ED, Welsh JA, Khan MA, Hagiwara N, Enewold L, Shields PG, Burdette L, Chanock S, Harris CC. Common genetic variation in TP53 is associated with lung cancer risk and prognosis in African Americans and somatic mutations in lung tumors. Cancer Epidemiol Biomarkers Prev. 2007;16:214–22. doi: 10.1158/1055-9965.EPI-06-0790. [DOI] [PubMed] [Google Scholar]
- 48.Paulovich AG, Toczyski DP, Hartwell LH. When checkpoints fail. Cell. 1997;88:315–21. doi: 10.1016/s0092-8674(00)81870-x. [DOI] [PubMed] [Google Scholar]
- 49.Goode EL, Ulrich CM, Potter JD. Polymorphisms in DNA repair genes and associations with cancer risk. Cancer Epidemiol Biomarkers Prev. 2002;11:1513–30. [PubMed] [Google Scholar]
- 50.Zhao H, Wang LE, Li D, Chamberlain RM, Sturgis EM, Wei Q. Genotypes and haplotypes of ERCC1 and ERCC2/XPD genes predict levels of benzo[a]pyrene diol epoxide-induced DNA adducts in cultured primary lymphocytes from healthy individuals: a genotype-phenotype correlation analysis. Carcinogenesis. 2008;29:1560–6. doi: 10.1093/carcin/bgn089. [DOI] [PMC free article] [PubMed] [Google Scholar]
- 51.Lin J, Swan GE, Shields PG, Benowitz NL, Gu J, Amos CI, de AM, Spitz MR, Wu X. Mutagen sensitivity and genetic variants in nucleotide excision repair pathway: genotype-phenotype correlation. Cancer Epidemiol Biomarkers Prev. 2007;16:2065–71. doi: 10.1158/1055-9965.EPI-06-1041. [DOI] [PubMed] [Google Scholar]
Associated Data
This section collects any data citations, data availability statements, or supplementary materials included in this article.