Abstract
Here we describe methods to prepare a mammalian expression plasmid encoding EGFP fused to the amino terminus of human DNA topoisomerase IIα (TopoIIα). This plasmid is transfected into LLC-Pk cells, a porcine epithelial cell line that remains relatively flat during mitosis. After selection for stable integration, cells are cloned by serial dilution in microwells and used to grow a stable cell line expressing EGFP-TopoIIα. This line is termed LPk-GT2. Using photobleaching methods with conventional and patterned photobleaching LPk-GT2 cells are used demonstrate the rapid dynamics of TopoIIα exchange in both interphase nuclei and mitotic chromosomes. These rapid dynamics are dependent on enzyme activity since ICRF159 a catalytic inhibitor of TopoIIα, slows dynamics significantly.
Keywords: nucleus, chromosome, kinetochore, mitosis, fluorescence, photobleaching, FRAP
1. Introduction
DNA topoisomerase IIα (TopoIIα) is expressed primarily in actively dividing cells and shows dynamic changes at various stages of the cell cycle. In proliferating cells, both protein and message levels are low during the G1 phase and begin to rise during S phase, with a peak of protein expression during G2 and M phases 1–3. After mitosis TopoIIα reconcentrates in the nuclei, and subsequently during G1 message levels decrease and the protein is degraded by the proteasome 1–5. In interphase cells, antibody labeling and expression of tagged forms of the protein show that the enzyme is nuclear with a high concentration in the nucleolus 5–7. As the chromosomes condense during early mitosis, TopoIIα concentrates at centromeres and along the axes of the chromosome arms 7–10.
This pattern of association with mitotic chromosomes and the persistence of TopoIIα in salt- and DNAse-treated chromosome fractions led to the idea that TopoIIα might form a stable mitotic chromosome scaffold 11. To test this notion we and others created cell lines that express TopoIIα fused to fluorescent proteins that were then used for photobleaching analyses 5, 6, 12. Surprisingly, TopoIIα showed rapid turnover in photobleaching experiments in both interphase nuclei and in mitotic chromosomes. When inhibitors of topoisomerase II catalytic activity were applied to cells TopoIIα became stably anchored on chromatin in both interphase and mitotic cells 10. These observations led to the conclusion that TopoIIα exhibits rapid exchange on chromatin that is dependent on enzyme activity. Further studies have implicated TopoIIα in a host of important roles for chromatin regulation in interphase and mitosis 13–17. The dynamic exchange of TopoIIα on chromatin is likely to be a key factor in these functions. Finally several chemotherapeutic agents function through the activity of TopoIIα 18, 19.
Overexpression of TopoIIα in mammalian cells is toxic and induces apoptosis 20, 21. For this reason, establishment of cell lines stably expressing TopoIIα tagged with fluorescent proteins is dependent on spontaneous down regulation of the endogenous TopoIIα or by purposefully targeting endogenous gene expression 5, 12. Keeping in mind this caveat, the techniques described here will facilitate analysis of TopoIIα dynamics in living cells under various experimental conditions.
2. Materials
2.1. Construction of EGFP-TopoII plasmid
Reagents for Molecular Biology: Restriction enzymes (Kpn I, BamH I, Hind III and Sac II) from New England Biolabs; RNase-free DNase and Triazol reagent from Invitrogen; Gold Taq DNA polymerase from ABI, pCDNA3 plasmid from Invitrogen and pEGFP-C3 plasmid from Clontech.
-
Primers for PCR (Sigma-Genosis)
-
N-terminus:
IIa-B1 (sense) 5’-GGATCCGAAGTGTCACCATTGCAG
IIa-3.1 (antisense) 5’-GGTGGATCCAGCAATATCAT
-
C-terminus:
IIa-C1A (sense) 5’-GTGACAGTGAAGAAGACAGCAG
IIa-C18.1 (antisense) 5’-GCGGCCGCGGTTAAAACAGATCATCTTCATC
-
-
Primers to detect the exogenous TopoIIα
T1 (sense), 5’-GGTACCGATACCATGCGGGGTTCT
T2 (antisense) 5’-TAGCCATTTCGACCACCTGTCAC
2.2. Transfection of LLC-Pk cells and selection of stable line
Culture reagents are obtained from Gibco/Invitrogen. Culture medium for LLC-Pk cells consists of Dulbecco’s modified Eagle’s medium (DMEM), supplemented with 10% Fetal Bovine serum, 1× non-essential amino acids, 20 mM Hepes and antibiotics (penicillin 100 U/L and streptomycin 100 µg/ml)
Transfection medium – Plasmid DNA for transfection is prepared with Lipofectamine plus according the manufacturer’s directions in DMEM
Selection Medium – Complete culture medium containing 2 mg/ml G148
Cloning plates – Corning 96 well tissue culture plates
2.3 Imaging and photomanipulation
Medium for cell culture on the microscope: If a stage incubator is used that allows a CO2 atmosphere on the microscope stage, conventional CO2-requiring culture medium can be used. In most of our studies this approach has not been available. Instead we generally use a CO2-independent medium, L-15 containing 10% FBS and antibiotics.
Microscope logistics and temperature control: Generally inverted research grade inverted microscopes are suitable for high resolution imaging and photomanipulation of EGFP-TopoIIα. For LLC-Pk and other mammalian cells, the temperature of the stage must be maintained at or near 37°C. A number of approaches are possible. One solution is to employ a stage incubator. We have used stage insert heaters obtained from a variety of the microscope manufacturers. In addition we have used dedicated air curtain incubators such as the one provided by Nevtek (Model ASI 400). Surprisingly a simple hair dryer mounted on a ring stand with a variable rheostat to control output works well to maintain stage temperature. An electronic thermometer with a small probe that can be taped to the stage is useful to assess temperature. Finally since high resolution requires oil or water immersion objectives, it is essential to have either a stage incubator that heats the objective or to use a separate objective heater that will maintain temperature of the specimen just over the area being observed. We use one manufactured by Biopetech.
Preparation of glass coverslips for live cell microscopy: Due to the limited working distance of high resolution, high numerical aperture objectives, it is essential to culture cells on thin glass coverslips for imaging. We prepare 25 mm round number 1.5 glass coverslips (usually one box of approximately 100 coverslips) dropping them one by one by hand into a solution of 95% ethanol in a glass petri dish. Dropping them one by one prevents them from sticking together. The coverslips are rinsed twice with fresh 95% ethanol. The ethanol is removed from the glass petri dish containing the coverslips; the lid is placed on the petri dish, and the dish is placed into a cold drying oven. The heat is then turned on and the ethanol is allowed to evaporate for a few hours to overnight. The oven is then turned off and the petri dish is allowed to cool. The coverslips are now clean and sterile and ready to be used for cell culture.
Culture chambers for live cell microscopy: A variety of approaches and different types of microscope culture chamber systems have been developed. We use two approaches in our laboratory. We use commercial stainless steel chambers (Molecular Probes/Invitrogen) composed of two halves that screw together clamping a 25 mm coverslip on which cells are plated. The chambers are stored in 95% ethanol to maintain sterility. They are removed with tongs and allowed to dry in a tissue culture hood prior to use. A lower cost solution is to drill holes 18 – 20 mm in diameter in the bottom of a 35 mm plastic petri dish. Using a bead of silicone grease, a 25 mm glass coverslip is applied to the inside of the dish. The dish is sterilized by placing it upside down along with its lid on the surface of a UV light box for 10 minutes. If a high resolution objective with a very shallow shoulder is used that bumps into the cut hole in the dish, the coverslips can be mounted with a grease ring on the outside of the chamber. These chambers should always be placed inside a larger plastic petri dish while in the incubator since they occasionally leak. A final issue is evaporation leading to hypertonicity of the medium in the observation. Our usual solution is to cover the medium with a thin layer of mineral oil that must be spread evenly. An alternative is to apply a large coverslip to the top of the chamber but an air space invites condensation on the top coverslip. With the steel chambers it is possible to fill the medium to the level of a shelf inside the chamber on which a 25 mm coverslip can be rested in contact with the medium surface.
-
Photobleaching apparatus: We use two different systems for photobleaching both produced by Photonics Instruments, the Micropoint dye laser system and the Mosaic digital diaphragm system.
Micropoint dye laser system: This system uses a pulsed UV nitrogen laser to pump a small dye chamber that emits a visible wavelength beam. Different dyes provide different wavelengths that can be adapted for different fluorophores. The primary dye we use is Courmarin 440 which produces light at 440 nm. This wavelength is sufficiently different from the normal excitation wavelength of GFP that a notch filter can be used to pass 440 nm light while still reflecting nearly all the excitation light from the mercury light source used for imaging. Attenuation elements on the Mosaic system are empirically adjusted to allow photobleaching of EGFP in 3 to 10 pulses to be delivered at a repetition rate of 15 – 30 Hz.
Mosaic digital diaphragm system: This system uses a digital diaphragm to control the spread of light from an argon ion laser that emits at 495 nm. Minimum duration of the photobleaching pulse is empirically determined. For imaging with this system we use a spinning disk confocal microscope coupled with a diode laser having an output of 473 nm. The difference between the two wavelengths allows design of the light path such that filter cubes in the microscope do not move in between photobleaching and observation.
Imaging systems: We use ORCA-ER cameras (Hamamatsu). We use two imaging software packages, Metamorph from Molecular devices and Slidebook from Intelligent Imaging Innovations.
3. Methods
3.1 Construction of EGFP-TopoIIα plasmid
3.1.1 Construction of His-tagged TopoIIα plasmid
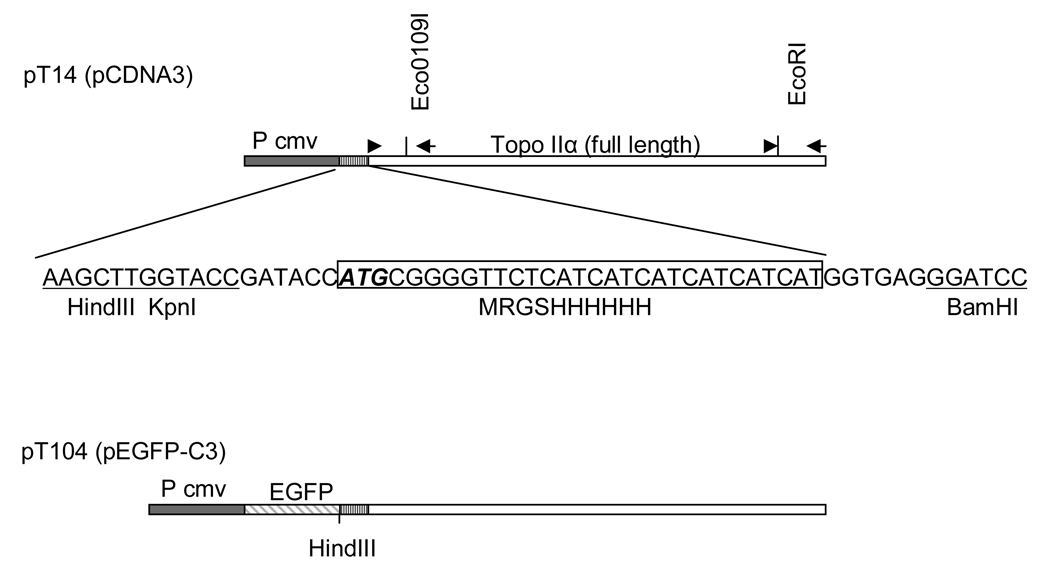
To tag human TopoIIα, we introduced the RGS-6xHis sequence (Qiagen) at Kpn I and BamH I sites of pCDNA3 to make an N-terminal tag (pCDNA3-His). A Kozak consensus sequence is also placed in front of the RGS-6xHis tag to improve translation.
To facilitate the subcloning of TopoIIα cDNA into pCDNA3-His, a BamH I site is introduced at the N-terminus of TopoIIα cDNA by PCR amplification, eliminating the first methionine (start codon) of TopoIIα. Similarly, the restriction sites Sac II and Not I are introduced at the C-terminus after the stop codon.
Sequences of the PCR products are verified by DNA sequencing. The resultant plasmid is named pT14. It carries full length TopoIIα cDNA in pCDNA3-His unidirectionally at BamH I and Not I sites without the start TopoIIα codon ATG.
3.1.2 Construction of EGFP-tagged TopoIIα
pT14 is digested to completion with Sac II and digested partially with Hind III.
The full length TopoIIα cDNA plus RGS-6xHis region is gel purified and ligated in frame to pEGFP-C3 at the Hind III and Sac II sites (Fig. 1). Although this construct contains an internal start codon (ATG) from the 6xHis tag, the internal translational product was never detected.
Fig. 1.
Production strategy used to create pT104 plasmid containing EGFP-TopoIIα for transfection to produce GT2-LPk cells. Primers used for amplifying the N- or C-terminal regions of TopoIIα by RT-PCR are shown as arrows. Restriction sites (Eco 0109I and EcoR I) are used for convenient cloning of PCR products. As indicated, both constructs use the same CMV promoter (Pcmv), but pT104 carries EGFP fused to TopoIIα. (Adapted from 24)
3.2 Transfection of LLC-Pk cells and selection of stable line
LLC-Pk cells are grown in 35 mm dishes in DMEM supplemented with 10% FBS and antibiotics until approximately 50% confluent.
To produce a stable cell line expressing EGFP–TopoIIα, LLC-Pk cells are transfected with pT104 plasmid encoding EGFP-TopoIIα at 1 ug/ml using Lipofectamine Plus according to the manufacturer's instructions. Following 3 hours in transfection medium, complete culture medium is added and the cells are cultured for 24 hours.
Cells are examined by brief exposure to fluorescent light to assess the overall transfection efficiency. If efficiency is 25% or greater, selection of stable lines is performed.
To select for cell lines expressing stably integrated plasmid, cells are then transferred to selection medium containing 2 mg/ml G418 and, after they have reached 80% confluence passaged once into 100 mm tissue culture dishes and cultured for an additional three days under selection.
To isolate colonies, cells are trypsinized and plated at an average density of 1/well in 96 well dishes. A portion of the remaining cells are frozen and the rest are plated to 100 mm dishes as a backup should the cloning be unsuccessful.
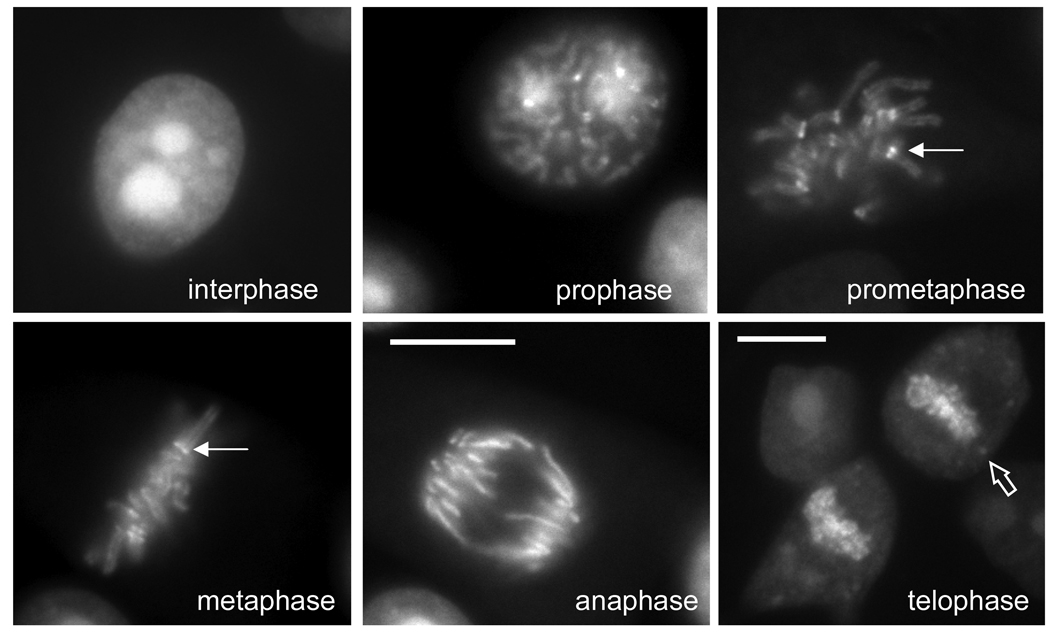
To identify single cell colonies, 96 well dishes are observed with a tissue culture microscope and wells with single cells marked. These cultures are maintained until individual cells in wells grow to confluence. Cells are transferred to 12 well dishes. Each well contains a 12 mm sterile circular coverslip covering a portion of the well. When cells from individual have populated the wells of the dish, the coverslip is removed and cells are assessed for expression and proper localization of EGFP-TopoIIα fluorescence (Fig. 2).
Wells containing colonies with proper expression of EGFP-TopoIIα in interphase nuclei and mitotic chromosomes are grown to confluence, FACS sorted to confirm and enrich EGFP-TopoIIα expressing cells and then transferred to larger dishes for expansion and freezing1.
Fig. 2.
EGFP– TopoIIα localization in a panel of living GT2-LPK cells at various stages of mitosis. EGFP–TopoIIα concentrates in the nucleus and particularly in the nucleoli of cells in interphase. It associates with chromosomes in prophase, becoming concentrated at kinetochores (closed arrows) and along chromosome arms in prometaphase and metaphase. During anaphase the kinetochore concentration decreases but EGFP–TopoIIα remains and is associated with the chromosome arms. In late anaphase and telophase, EGFP–TopoIIα remains associated with the decondensing chromosomes. Some TopoIIα appears in the cytoplasm with a portion becoming concentrated in cytoplasmic foci (open arrow). Bars = 10 µm. (Adapted from 5)
3.3 Imaging and photomanipulation
Cells are observed on a warm stage on an inverted microscope (e.g. Zeiss Axio Observer). When used with high numerical aperture water or oil immersion objectives, an objective heater is used.
Cells are imaged by fluorescence, phase contrast or DIC microscopy for targeting regions for photobleaching. To limit phototoxicity and photobleaching of EGFP, fluorescence exposures are minimized. Thus we generally target with phase contrast microscopy and capture a prebleach fluorescence image immediately before photobleaching.
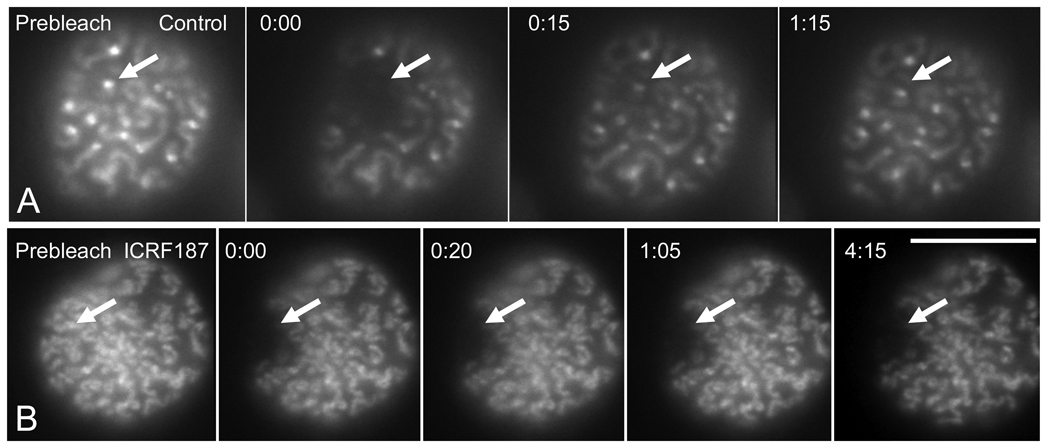
When using the nitrogen laser-pumped dye laser (Micropoint, Photonic Instruments), we generally bleach by delivering 3–8 pulses at a repetition rate of 30 Hz. The laser is attenuated to the appropriate level with neutral density filters. Levels that cause photobleaching without cytotoxicity are determined empirically (Fig. 3).
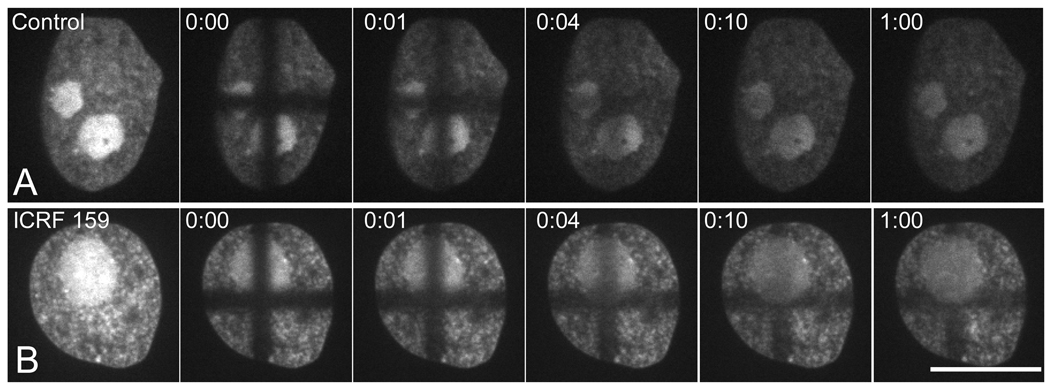
When using pattern photobleaching with the digital light processor-modulated system (Mosaic, Photonic Instruments), we typically collect fluorescent images every 500 milliseconds prior to and after the photobleaching pulse. We create a photobleaching pattern template to target specific regions prior to data collection so that any delay during image acquisition due to the argon laser pulse is minimal. The template is drawn using a phase contrast or fluorescence image of the sample captured immediately before photobleaching. The photobleaching pulse duration of the argon laser is empirically determined, but generally ranges between 200 and 600 milliseconds (Fig. 4).
Fig. 3.
Recovery of EGFP–TopoIIα fluorescence on kinetochores and chromosome arms after photobleaching occurs rapidly and is slowed by catalytic inhibitors of TopoIIα enzyme activity. (A) Targeting of kinetochores (arrows) and chromosome arms at prophase using point photobleaching with the Micropoint dye laser. (B) The topoisomerase II inhibitor ICRF187 shows a general reduction in the extent of chromosome condensation in prophase nuclei. ICRF187 treatment greatly slows recovery after photobleaching. Images include a prebleach image, one taken just after photobleaching (0 time) and images taken during recovery. Time is depicted as minutes:seconds after photobleaching. Bar = 10 µm. (Adapted from 5)
Fig. 4.
Recovery of EGFP–TopoIIα fluorescence in interphase nuclei using pattern photobleaching with the Mosaic argon laser system. (A) Control cell nucleus shows rapid recovery of fluorescence after photobleaching (B) The topoisomerase II inhibitor ICRF159 causes a change in TopoIIα distribution in interphase nuclei resulting in a more granular appearance and a relative decrease in concentration of TopoIIα in the nucleolus. ICRF159 greatly slows recovery of photobleaching in the nucleus although recovery is somewhat more rapid within the nucleolus even in the presence of the drug. Images include a prebleach image, one taken just after photobleaching (0 time) and images taken during recovery. Time is depicted as minutes:seconds after photobleaching. Bar = 10 µm.
3.4 Data analysis
Metamorph and Slidebook software were used for data collection and analysis. An area that includes but is larger than the target area is used for subtraction of local cytoplasmic background using the procedures described Howell et al 22 according to the equation FS − FBG = FS − (FL − FS) × AS / (AL − AS) where FS is the average fluorescence intensity within the target bleach zone, FL is the average intensity in the larger background area, AS is the area of the target bleach zone and AL is the area of the larger background zone. This generates the final intensity minus the background FS − FBG.
Acquisitions are also normalized to adjust for reduction of total cellular fluorescence due to photobleaching and image acquisition according to the procedures of Phair and Misteli 23 using the equation Fn = Ft × T0 / F0 × Tt where Fn is the normalized fluorescence intensity in the bleach zone, Ft is the average intensity in the bleach zone at time point t, F0 is the average intensity in the target bleach zone before photobleaching, Tt is the total cellular intensity at time point t and T0 is the total cellular intensity before photobleaching and long term imaging. Integrated intensities of the target and background regions and their associated area measurements are logged to Excel spreadsheets.
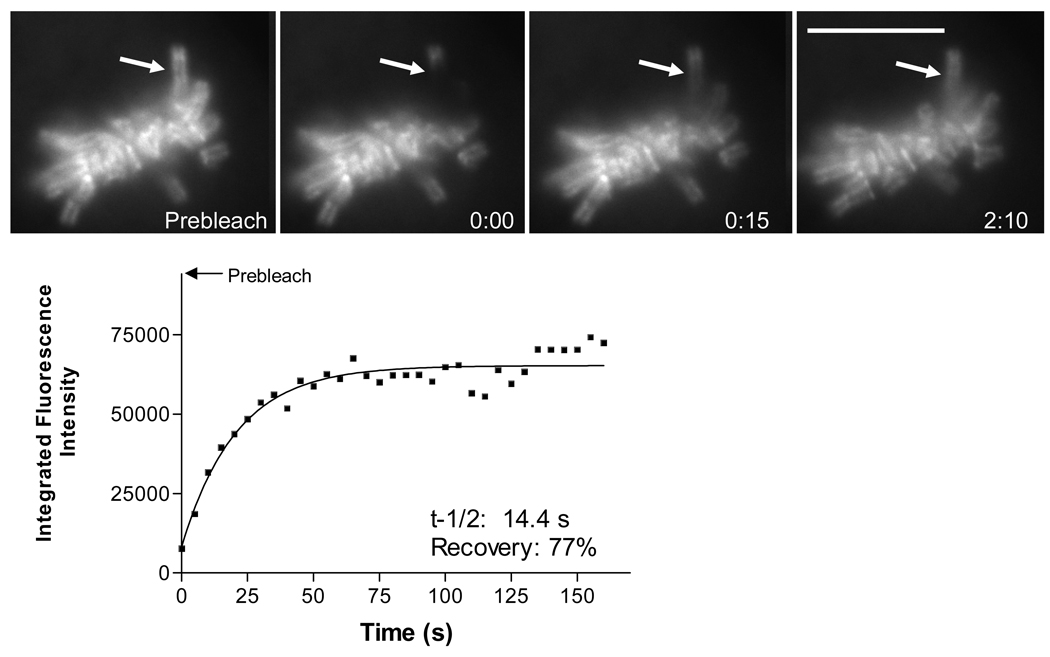
Analysis of photobleaching recovery half-times and percent recovery is carried out using the methodology described by Howell et al. 22 using normalized relative intensity values. The equation Finf − F(t) = [Finf − F(0)]e−kt describes the perturbation-relaxation for fluorescence recovery after photobleaching where Finf is the normalized intensity of the photobleached area after maximum recovery, F(0) is the normalized intensity at t = 0 after photobleaching. Normalized relative fluorescence intensity values are exported to GraphPad Prism software and the rate constant k is determined by nonlinear regression.
Half time for recovery is calculated using t1/2 = ln2/k. Percent recovery is determined by the equation Finf − F(0)/ F(p) − F(0) where F(p) is the prebleach intensity at the target (Fig. 5).
Fig. 5.
Data analysis of photobleaching and recovery of EGFP-TopoIIα in metaphase chromosome arm. Images show a prebleach image and images taken at photobleaching and after for an isolated chromosome arm extending from the metaphase arrayed chromosomes. The graph shows the fitting of corrected intensity measurements in the photobleached region to determine recovery half times (t-1/2) and total degree of recovery (recovery). Bar = 10 µm. (Adapted from 5)
4. Notes
Because overexpression of TopoIIα is toxic, selection for EGFP-TopoIIα expression also selects for down regulation of endogenous TopoIIα expression.
A supplementary means for selection for lines expressing appropriate levels of EGFP-TopoIIα is fluorescence-activated cell sorting (FACS). FACS is also useful if cells are cultured for many passages which sometimes leads to the development of non-expressing cells that retain G418-resistance.
Acknowledgments
Support was provided by the National Institutes of General Medical Sciences, from the Oklahoma Medical Research Foundation and from the McCasland Foundation. We thank Dr. Penny Tavormina for helpful suggestions.
References
- 1.Goswami PC, Roti Roti JL, Hunt CR. The cell cycle-coupled expression of topoisomerase IIalpha during S phase is regulated by mRNA stability and is disrupted by heat shock or ionizing radiation. Mol Cell Biol. 1996;16:1500–1508. doi: 10.1128/mcb.16.4.1500. [DOI] [PMC free article] [PubMed] [Google Scholar]
- 2.Heck MM, Hittelman WN, Earnshaw WC. Differential expression of DNA topoisomerases I and II during the eukaryotic cell cycle. Proc Natl Acad Sci U S A. 1988;85:1086–1090. doi: 10.1073/pnas.85.4.1086. [DOI] [PMC free article] [PubMed] [Google Scholar]
- 3.Isaacs RJ, Davies SL, Sandri MI, Redwood C, Wells NJ, Hickson ID. Physiological regulation of eukaryotic topoisomerase II. Biochim Biophys Acta. 1998;1400:121–137. doi: 10.1016/s0167-4781(98)00131-6. [DOI] [PubMed] [Google Scholar]
- 4.Salmena L, Lam V, McPherson JP, Goldenberg GJ. Role of proteasomal degradation in the cell cycle-dependent regulation of DNA topoisomerase IIalpha expression. Biochem Pharmacol. 2001;61:795–802. doi: 10.1016/s0006-2952(01)00580-9. [DOI] [PubMed] [Google Scholar]
- 5.Tavormina PA, Come MG, Hudson JR, Mo YY, Beck WT, Gorbsky GJ. Rapid exchange of mammalian topoisomerase II alpha at kinetochores and chromosome arms in mitosis. J Cell Biol. 2002;158:23–29. doi: 10.1083/jcb.200202053. [DOI] [PMC free article] [PubMed] [Google Scholar]
- 6.Christensen MO, Larsen MK, Barthelmes HU, et al. Dynamics of human DNA topoisomerases IIalpha and IIbeta in living cells. J Cell Biol. 2002;157:31–44. doi: 10.1083/jcb.200112023. [DOI] [PMC free article] [PubMed] [Google Scholar]
- 7.Null AP, Hudson J, Gorbsky GJ. Both alpha and beta isoforms of mammalian DNA topoisomerase II associate with chromosomes in mitosis. Cell Growth Differ. 2002;13:325–333. [PubMed] [Google Scholar]
- 8.Rattner JB, Hendzel MJ, Furbee CS, Muller MT, Bazett-Jones DP. Topoisomerase II alpha is associated with the mammalian centromere in a cell cycle- and species-specific manner and is required for proper centromere/kinetochore structure. J Cell Biol. 1996;134:1097–1107. doi: 10.1083/jcb.134.5.1097. [DOI] [PMC free article] [PubMed] [Google Scholar]
- 9.Sumner AT. The distribution of topoisomerase II on mammalian chromosomes. Chromosome Res. 1996;4:5–14. doi: 10.1007/BF02254938. [DOI] [PubMed] [Google Scholar]
- 10.Taagepera S, Rao PN, Drake FH, Gorbsky GJ. DNA topoisomerase II alpha is the major chromosome protein recognized by the mitotic phosphoprotein antibody MPM-2. Proc Natl Acad Sci U S A. 1993;90:8407–8411. doi: 10.1073/pnas.90.18.8407. [DOI] [PMC free article] [PubMed] [Google Scholar]
- 11.Earnshaw WC, Halligan B, Cooke CA, Heck MM, Liu LF. Topoisomerase II is a structural component of mitotic chromosome scaffolds. J Cell Biol. 1985;100:1706–1715. doi: 10.1083/jcb.100.5.1706. [DOI] [PMC free article] [PubMed] [Google Scholar]
- 12.Carpenter AJ, Porter AC. Construction, characterization, and complementation of a conditional-lethal DNA topoisomerase IIalpha mutant human cell line. Mol Biol Cell. 2004;15:5700–5711. doi: 10.1091/mbc.E04-08-0732. [DOI] [PMC free article] [PubMed] [Google Scholar]
- 13.Coelho PA, Queiroz-Machado J, Carmo AM, Moutinho-Pereira S, Maiato H, Sunkel CE. Dual role of topoisomerase II in centromere resolution and aurora B activity. PLoS Biol. 2008;6:e207. doi: 10.1371/journal.pbio.0060207. [DOI] [PMC free article] [PubMed] [Google Scholar]
- 14.Coelho PA, Queiroz-Machado J, Sunkel CE. Condensin-dependent localisation of topoisomerase II to an axial chromosomal structure is required for sister chromatid resolution during mitosis. J Cell Sci. 2003;116:4763–4776. doi: 10.1242/jcs.00799. [DOI] [PubMed] [Google Scholar]
- 15.Jonstrup AT, Thomsen T, Wang Y, Knudsen BR, Koch J, Andersen AH. Hairpin structures formed by alpha satellite DNA of human centromeres are cleaved by human topoisomerase IIalpha. Nucleic Acids Res. 2008;36:6165–6174. doi: 10.1093/nar/gkn640. [DOI] [PMC free article] [PubMed] [Google Scholar]
- 16.Takahashi Y, Strunnikov A. In vivo modeling of polysumoylation uncovers targeting of Topoisomerase II to the nucleolus via optimal level of SUMO modification. Chromosoma. 2008;117:189–198. doi: 10.1007/s00412-007-0137-1. [DOI] [PMC free article] [PubMed] [Google Scholar]
- 17.Warsi TH, Navarro MS, Bachant J. DNA topoisomerase II is a determinant of the tensile properties of yeast centromeric chromatin and the tension checkpoint. Mol Biol Cell. 2008;19:4421–4433. doi: 10.1091/mbc.E08-05-0547. [DOI] [PMC free article] [PubMed] [Google Scholar]
- 18.McClendon AK, Osheroff N. DNA topoisomerase II, genotoxicity, and cancer. Mutat Res. 2007;623:83–97. doi: 10.1016/j.mrfmmm.2007.06.009. [DOI] [PMC free article] [PubMed] [Google Scholar]
- 19.Montecucco A, Biamonti G. Cellular response to etoposide treatment. Cancer Lett. 2007;252:9–18. doi: 10.1016/j.canlet.2006.11.005. [DOI] [PubMed] [Google Scholar]
- 20.McPherson JP, Goldenberg GJ. Induction of apoptosis by deregulated expression of DNA topoisomerase IIalpha. Cancer Res. 1998;58:4519–4524. [PubMed] [Google Scholar]
- 21.Mo YY, Beck WT. Association of human DNA topoisomerase IIalpha with mitotic chromosomes in mammalian cells is independent of its catalytic activity. Exp Cell Res. 1999;252:50–62. doi: 10.1006/excr.1999.4616. [DOI] [PubMed] [Google Scholar]
- 22.Howell BJ, Hoffman DB, Fang G, Murray AW, Salmon ED. Visualization of Mad2 dynamics at kinetochores, along spindle fibers, and at spindle poles in living cells. J Cell Biol. 2000;150:1233–1250. doi: 10.1083/jcb.150.6.1233. [DOI] [PMC free article] [PubMed] [Google Scholar]
- 23.Phair RD, Misteli T. High mobility of proteins in the mammalian cell nucleus. Nature. 2000;404:604–609. doi: 10.1038/35007077. [DOI] [PubMed] [Google Scholar]
- 24.Mo YY, Ameiss KA, Beck WT. Overexpression of human DNA topoisomerase II alpha by fusion to enhanced green fluorescent protein. Biotechniques. 1998;25:1052–1057. doi: 10.2144/98256cr04. [DOI] [PubMed] [Google Scholar]


