Abstract
The use of contrast agents for neuroimaging is limited by the blood-brain barrier (BBB), which restricts entry into the brain. To administer imaging agents to the brain of rats, intracarotid infusions of hypertonic mannitol have been used to open the BBB. However, this technically challenging approach is invasive, opens only a limited region of the BBB, and is difficult to extend to mice. In this work, the BBB was opened in mice using unfocused ultrasound combined with an injection of microbubbles. This technique has several notable features: it (a) can be performed trans-cranially in mice; (b) takes only 3 minutes and uses only commercially available components; (c) opens the BBB throughout the brain; (d) causes no observed histological damage or changes in behavior (with peak-negative acoustic pressures of 0.36 MPa); and (e) allows recovery of the BBB within 4 hours. Using this technique, Gd-DTPA was administered to the mouse brain parenchyma, thereby shortening T1 and enabling the acquisition of high-resolution (52 × 52 × 100 micrometer3) images in 51 minutes in vivo. By enabling the administration of both existing anatomical contrast agents and the newer molecular/sensing contrast agents, this technique may be useful for the study of mouse models of neurological function and pathology with MRI.
INTRODUCTION
In the study of mouse models of neurological diseases, magnetic resonance microscopy (MRM) holds the promise of high-resolution, high-throughput, and longitudinal images of the mouse brain. However, the long T1 of the brain at high field has been a significant barrier. This problem has been addressed for fixed ex vivo specimens by “active staining” of the brain with T1-shortening contrast agents (1,2). However, this approach does not translate well in vivo because contrast agents are excluded from the brain by the blood-brain barrier.
The blood-brain barrier (BBB) consists of numerous specialized features of the brain’s vasculature that physically and physiologically restrict the passage of substances into the brain parenchyma. While the BBB serves a variety of important physiological functions, it also prevents the passage of most diagnostic and therapeutic agents (3–5).
In addition to blocking the gadolinium-based T1-shortening agents typically used for anatomical imaging, the BBB also obstructs functional agents, such as manganese (6), and the new generation of targeted agents, such as labeled iron oxides (7). Indeed, the potential of these agents in the study of neurodegenerative diseases by MRM may be limited by our ability to administer them to the brain of the mouse. To better study mouse models of human disease with MRI, a technique is needed to open the BBB in the mouse both quickly and non-invasively.
Many techniques have been tried to open the BBB. In the most common approach, a hypertonic sugar solution (e.g., arabinose or mannitol) is infused into the carotid artery (8). This osmotic technique has been used in many mammals—from rats to humans—however, it has several drawbacks: it is (a) time consuming; (b) technically challenging; (c) not readily performed on mice; (d) limited to only the middle and anterior portions of one half of the brain; and (e) too invasive for longitudinal studies in small animals (8).
Other experimental methods for opening the BBB include mild hyperthermia (9,10); direct intracerebral infusion (5); and use of inflammatory mediators such as bradykinin (11). However, these methods are currently too invasive and technically challenging to be useful for global BBB disruption in the mouse.
Another tool for opening the BBB is ultrasound—focused ultrasound (FUS)—can open the BBB without necessarily causing tissue damage (12,13). If the ultrasound is administered in combination with microbubbles (i.e., ultrasound contrast agents), the acoustic pressure required for BBB disruption is lower and therefore, this ultrasound-microbubble combination can be used to reliably open the BBB without causing tissue damage (14–17). However, most of this work has been performed in rabbits and has required surgical removal of a portion of the skull. Recently, transcranial ultrasound with microbubbles has been used to open the BBB to allow imaging agents into the brains of mice (18–20). Such techniques have even been used to administer molecular imaging agents and therapeutics to the brain of a mouse (21).
While BBB disruption with focused ultrasound and microbubbles is non-invasive and transcranial, it is still technically challenging and limited to the focal spots of the transducers (1–3 mm) (18,22,23). While such focal BBB disruption is useful for targeted delivery of therapeutic agents, for contrast-enhanced imaging of the brain, a global BBB disruption is needed. It is possible to open a larger region using focused ultrasound by moving the focus throughout the brain (20,24). Recent work has demonstrated rapid and automated mechanical scanning of the acoustic beam within an MRI system (25). However, until such sophisticated systems are widely available, there remains a need for a global BBB opening method that is both high-throughput and technically accessible to those outside the ultrasound research community.
In this work, we present a technique to open the BBB using unfocused ultrasound and microbubbles that is not only simple and fast, but also opens both hemispheres in a single insonification. Like many of the preceding techniques, it allows non-invasive, trancranial, and reversible BBB opening in mice; and it is therefore suitable for longitudinal studies. For simplicity, in this paper we refer to this technique of BBB Opening with Microbubbles and UltraSound as BOMUS. We employ the BOMUS technique to administer Gd-DTPA to the entire mouse brain. With the dramatically shortened T1, we are able to acquire high-resolution (50 × 50 × 100 µm) images in vivo in less than 1 hour.
METHODS
Microbubbles
Prior to opening the BBB, perflutren lipid microspheres (Definity, Lantheus, N. Billerica, MA) were produced by “activating” the vial (i.e., shaking it in the manufacturer-supplied device for 45 seconds) according to the prescribing information sheet. Immediately prior to microbubble administration, the vial was agitated by hand for 1 minute.
Ultrasound System
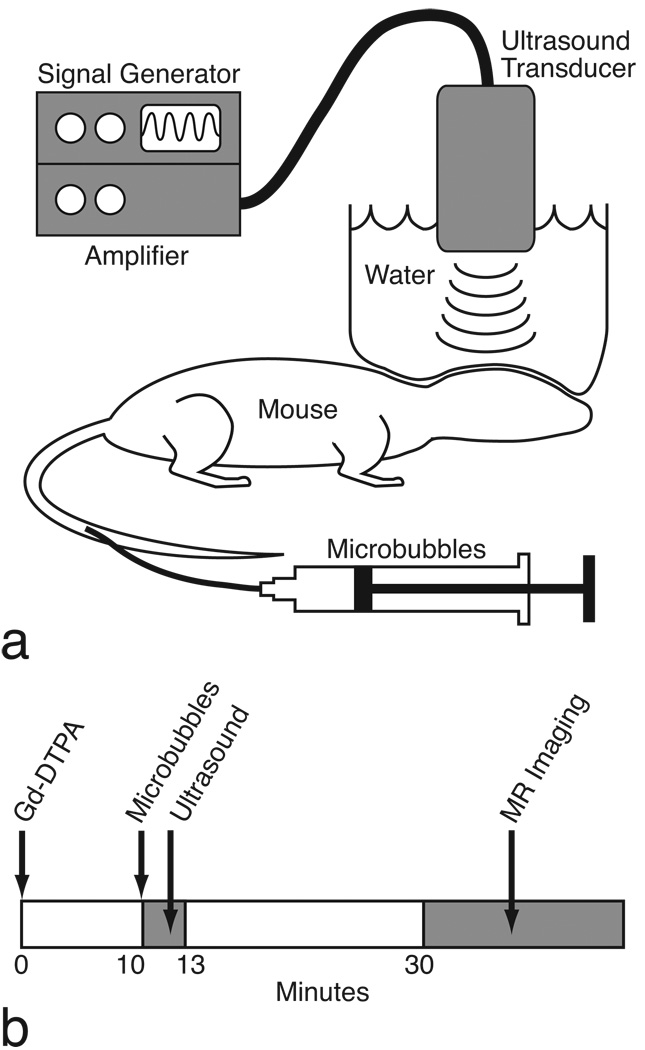
For insonification (Fig. 1), a circular single-element ultrasound transducer (model A382S-SU, Olympus NDT) was used, which had a diameter of 13 mm and a center frequency of 2.15 MHz. The transducer was positioned using a 3-axis frame (VisualSonics, Toronto, ON) at its natural focal distance (58 mm) in the water column directly over the mouse brain. The natural focus distance (i.e., the Rayleigh distance) was estimated as d2 / 4λ, where d is the element diameter and λ is the wavelength in water (26). The transducer was driven by a 50 dB power amplifier (model 240L, E&I, Rochester, NY), which was connected to a signal generator (model 33220A, Agilent, Santa Clara, CA) that produced the 3-minute ultrasound pulse sequence. Two pulse sequences were used with different acoustic pressures, but equivalent average power output. The pulse amplitude (mVpp) input into the power amplifier was calibrated using a hydrophone (described below) to generate peak-negative acoustic pressures of either 0.36 MPa or 0.52 MPa at the center of the transducer’s natural focus. These pressures were chosen based on transcranial mouse results from Choi et al. (18). Two sinusoidal pulse sequences of different pressures were used. The lower pressure sequence parameters were amplitude = 0.167 mVpp (0.36 MPa), pulse length = 50000 cycles (~23 ms), pulse repetition frequency (PRF) = 15.6 Hz; and the higher pressure sequence parameters were 0.258 mVpp (0.52 MPa), 32,000 cycles (~14 ms), 10 Hz. The PRF was selected so that each sequence applied an average power of approximately 2 W to the transducer—a power that was unlikely to damage the transducer. Pulse lengths were chosen to be on the order of 10 ms based on results from McDannold et al. (27) that found lower acoustic pressures were required for BBB opening with pulses lengths of 10 ms (as compared to 0.1 or 1 ms).
FIG. 1.
a: The BOMUS setup. b: Experimental time line.
The transducer was chosen to have (a) the minimum diameter that would cover the mouse brain and (b) the highest frequency that could open the BBB with skull-surface acoustic pressures in the range of 0.4–0.6 MPa. Because the diameter determines the natural focal length, using a smaller diameter permitted the logistical benefit of a shorter water column. Higher frequencies were preferred so as to minimize the potential for inertial cavitation of the microbubbles. However, in preliminary testing, frequencies higher than ~2.25 MHz (i.e., 3.5 and 5.0 MHz) were not as effective in opening the BBB when the transducers were calibrated to deliver acoustic pressures at the skull surface of 0.4–0.6 MPa. This target range was based on results by Choi et al (18). Furthermore, higher frequencies also required taller water columns.
Ultrasound Beam Characterization
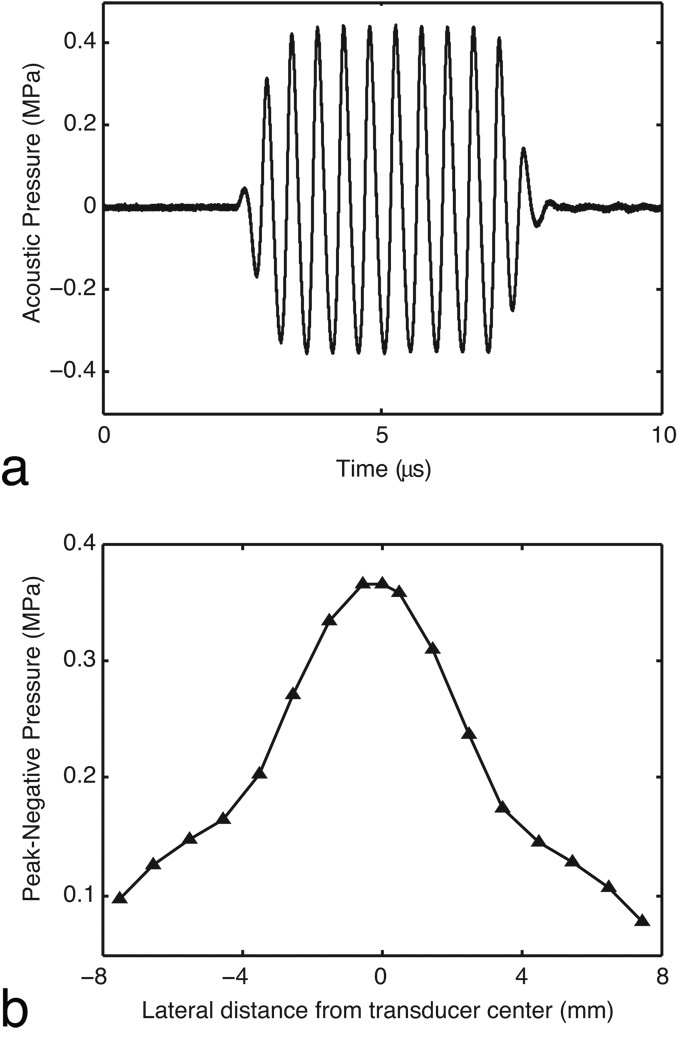
To calibrate the pulse amplitude (voltage applied to the power amplifier) with the acoustic pressure generated by the transducer, measurements were made in water using a hydrophone (model SN S4–251, Sonora, Longmont, CO) with a 0.4 mm spot size membrane. A step motor-controlled translation stage (Newport Corporation, Irvine, CA) operated by a custom LabVIEW program (National Instruments, Austin, TX) was used to move the transducer with respect to the hydrophone. The hydrophone was positioned at the center of the ultrasound beam at the transducer’s natural focal distance (i.e., the Rayleigh distance), 58 mm. Applying a 10-cycle sinusoidal pulse (PRF = 10 Hz), the acoustic amplitude scaled linearly (R2 = 0.9992) over the input range of 50 to 400 mVpp (Fig 2 a). Input voltages of 258 and 167 mVpp corresponded to peak-negative acoustic pressures of 0.52 and 0.36 MPa. At the natural focal distance, the beam’s lateral full-width-at-half-maximum was 7.4 mm (Fig. 2 b). At the center of the beam, measurements in the axial dimension were unchanged over the 1 cm beyond the natural focus.
FIG. 2.
The acoustic output of the ultrasound system was characterized in water using a hydrophone. a: The test pulse was a 10-cycle sinusoid (PRF = 10 Hz). An input voltage of 167 mVpp produced a peak negative pressure of 0.36 MPa. b: The lateral profile of the beam was measured at the transducers natural focus (58 mm).
BBB Opening with Microbubbles and Ultrasound (BOMUS)
All animal studies were approved by the Duke University Institutional Animal Care and Use Committee. A total of 26 C57BL/6 mice were used in this study. For all procedures, mice were anesthetized with isoflurane by nose cone. The respiratory rate was maintained between 85 and 125 breaths per minute by titrating the isoflurane concentration. Body temperature was maintained using a heat lamp (during BOMUS) or blown air (during MRI). The nose cone apparatus (28) was manufactured to fix the animal’s head precisely and reliably in the “skull-flat” position (i.e., the dorsal skull surface is horizontal).
Prior to ultrasound, hair was removed from the scalp of the mouse using either a trimmer or a depilatory agent (Nair®, Church & Dwight, Princeton, NJ). Ultrasound gel was placed on the scalp and then, a column of water contained by a 7.6-µm (0.3 mil) plastic sheet was lowered onto the head (Fig. 1 a). In this water column, the ultrasound transducer was centered over the mouse brain, 58 mm above the scalp. A hemicylindrical plastic shield was placed over the thorax to prevent the water column from applying pressure to the body.
To open the BBB, 30 µL of perflutren lipid microspheres (activated Definity) were injected through a tail vein catheter and simultaneously the ultrasound pulse sequence was initiated. The ultrasound was applied for 3 minutes.
Note that 30 µl in a 25 g mouse is approximately 100-times the typical human dose (10–20 µL/kg). This volume was chosen because it was the smallest volume we were able to reliably administer with a syringe. While the dose might have been reduced by diluting the microbubbles, dilution would have required extra handling. Because the Definity microbubbles rapidly settle out of suspension and degrade if exposed to air for prolonged periods of time, microbubble administration was simpler and more reliable when the Definity was used directly out of the vial.
MR Imaging
To enhance the brain with MR contrast, Gd-DTPA (Magnevist, Bayer HealthCare Pharmaceuticals, Wayne, NJ) was administered by intraperitoneal (IP) injection 10 minutes prior to BOMUS (Fig. 1 b). The IP route was chosen because in preliminary work, an IP bolus provided a more temporally consistent and sustained enhancement than an IV bolus and was logistically simpler than an IV infusion. The 10-minute delay was chosen because in preliminary studies, it was found that most of the enhancement from an IP injection of Gd-DTPA occurs within 10–15 minutes post-injection. The Gd-DTPA dose was 3.2, 6.4, or 9.5 mmol/kg, as noted later. After BOMUS, high-throughput MR images were acquired. Because Gd-DTPA is normally excluded by the BBB, opening of the BBB was indicated by contrast-enhancement on T1-weighted MRI.
For MRI, a 35 mm diameter quadrature transmit/receive volume coil (m2m Imaging Corp., Cleveland, OH) was used. The MR system was a 7 T horizontal bore magnet driven by a GE EXCITE console (General Electric Healthcare, Milwaukee, WI). MR images were acquired using either a high-throughput or high-resolution protocol. The high-throughput scan (3.2 minutes) used a 3D spoiled gradient recalled (SPGR) sequence with the following parameters: repetition time (TR) = 25 ms; echo time (TE) = 2 ms; flip angle (FA) = 30 degrees; field of view (FOV) = 20 × 20 × 12 mm; matrix = 128 × 128 × 60; number of averages (NEX) = 1. Data were acquired at a resolution of 156 × 156 × 200 µm.
High-resolution images were acquired with a similar 51 minute SPGR protocol: TR = 25 ms; TE = 3–4 ms; FA = 15–22 degrees; FOV = 20 × 20 × 8 mm; matrix = 384 × 384 × 80; NEX = 4. Data were acquired at a resolution of 52 × 52 × 100 µm. For each high-resolution scan, the exact FA was chosen by first varying the FA in a series of low-resolution scans to identify the Ernst angle for a region of interest (ROI) in the anterior cerebral cortex. In this way comparisons could fairly be made between scans acquired within a fixed scan time.
T1 measurements were performed by acquiring a series of 2D spin echo images with varying TRs: TR = 200, 400, 800, 1600, 3200, 6400, or 12800 ms; TE = 7 ms; BW = 31.25; slice thickness = 1 mm; FOV = 20 × 20 mm; matrix = 128 × 128. T1 over an ROI was estimated using a three-parameter non-linear fit of the data to the following equation: I = m(1 − e(−T1/TR)) + a, where I is the mean ROI intensity and TR is the repetition time. The three terms that were fit were m, a multiplicative constant; a, an additive constant; and T1.
Duration of BBB Disruption
To determine the duration of the BBB opening, BBB opening was assayed at several time intervals after BOMUS. For each time interval (0, 30, 45, 60, 120, or 240 minutes), a different animal was used. An additional control animal was assayed without BOMUS, for a total number of 7 animals. The BBB was opened with BOMUS and after the specified delay, Gd-DTPA (0.167 M) was administered by tail vein (1 mmol/kg). A high-throughput image was acquired 30 minutes later.
Histology
To determine if the BOMUS procedure caused tissue damage, brain sections from 8 selected mice were examined by light microscopy. After MR imaging, the mice were transcardially perfused first with saline (5 minutes) and then with 10% formalin (5 minutes). The fixed brains were embedded in paraffin and 4-µm sections were taken at 500-µm intervals throughout the entire brain. Hematoxylin and eosin-stained (H&E) sections were then examined for instances of red blood cell extravasation into the brain parenchyma.
As positive control to demonstrate that our histology procedure was sensitive to red blood cell extravasation, a single mouse was insonified using a higher pressure sequence (5.0 MPa), which had been shown in previous work (20) to cause extravasations. A standard B-mode sequence on a Siemens Sonoline (TM) Antares diagnostic scanner equipped with a VF10-5 transducer (Siemens Medical Solutions USA, Inc., Issaquah, WA, USA) positioned 17 mm above the skull insonified a plane of tissue at a 36 Hz frame rate with 0.35 µs, 5.0 MPa pulses at 5.7 MHz for five 30 s periods. As described previously, other aspects of the BBB opening procedure were performed and the brain of this mouse was prepared and examined.
Behavioral Assessment
The effect of the BBB disruption procedure on behavior was assessed using selected components of the well-established test battery developed by Irwin in 1968 (29). A subset of 16 tests was selected that in our preliminary work yielded the most consistent measurements. Our protocol included the following tests, described in detail in reference (26): body position, locomotor activity, transfer arousal, spatial locomotion, startle, tail elevation, touch-escape, positional passivity, grip strength, body tone, toe-pinch, limb tone, abdominal tone, provoked biting, tail-pinch, and righting reflex. These tests are all scored on a scale from 0 to 8, where higher numbers correspond with a higher level of activity, arousal, and responsiveness. [Note: To be consistent with the other tests, the scale for the righting reflex was reversed from its original description in (29).] The scores from these individual tests were summed to calculate an overall behavior score.
The testing protocol was performed at three different time points: prior to BOMUS; approximately 3 hours after recovery from anesthesia; and approximately 24 hours after recovery from anesthesia. Because of the experimental schedule, the baseline testing was performed consistently in the early morning, shortly after the mice had been transferred from the vivarium in a fresh cage. In contrast, the 24-hour post-anesthesia testing was consistently performed in the afternoon after the mice had been in the new cage for a full day. The protocol was administered to both BOMUS-treated (n = 8) and control animals (n = 3). The control animals were handled identically (i.e., isoflurane anesthesia, hair removal, Gd-DTPA), except they did not receive ultrasound or microbubbles.
RESULTS
Opening of the BBB
To determine if the combination of unfocused ultrasound and microbubbles could be used to globally open the BBB, this treatment was compared to a variety of control scenarios (Fig. 3). Animals received Gd-DTPA 6.4 mmol/kg IP 10 minutes prior to treatment, and T1-weighted images (high-throughput protocol) were acquired 20 minutes after treatment (Fig. 1 b).
FIG. 3.
T1-weighted SPGR images (high-throughput protocol) demonstrate that Gd-DTPA enhances body tissues but is excluded from the brain by the intact BBB. Treatment with either ultrasound or microbubbles alone does not make the BBB permeable to Gd-DTPA. However, co-administration of ultrasound and microbubbles globally opens the BBB, allowing the Gd-DTPA to enhance the brain.
All animals receiving Gd-DTPA had enhancement of the tissues surrounding the brain (e.g., skin, muscle, and salivary glands), as well a slight enhancement of the choroid plexus [which does not have the BBB and is relatively permeable (30)]. Those animals receiving no treatment, only ultrasound, or only microbubbles had no enhancement in the cerebrospinal fluid (CSF) or in the brain parenchyma. However, those mice receiving both ultrasound and microbubbles simultaneously had a dramatic enhancement in the CSF and brain parenchyma.
While this dose of Gd-DTPA (6.4 mmol/kg IP) provided excellent enhancement at 30 minutes post-injection, for imaging at subsequent time points (45 minutes and beyond) 6.4 mmol/kg Gd-DTPA was excessive. As the Gd-DTPA continued to diffuse out of the peritoneal space and into the blood stream and body tissues, some tissues showed a decrease in signal (data not shown). This signal drop was presumably due to the T2-relaxivity of Gd-DTPA dominating the T1-relaxivity at higher concentrations. For this reason, subsequent experiments were conducted using 1.0 or 3.2 mmol/kg Gd-DTPA.
Time Course of Enhancement
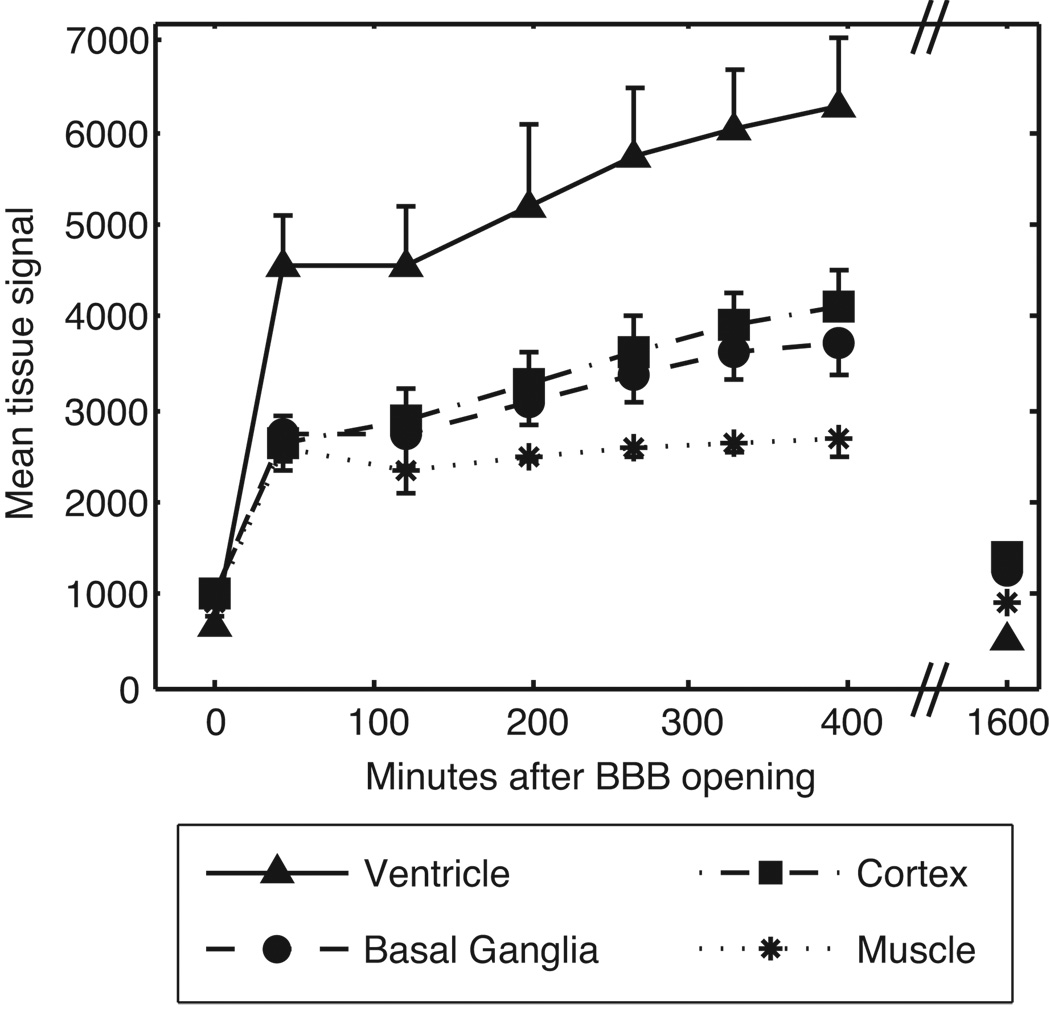
To examine the temporal pattern of enhancement, T1-weighted images (high-throughput protocol) were acquired at three times points: prior to BOMUS (n = 6), serially over 6 hours after BOMUS (n = 6), and 27 hours after BOMUS (n = 1). Signal measurements were taken from ROIs placed in the cortex, basal ganglia, lateral ventricle, and jaw muscle (Fig. 4). (The cortex and basal ganglia were chosen in order to sample both superficial [cortex] and deep structures [basal ganglia] of the brain.) Immediately after BOMUS, all tissues show a dramatic signal enhancement. This enhancement continued to increase over the next four hours. However, by the next day, the tissue signal had returned to the pre-BOMUS baseline levels.
FIG. 4.
Time course of Gd-DTPA enhancement in the brain and muscle after BOMUS. T1-weighted images (high-throughput protocol) were acquired prior to Gd-DTPA and BOMUS (plotted at time 0), serially after BOMUS, and 27 hours after BOMUS. ROIs were placed in the jaw muscle, lateral ventricle, cerebral cortex, and basal ganglia to measure the mean signal intensity. Plot shows mean ± standard deviation (n = 6 except at 27 hours for which n = 1).
Duration of BBB Opening
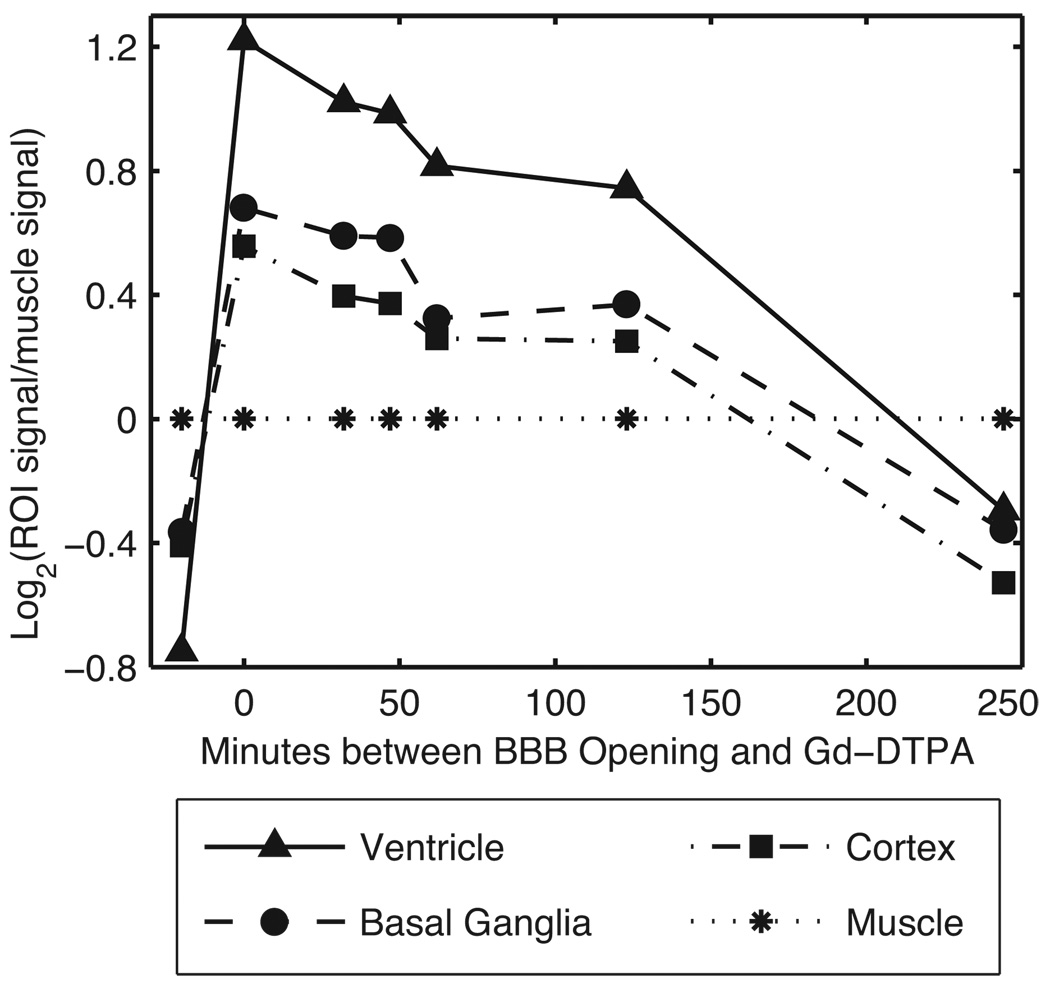
To examine the duration of BBB opening, the BBB permeability was assayed by injecting Gd-DTPA at several time intervals after BOMUS (Fig. 5). Each time interval was assayed using a separate animal (i.e., 7 animal were used to assay 7 time points). Signal measurements were made from ROIs placed in the lateral ventricles, basal ganglia, cortex, and jaw muscle. Because the muscle was not affected by the BOMUS procedure, the muscle signal was used to normalize the values of the intracranial ROIs. These post-BOMUS animals were compared to a control animal that received IV Gd-DTPA, but no BOMUS (shown at time < 0 min in Fig. 5).
FIG. 5.
The duration of BBB disruption was demonstrated by assaying BBB permeability at several times after BOMUS. A separate animal was used to assay each time point. Signal measurements were made in several ROIs from T1-weighted images (high-throughput protocol). To account for inter-animal variability, the muscle signal was used to normalize the intracranial signals: log2 (tissue signal/muscle signal) is plotted along the y-axis. For comparison, data from an untreated control animal is shown at time < 0.
As assayed with Gd-DTPA, BBB permeability was greatest during the BOMUS procedure. After BOMUS, the permeability decreased steadily over the 2 hours. Between 2 and 4 hours after BOMUS, the BBB permeability dropped more quickly, such that by 4 hours, enhancement was comparable to the pre-BOMUS levels in all tissues except the ventricles, which had some slight residual enhancement.
Histology
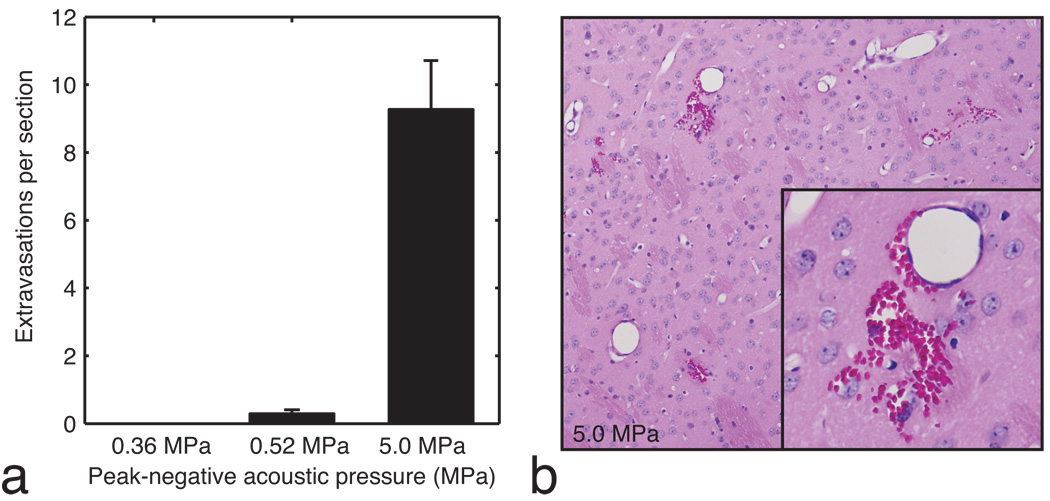
To determine if the BOMUS procedure caused tissue damage, the brains of selected BOMUS-treated mice (n = 8) were examined with light microscopy. Sections were taken at 500 µm intervals, providing approximately 14 sections per brain. In previous reports using focused ultrasound and microbubbles, microhemorrhage (i.e., red blood cell extravasation in the brain parenchyma) was found to be a reliable early indicator of tissue damage (19). Therefore, in this study, brain sections from selected animals were examined for extravasations and the number of extravasations seen on each slide was tallied (Fig. 6 a). Two global BOMUS treatment groups were examined: peak-negative acoustic pressure of 0.52 MPa (n = 4) and 0.36 MPa (n = 3). For comparison, a brain was examined from a mouse that underwent BOMUS using a B-mode scan from a commercial ultrasound system (peak-negative pressure = 5.0 MPa). Note that while the global BOMUS groups had ultrasound applied to the whole brain, the B-mode BOMUS only insonified in a 2-mm axial slab—approximately ⅙ of the brain volume. To account for variations in the number of sections prepared from each brain, the data is reported in “extravasations per section.”
FIG. 6.
a: The mean number of red blood cell extravasations seen in each histology slide of the brain is shown for acoustic pressures of 0.36 MPa (n = 3), 0.52 MPa (n = 4), and 5.0 MPa (n = 1). Error bars show standard error. b: An example of severe red blood cell extravasation from the brain exposed to 5.0 MPa is shown.
The brains of animals treated with 0.36 MPa BOMUS had no identifiable extravasations. The brains of animals treated with 0.52 MPa showed only 0.3 extravasations per section. Interestingly, of the four animals examined after treatment with 0.52 MPa, two had no extravasations anywhere in the brain. In contrast, the brain subject to 5.0 MPa B-mode ultrasound had an average of 9.3 extravasations per slide (Fig. 6 b). Since the B-mode was only applied to about ⅙ of the brain, this number under-represents the extravasation rate relative to the other two groups.
Behavioral assessments
To determine if the BOMUS could potentially be used in longitudinal studies, behavioral assessments were performed on selected mice at three time points: prior to the experiment, 3 hours after the experiment (i.e., 3 hours after recovering from isoflurane anesthesia), and 24 hours after the experiment. Animals treated with BOMUS (0.36 MPa ultrasound pressure, 3.2 mmol/kg Gd-DTPA) were compared with control animals that were treated identically but did not receive ultrasound or microbubbles. The battery of 16 behavioral tests was performed and the scores summed to generate an overall behavior score (Fig. 7). For both groups, with respect to baseline, there was a decrease in the average behavior score 3 hours after anesthesia. This drop largely recovered (but not completely) by the 24-hour time point. However, at each of the three testing times, no difference was observed in the average behavior scores between the BOMUS-treated and control animals.
FIG. 7.
Behavioral testing was performed before anesthesia and 3 and 24 hours after recovery from anesthesia. The average behavior (± SEM) score for control (n = 3) and BOMUS (0.8 MPa) treated (n = 8) animals is shown. Relative to the pre-anesthesia baseline, all animals show a decrease in behavior score 3 hours after anesthesia, but they largely recover by the next day. At each time point, no difference was seen between the two groups, indicating that BOMUS did not measurably affect animal behavior.
T1 Estimation
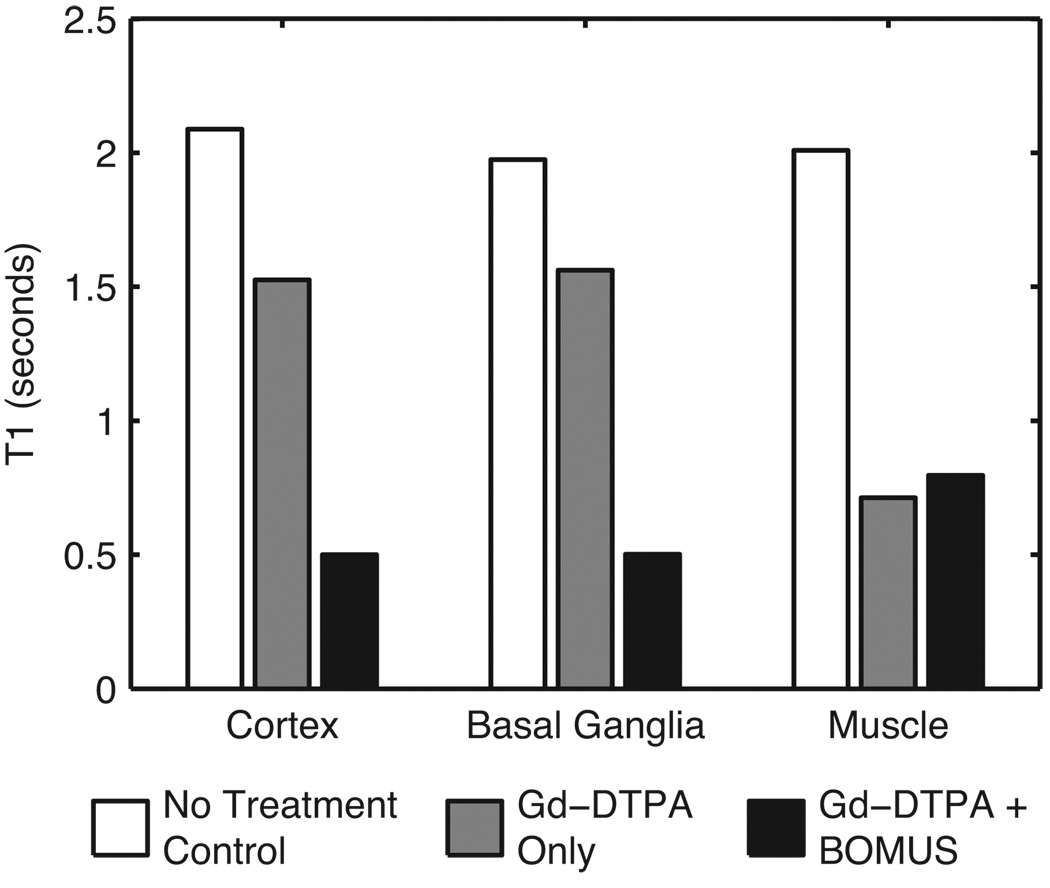
To measure the change in relaxivity due to the Gd-DTPA, T1 was estimated in ROIs selected from the cortex, basal ganglia, and muscle (Fig. 8). In the control animal receiving neither Gd-DTPA nor BOMUS, T1 values were long in the cortex (2.08 s), basal ganglia (1.97 s), and muscle (2.01 s). In the animal given only Gd-DTPA, the muscle T1 shortened dramatically (0.71 s); but T1 was only shortened modestly in the cortex (1.53 s) and basal ganglia (1.56 s) because the intact BBB excluded the Gd-DTPA. However, in the BOMUS-treated animal, Gd-DTPA not only shortened T1 in the muscle (0.80 s), but Gd-DTPA also crossed the BBB and dramatically shortened T1 in the cortex (0.50 s) and basal ganglia (0.50 s).
FIG. 8.
T1 values were estimated from three ROIs in control and treated mice (1 mouse per group). In the control animal receiving neither Gd-DTPA nor BOMUS, T1 values were long in the cortex (2.08 s), basal ganglia (1.97 s), and muscle (2.01 s). The animal given only Gd-DTPA had somewhat shortened T1 values in the cortex (1.53 s) and basal ganglia (1.56 s), and dramatically shortened T1 in the muscle (0.71 s). In the animal treated with both BOMUS, Gd-DTPA not only shortened the T1 of the muscle (0.80 s), but also crossed the BBB and shortened T1 in the cortex (0.50 s) and basal ganglia (0.50 s).
High-resolution MRI
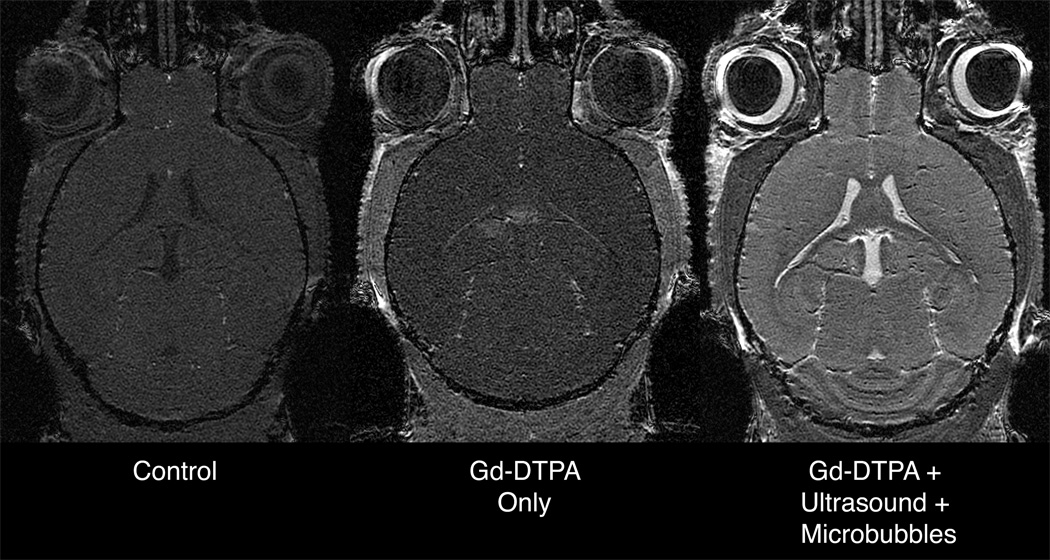
By taking advantage of the shortened T1 of the brain tissue, high-resolution (52 × 52 × 100 µm3) T1-weighted images were obtained (Fig. 9) from BOMUS-treated animals in only 51 minutes. For comparison, images of untreated, and Gd-DTPA-only mice were also acquired at the same resolution. A fixed TR of 25 ms was used and the flip angle was adjusted for each scan to maximize the SNR in the brain. The images from the BOMUS-treated animals showed superior SNR and tissue contrast. For example, the layering in the hippocampus and cerebellum could not be distinguished in the control or Gd-DTPA-only mice, but this layering was clearly seen in the BOMUS-treated animals.
FIG. 9.
High-resolution (52 × 52 × 100 µm3) SPGR images of the mouse brain acquired in vivo in 51 minutes. The control mouse receiving no contrast agent and the mouse receiving only Gd-DPTA have relatively low signal. The animal receiving Gd-DTPA along with BOMUS (microbubbles+ultrasound) shows an increase in SNR of 90% and 63% over the other two. SNR measurements were made in left anterior cortex. For each scan TR = 25ms and FA was adjusted to maximize signal in the anterior cerebral cortex (15, 15, and 25 degrees, respectively).
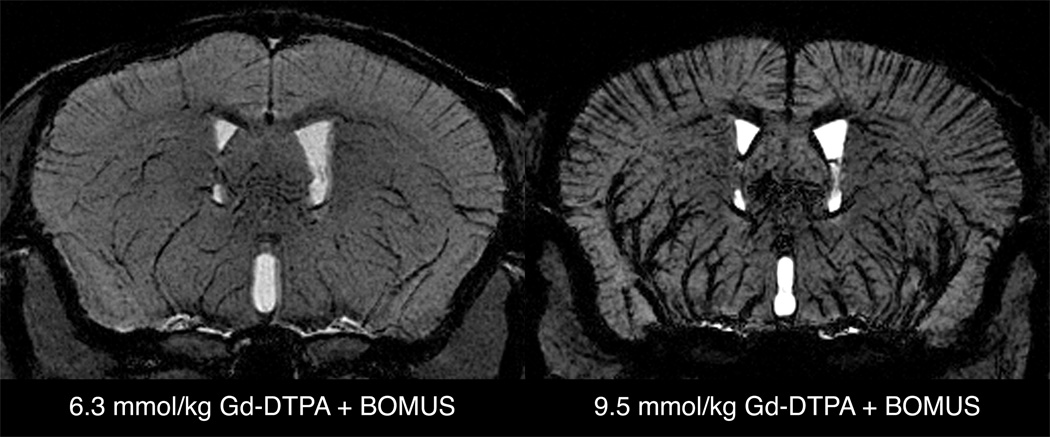
By increasing the dose of Gd-DTPA, it was also possible to obtain negative-contrast vascular images (Fig. 10). These images were acquired using the high-resolution protocol in BOMUS-treated mice receiving either 6.3 or 9.5 mmol/kg Gd-DTPA. The background brain tissue is enhanced by the Gd-DTPA that has crossed the BBB. However, the large vascular content of Gd-DTPA causes susceptibility-related signal loss from the blood and perivascular tissue signal. This allows the delineation of both large and small vessels. For example, the relatively large branches of the middle cerebral arteries supplying the basal ganglia were clearly seen moving dorsally from the base of the brain. Many of these vessels are larger than 50 µm in diameter (31–33). However, in addition to these larger vessels, the cortical vessels that run perpendicular to the cortical surface can also be visualized. Previous work has indicated that these vessels are less than 50 µm in diameter (i.e., below the resolution of the image) (31–33). By taking advantage of the through-space susceptibility effect, these vessels can be detected even though they are smaller than the resolution of the image. While this susceptibility vascular imaging worked well with 6.3 mmol/kg Gd-DTPA, the effect was excessive when the dose was raised to 9.5 mmol/kg.
FIG. 10.
Minimum intensity projections of a 600-µm axial slab from SPGR images (high-resolution protocol) from BOMUS-treated animals given high doses of Gd-DTPA. BOMUS allows the Gd-DTPA to enhance the parenchyma of the brain, but high concentration of Gd-DTPA in the bloodstream causes susceptibility-induced loss of signal from the blood and perivascular tissue. This allows the delineation of cortical vessels (running perpendicular to the cortical surface). When the dose of Gd-DTPA is increased to 9.5 mmol/kg, this effect is exaggerated.
DISCUSSION
While there is great interest in studying the mouse brain with MRI, long T1 and poor tissue contrast have been limiting. For ex vivo studies, staining the brain with contrast agents has enabled dramatic improvements in spatial resolution, tissue contrast, and scan time (2). However, the BBB has interfered with the use contrast agents for in vivo studies. Here a method has been presented for contrast-enhanced imaging of the whole mouse brain using ultrasound to open the BBB. For researchers interested in contrast-enhanced brain imaging, the BOMUS technique has the following advantages over previous BBB disruption techniques: (a) fast and simple; (b) non-invasive and therefore suitable for in vivo and longitudinal studies; (c) global, opening both hemispheres.
The BOMUS technique presented here is fast and simple to perform. Animal preparation requires only a tail vein catheter and a haircut, and the insonation takes only 3 minutes. While the precise calibration of the ultrasound pressure (described previously) did require a specialized hydrophone, the equipment required for BOMUS is all commercially available and requires limited expertise in ultrasound to assemble and use.
The BOMUS technique is non-invasive and reversible. In this study, mice were assessed not only for histological signs of damage, but also behavioral changes due to the procedure. In the data presented here (n = 3), BOMUS with 0.36 MPa showed no red blood cell extravasations in the brain, and the mice recovered identically to those not receiving BOMUS. BOMUS and control animals showed no differences in behavior scores, but both groups showed slightly lower behavior scores 24 hours after anesthesia compared to baseline. This change may be due to residual anesthesia effects after 24 hours. Alternatively, this change in scores may be due to diurnal or environmental factors: the baseline test was performed during a more active time of day (early morning) and after exposure to a new environment (a new cage from the vivarium), while the 24-hour post-experiment test was performed during a less active time of day (afternoon) after the mice had acclimated to the cage.
While 0.36 MPa had no observed negative effects, 0.52 MPa BOMUS did cause a small number of extravasations in some of the animals. While the behavior of this group was not measured systematically, it was observed that of the mice receiving 0.52 MPa BOMUS, 1 of the 4 failed to recover completely (this mouse did have red blood cell extravasations on histology). When these numbers are combined with other unpublished work, our overall experience was that about 30% of mice given 30 µl of Definity and insonified with 0.52 MPa either died or failed to recover completely. Previous reports using focused ultrasound and microbubbles have regarded a few extravasations as an acceptable level of damage for a “non-invasive” technique (14). While this may be true when BOMUS is applied to a very small region of the brain (2–3 mm), our observations indicate that when BOMUS is performed on the whole brain, acoustic pressures that are associated with occasional extravasations may affect the recovery of the animal. In light of this inconsistent recovery after 0.52 MPa, we conclude that an acoustic pressure that does not cause extravasation should be used in global BBB disruption.
In comparing our pressure measurements with those from previous reports using focused ultrasound, note that we report acoustic pressure that reaches the surface of the scalp at the center of the ultrasound beam. The beam profile data shown above (Fig. 2 a) demonstrate that the acoustic pressure toward the edge of the beam is only about 34% of the peak. Furthermore, acoustic attenuation through the mouse skull reduces the acoustic pressure reaching the brain by an estimated 25% (de-rating based on results presented by Choi et al. (22) and adjusted for frequency). This suggests consistent BBB disruption is obtained at peak-negative acoustic pressures ranging from 0.09 MPa (at the center of our beam) to as little as 0.03 MPa (at the edge). These pressures are much lower than the levels (typically 0.4 to 0.5 MPa) reported by others (34). This reduced pressure threshold may be due to the higher dose of lipid microbubbles used in this work (approximately 1.2 ml/kg) compared to others. Specifically, McDannold et al. (31) used Definity at a dose of 10 µl/kg in rabbits with cranial windows and observed BBB opening pressure threshold of 0.4–0.5 MPa. A greater number of studies have been performed using the protein-based microbubble, Optison. Hynynen et al. (19) used Optison at a dose of 0.05 ml/kg and also observed a BBB opening pressure threshold of 0.4–0.5 MPa. The explantion that a higher dose of microbubbles enables a lower pressure threshold is supported by Choi et al. (18), who administered Optison at a dose of 0.4 ml/kg and observed that the BBB opening pressure threshold varied from 0.8 MPa to 2.5 MPa depending on how long they permitted the microbubbles to clear before insonification. While the dose used in the present study is higher than the clinically recommended dose (10 µL/kg), the data presented here did not reveal any negative effects at the higher dose.
We have demonstrated the utility of the BOMUS technique for “active staining” of the brain with Gd-DTPA in vivo. The reduction in T1 (from approximately 2000 ms to 500 ms) allowed high-resolution images (52 × 52 × 100 µm3) to be obtained in only 51 minutes. The time-course data showed that this staining is stable for several hours, giving a long window for imaging, but washes out within a day. The staining provided excellent tissue contrast, which revealed features such as the layering of the hippocampus and cerebellum. Future work with other MRI contrast agents might reveal different patterns of tissue contrast.
In addition to administering anatomical contrast agents, the BOMUS technique has the potential to allow for the administration of functional and molecular contrast agents. Manganese has been used as a functional contrast agent that can distinguish neuronal activity. To administer manganese to the brain of rats, intracarotid mannitol infusions have been used to open the BBB, thus allowing functional imaging in a limited region of the rat brain. However, translating such a technique to mice has been challenging due to the technical difficulty and invasiveness of the mannitol procedure. The global BOMUS technique described here would not only enable such experiments in mice, but would also permit their use in high-throughput or longitudinal studies. Furthermore, the BOMUS technique would allow manganese to be administered to the whole brain, opening up new experimental possibilities (35).
Similarly, there is now an emergence of new molecular imaging agents for MRI and other modalities (36–38). Like existing contrast agents, nearly all of these new agents will be excluded by the BBB. BOMUS may enable the use of these new agents for studying mouse models of neurological disease. Recent work using focused ultrasound with microbubbles has demonstrated that both antibodies and molecular imaging agents may be administered using ultrasound-mediated BBB disruption (21,23).
A variety of future work remains to further develop the BOMUS technique. For example, it is not clear how large an agent may pass through the opened BBB. The Gd-DTPA used in this study is an ionic compound with a molecular weight of 0.5 kDa (39). Though Gd-DTPA distributed fairly evenly throughout the brain, this even distribution may not indicate the BBB itself was uniformly permeable—Gd-DTPA may have been too small to reveal any differences in permeability. It is not clear if the BBB opening is a binary effect or if certain opening conditions can lead to a BBB that permits a greater flux of material. Considering the non-uniform pressure profile, one might expect the edges of the brain to have a lower degree of BBB disruption, however that was not observed in this study. A systematic study using agents of varying sizes and ionic qualities is warranted to evaluate the size of agents that may be administered via BOMUS.
CONCLUSIONS
In this work, the blood-brain barrier was opened using unfocused ultrasound and microbubbles. Like previous ultrasound and microbubble techniques, this approach is non-invasive, transcranial, and reversible. However, by using an unfocused transducer, this technique opens the BBB in both hemispheres in a single insonification. Furthermore, the technique uses commercially available components, takes only a few minutes, and requires no particular expertise in ultrasound. It was shown that this whole-brain BBB opening causes no observed histological damage or changes in behavior after 24 hours. Using this technique, Gd-DTPA was administered to the mouse brain parenchyma, thereby shortening T1 and enabling the acquisition of high-resolution (52 × 52 × 100 µm3) images in 51 minutes in vivo. By enabling the administration of imaging and therapeutic agents, this technique is a promising tool in the study mouse models of human neurological diseases.
ACKNOWLEDGEMENTS
We thank Mark Palmeri, Alexandra Badea, and Anastasiya Batrachenko for valuable discussions and assistance with data acquisition. We thank Sally Zimney for assistance in manuscript preparation. This work was performed at the Duke Center for In Vivo Microscopy, an NIH/NCRR national Biomedical Technology Research Center (P41 RR005959) and NCI Small Animal Imaging Resource Program (U24 CA092656). This work was also supported in part by an NSF Graduate Research Fellowship (2003014921).
REFERENCES
- 1.Johnson GA, Cofer GP, Gewalt SL, Hedlund LW. Morphologic phenotyping with MR microscopy: The visible mouse. Radiology. 2002;222(3):789–793. doi: 10.1148/radiol.2223010531. [DOI] [PubMed] [Google Scholar]
- 2.Johnson GA, Ali-Sharief A, Badea A, Brandenburg J, Cofer G, Fubara B, Gewalt S, Hedlund LW, Upchurch L. High-throughput morphologic phenotyping of the mouse brain with magnetic resonance histology. Neuroimage. 2007;37(1):82–89. doi: 10.1016/j.neuroimage.2007.05.013. [DOI] [PMC free article] [PubMed] [Google Scholar]
- 3.Muldoon LL, Soussain C, Jahnke K, Johanson C, Siegal T, Smith QR, Hall WA, Hynynen K, Senter PD, Peereboom DM, Neuwelt EA. Chemotherapy delivery issues in central nervous system malignancy: A reality check. Journal of Clinical Oncology. 2007;25(16):2295–2305. doi: 10.1200/JCO.2006.09.9861. [DOI] [PubMed] [Google Scholar]
- 4.Doolittle ND, Peereboom DM, Christoforidis GA, Hall WA, Palmieri D, Brock PR, Campbell K, Dickey DT, Muldoon LL, O'Neill BP, Peterson DR, Pollock B, Soussain C, Smith Q, Tyson RM, Neuwelt EA. Delivery of chemotherapy and antibodies across the blood-brain barrier and the role of chemoprotection, in primary and metastatic brain tumors: report of the eleventh annual blood-brain barrier consortium meeting. Journal of Neuro-Oncology. 2007;81(1):81–91. doi: 10.1007/s11060-006-9209-y. [DOI] [PubMed] [Google Scholar]
- 5.Kroll RA, Neuwelt EA. Outwitting the blood-brain barrier for therapeutic purposes: Osmotic opening and other means. Neurosurgery. 1998;42(5):1083–1099. doi: 10.1097/00006123-199805000-00082. [DOI] [PubMed] [Google Scholar]
- 6.Lin YJ, Koretsky AP. Manganese ion enhances T-1-weighted MRI during brain activation: An approach to direct imaging of brain function. Magn Reson Med. 1997;38(3):378–388. doi: 10.1002/mrm.1910380305. [DOI] [PubMed] [Google Scholar]
- 7.Larbanoix L, Burtea C, Laurent S, Van Leuven F, Toubeau G, Elst LV, Muller RN. Potential amyloid plaque-specific peptides for the diagnosis of Alzheimer's disease. Neurobiol Aging. 2008 November;:11. doi: 10.1016/j.neurobiolaging.2008.09.021. (published online doi:10.1016/j.neurobiolaging.2008.09.021) [DOI] [PubMed] [Google Scholar]
- 8.Rapoport SI. Osmotic opening of the blood-brain barrier: Principles, mechanism, and therapeutic applications. Cell Mol Neurobiol. 2000;20(2):217–230. doi: 10.1023/A:1007049806660. [DOI] [PMC free article] [PubMed] [Google Scholar]
- 9.Lin JC, Lin MF. Microwave hyperthermia-induced blood-brain-barrier alterations. Radiat Res. 1982;89(1):77–87. [PubMed] [Google Scholar]
- 10.Moriyama E, Salcman M, Broadwell RD. Blood-brain-barrier alteration after microwave-induced hyperthermia is purely a thermal effect .1. Temperature and Power Measurements. Surg Neurol. 1991;35(3):177–182. doi: 10.1016/0090-3019(91)90068-k. [DOI] [PubMed] [Google Scholar]
- 11.Abbott NJ. Inflammatory mediators and modulation of blood-brain barrier permeability. Cell Mol Neurobiol. 2000;20(2):131–147. doi: 10.1023/A:1007074420772. [DOI] [PMC free article] [PubMed] [Google Scholar]
- 12.Mesiwala AH, Farrell L, Wenzel HJ, Silbergeld DL, Crum LA, Winn HR, Mourad PD. High-intensity focused ultrasound selectively disrupts the blood-brain barrier in vivo. Ultrasound in Medicine and Biology. 2002;28(3):389–400. doi: 10.1016/s0301-5629(01)00521-x. [DOI] [PubMed] [Google Scholar]
- 13.Vykhodtseva NI, Hynynen K, Damianou C. Histologic Effects of High-Intensity Pulsed Ultrasound Exposure with Subharmonic emission in rabbit brain in-vivo. Ultrasound Med Biol. 1995;21(7):969–979. doi: 10.1016/0301-5629(95)00038-s. [DOI] [PubMed] [Google Scholar]
- 14.Hynynen K, McDannold N, Vykhodtseva N, Jolesz FA. Noninvasive MR imaging-guided focal opening of the blood-brain barrier in rabbits. Radiology. 2001;220(3):640–646. doi: 10.1148/radiol.2202001804. [DOI] [PubMed] [Google Scholar]
- 15.Sheikov N, McDannold N, Vykhodtseva N, Jolesz F, Hynynen K. Cellular mechanisms of the blood-brain barrier opening induced by ultrasound in presence of microbubbles. Ultrasound in Medicine and Biology. 2004;30(7):979–989. doi: 10.1016/j.ultrasmedbio.2004.04.010. [DOI] [PubMed] [Google Scholar]
- 16.McDannold N, Vykhodtseva N, Raymond S, Jolesz FA, Hynynen K. MRI-guided targeted blood-brain barrier disruption with focused ultrasound: Histological findings in rabbits. Ultrasound in Medicine and Biology. 2005;31(11):1527–1537. doi: 10.1016/j.ultrasmedbio.2005.07.010. [DOI] [PubMed] [Google Scholar]
- 17.McDannold N, Vykhodtseva N, Hynynen K. Targeted disruption of the blood-brain barrier with focused ultrasound: association with cavitation activity. Physics in Medicine and Biology. 2006;51(4):793–807. doi: 10.1088/0031-9155/51/4/003. [DOI] [PubMed] [Google Scholar]
- 18.Choi JJ, Pernot M, Small SA, Konofagou EE. Noninvasive, transcranial and localized opening of the blood-brain barrier using focused ultrasound in mice. Ultrasound in Medicine and Biology. 2007;33(1):95–104. doi: 10.1016/j.ultrasmedbio.2006.07.018. [DOI] [PubMed] [Google Scholar]
- 19.Hynynen K, McDannold N, Sheikov NA, Jolesz FA, Vykhodtseva N. Local and reversible blood-brain barrier disruption by noninvasive focused ultrasound at frequencies suitable for trans-skull sonications. Neuroimage. 2005;24(1):12–20. doi: 10.1016/j.neuroimage.2004.06.046. [DOI] [PubMed] [Google Scholar]
- 20.Bing KF, Howles GP, Qi Y, Palmeri ML, Nightingale KR. Blood-brain barrier (BBB) disruption using a diagnostic ultrasound scanner and Definity® in mice. Ultrasound Med Biol. 2009;35(8):1298–1308. doi: 10.1016/j.ultrasmedbio.2009.03.012. [DOI] [PMC free article] [PubMed] [Google Scholar]
- 21.Raymond SB, Treat LH, Dewey JD, McDannold NJ, Hynynen K, Bacskai BJ. Ultrasound enhanced delivery of molecular imaging and therapeutic agents in Alzheimer's disease mouse models. PLoS ONE. 2008;3(5):e2175. doi: 10.1371/journal.pone.0002175. [DOI] [PMC free article] [PubMed] [Google Scholar]
- 22.Choi JJ, Pernot M, Brown TR, Small SA, Konofagou EE. Spatio-temporal analysis of molecular delivery through the blood-brain barrier using focused ultrasound. Physics in Medicine and Biology. 2007;52(18):5509–5530. doi: 10.1088/0031-9155/52/18/004. [DOI] [PubMed] [Google Scholar]
- 23.Kinoshita M, McDannold N, Jolesz FA, Hynynen K. Targeted delivery of antibodies through the blood-brain barrier by MRI-guided focused ultrasound. Biochemical and Biophysical Research Communications. 2006;340(4):1085–1090. doi: 10.1016/j.bbrc.2005.12.112. [DOI] [PubMed] [Google Scholar]
- 24.Hynynen K, McDannold N, Vykhodtseva N, Raymond S, Weissleder R, Jolesz FA, Sheikov N. Focal disruption of the blood-brain barrier due to 260-kHz ultrasound bursts: a method for molecular imaging and targeted drug delivery. J Neurosurg. 2006;105(3):445–454. doi: 10.3171/jns.2006.105.3.445. [DOI] [PubMed] [Google Scholar]
- 25.Chopra R, Curiel L, Staruch R, Morrison L, Hynynen K. An MRI-compatible system for focused ultrasound experiments in small animal models. Med Phys. 2009;36(5):1867–1874. doi: 10.1118/1.3115680. [DOI] [PMC free article] [PubMed] [Google Scholar]
- 26.Olympus NDT, Waltham, MA: Technical brochure; 2006. Mar, [Accessed 27 June 2009]. Ultrasonic Transducers Technical Notes; p. 11. Available from: http://www.olympus-ims.com/en/panametrics-ndt-ultrasonic/pdf/ [Google Scholar]
- 27.McDannold N, Vykhodtseva N, Hynynen K. Effects of acoustic parameters and ultrasound contrast agent dose on focused-ultrasound induced blood-brain barrier disruption. Ultrasound Med Biol. 2008;34(6):930–937. doi: 10.1016/j.ultrasmedbio.2007.11.009. [DOI] [PMC free article] [PubMed] [Google Scholar]
- 28.Howles GP, Nouls JC, Qi Y, Johnson GA. Rapid production of specialized animal handling devices using computer-aided design and solid freeform fabrication. J Magn Reson Imaging. 2009;30(2):466–471. doi: 10.1002/jmri.21821. [DOI] [PMC free article] [PubMed] [Google Scholar]
- 29.Irwin S. Comprehensive Observational Assessment.Ia. A systematic quantitative procedure for assessing behavioral and physiologic state of mouse. Psychopharmacologia. 1968;13(3):222–257. doi: 10.1007/BF00401402. [DOI] [PubMed] [Google Scholar]
- 30.Segal MB. The choroid plexuses and the barriers between the blood and the cerebrospinal fluid. Cellular and Molecular Neurobiology. 2000;20(2):183–196. doi: 10.1023/A:1007045605751. [DOI] [PMC free article] [PubMed] [Google Scholar]
- 31.Ghaghada KB, Howles GP, Johnson GA, Mukundan S. High-Resolution contrast-enhanced magnetic resonance angiography of the mouse circle-of-willis. Proceedings of 16th Annual Meeting of ISMRM; Toronto. 2008. [Google Scholar]
- 32.Howles GP, Ghaghada KB, Qi Y, Srinivasan Mukundan J, Johnson GA. High-Resolution magnetic resonance angiography in the mouse using a nanoparticle blood-pool contrast agent. Magn Reson Med. 2009 doi: 10.1002/mrm.22154. In Press. [DOI] [PMC free article] [PubMed] [Google Scholar]
- 33.Dorr A, Sled JG, Kabani N. Three-dimensional cerebral vasculature of the CBA mouse brain: A magnetic resonance imaging and micro computed tomography study. Neuroimage. 2007;35(4):1409–1423. doi: 10.1016/j.neuroimage.2006.12.040. [DOI] [PubMed] [Google Scholar]
- 34.McDannold N, Vykhodtseva N, Hynynen K. Use of ultrasound pulses combined with definity for targeted blood-brain barrier disruption: A feasibility study. Ultrasound in Medicine and Biology. 2007;33(4):584–590. doi: 10.1016/j.ultrasmedbio.2006.10.004. [DOI] [PMC free article] [PubMed] [Google Scholar]
- 35.Howles-Banerji GP. Active staining for in vivo magnetic resonance microscopy of the mouse brain. Durham: Duke University; 2009. p. 167. [Google Scholar]
- 36.Querol M, Bogdanov A. Amplification strategies in MR imaging: Activation and accumulation of sensing contrast agents (SCAs) J Magn Reson Imaging. 2006;24(5):971–982. doi: 10.1002/jmri.20724. [DOI] [PubMed] [Google Scholar]
- 37.Meade TJ, Taylor AK, Bull SR. New magnetic resonance contrast agents as biochemical reporters. Curr Opin Neurobiol. 2003;13(5):597–602. doi: 10.1016/j.conb.2003.09.009. [DOI] [PubMed] [Google Scholar]
- 38.Shapiro EM, Koretsky AP. Convertible manganese contrast for molecular and cellular MRI. Magnet Reson Med. 2008;60(2):265–269. doi: 10.1002/mrm.21631. [DOI] [PMC free article] [PubMed] [Google Scholar]
- 39.Magnevist (brand of gadopentetate dimeglumine) Injection. Prescribing Information: Bayer HealthCare Pharmaceuticals. Wayne, NJ: 2007 June;


