Summary
This article reports perfusion-CT patterns that can be observed in patients with DVAs. In atypical DVAs, an abnormal venous congestion pattern with increased CBV, CBF and MTT can be observed in the vicinity of a DVA, and needs to be recognized and differentiated from other entities such as cerebral neoplasms or stroke. This pattern might help to stratify risks of associated complications such as hemorrhage.
Introduction
Developmental venous anomalies (DVA), also known as venous angiomas, are the most common vascular anomaly of the brain [1, 2]. They are present in up to 2% of the general population and constitute more than 50% of brain vascular anomalies [3, 4]. Standard use of high resolution imaging modalities, namely CT and MRI, in emergency and non-emergency settings (e.g. patients with neurological deficits, seizures, clinical suspicion of stroke) is likely responsible for the increased incidental findings of venous cerebral variants.
Different hypotheses about the pathogenesis of DVAs have been proposed to address whether DVAs are malfunctioning anomalies or congenital variants. Currently, the development of DVAs is thought to be a non-inherited, congenital process that begins in embryogenesis with an arrest in venous development after arterial maturity is complete [5, 6]. They are not true vascular malformations and are thought to represent variations of parenchymal venous drainage [3, 7]. Their functional role as draining vessels is preserved. Devastating venous infarctions after ligation of a DVA has confirmed the physiological function of a DVA as the only draining vessel for its correlating brain segment [8].
Assessment of DVAs with perfusion-CT (PCT) allows characterization of the hemodynamic properties of DVAs, which may lead to further understanding of the clinical relevance of those lesions. The purpose of this article is to illustrate typical and atypical hemodynamic patterns of DVAs on PCT through case reports.
Case #1: Typical DVA with normal perfusion parameters
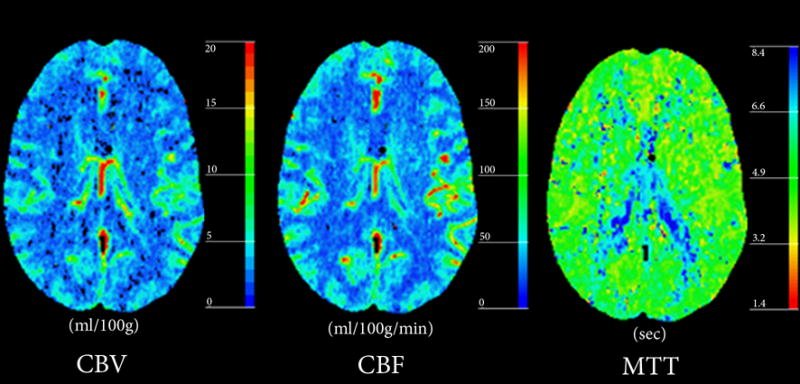
A 25-year old female patient with a history of chronic headaches presented to the emergency department with a new episode of headache associated with weakness and dysesthesia in her lower extremities. Physical and neurological examination showed mild spasticity in lower extremities bilaterally, with increased bilateral deep tendon reflexes and extensor plantar responses. A CT study was performed (Figure 1), consisting of non-contrast enhanced CT, CT angiogram (CTA), perfusion-CT and post-contrast CT. No abnormalities were reported on non-contrast enhanced CT (NCT). Post-contrast CT and CTA showed a right frontoparietal DVA with centripetal drainage to the deep venous system. No adjacent aneurysm or associated vascular malformation was reported. PCT demonstrated normal symmetric blood flow, volume and transit times in the region of interest. Subsequent digital subtraction angiography was performed and confirmed the incidental DVA without evidence of abnormal shunting or aneurysms.
Figure 1. Typical DVA with normal perfusion parameters.
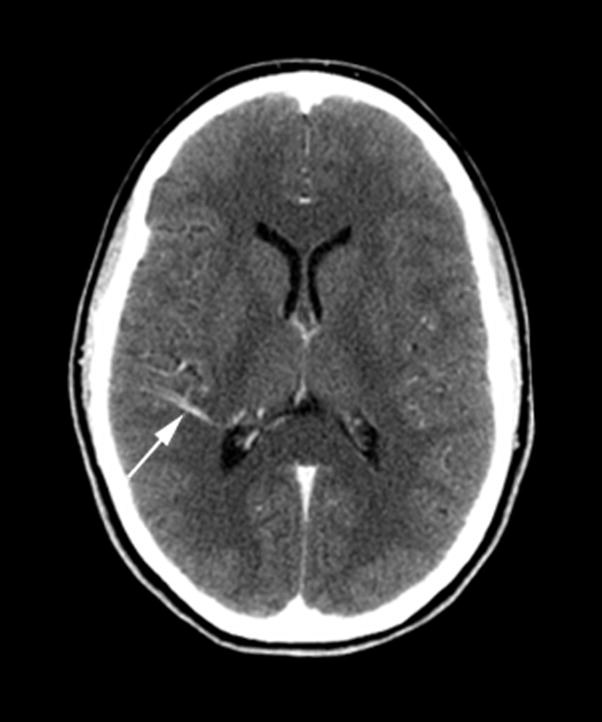
(A) Post-contrast CT shows a right posterior temporal DVA with centripetal drainage (arrow) into choroidal veins in the atrium of the right lateral ventricle.
(B) Perfusion-CT maps do not demonstrate abnormalities in the parenchyma surrounding the DVA.
Case #2: Atypical DVA with abnormal perfusion parameters but no complications
A 58-year old male patient with history of back and neck pain presented to the emergency department with acute onset of headache. Physical examination did not show fever, neck stiffness, or focal neurological deficits. A CT study was performed (Figure 2). No abnormalities were noted on the (NCT). Post-contrast CT and CTA demonstrated a DVA in the deep white matter of the right frontal lobe with drainage to ependymal periventricular veins. PCT maps demonstrated a regional increase in cerebral blood volume (CBV) and cerebral blood flow (CBF) with associated prolonged mean transit time (MTT) in the corresponding area. The patient then underwent a lumbar puncture (LP) in which results were negative for SAH. He was discharged the following morning after near complete resolution of symptoms.
Figure 2. Atypical DVA with abnormal perfusion parameters but no complications.
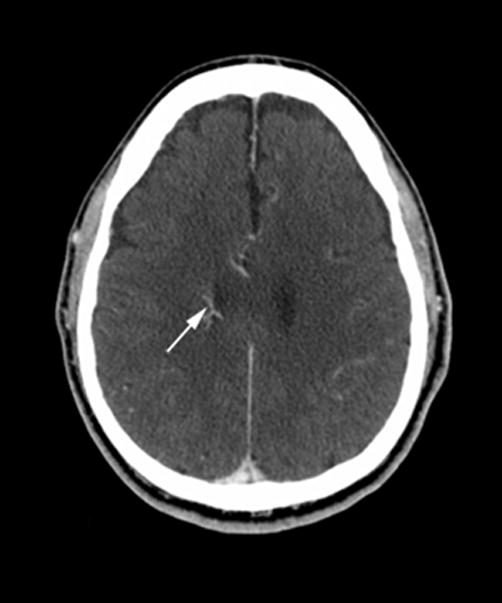
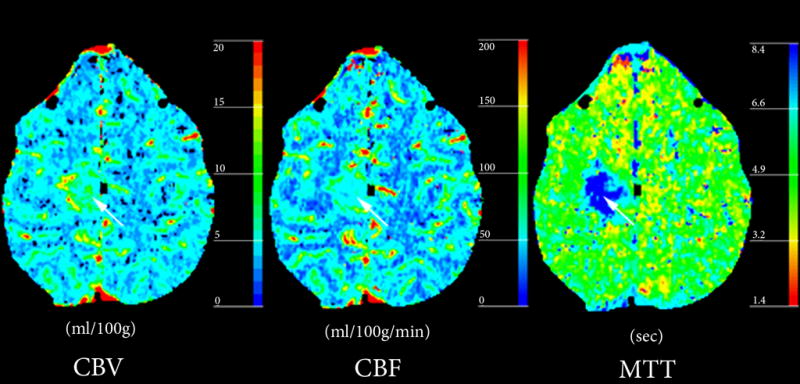
(A) Post-contrast CT demonstrates a DVA (arrow) in the deep white matter of the right frontal lobe with drainage into ependymal periventricular veins.
(B) Perfusion-CT maps demonstrate regional increase in CBV and CBF surrounding the DVA, with prolongation of MTT.
Case #3: Atypical DVA with abnormal perfusion parameters and associated hemorrhage
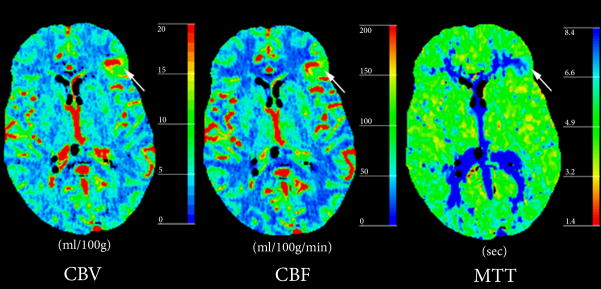
A 62-year old female patient presented to the emergency department with an acute onset of headache. CT studies of the head were performed upon admission (Figure 3). NCT showed a small focus of hemorrhage in the left frontal lobe. Post-contrast CT and CTA demonstrated a left frontal lobe DVA involving cortex and subcortical white matter, with centripetal drainage towards the left lateral ventricle to the septal vein. PCT maps demonstrated a regional increase in CBV and CBF surrounding the DVA, most noted in the cortex, with corresponding prolongation of MTT.
Figure 3. Atypical DVA with abnormal perfusion parameters and associated hemorrhage.
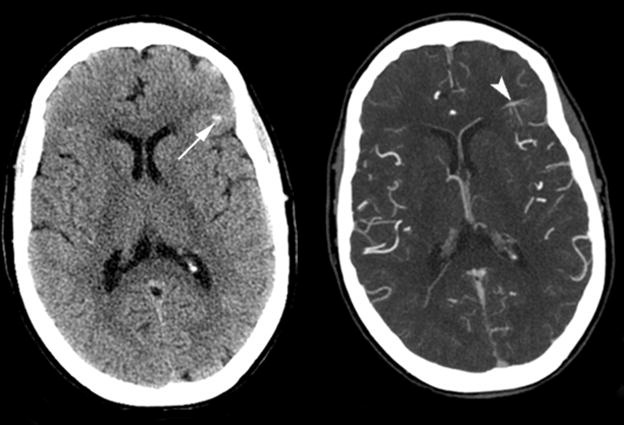
(A) Non-contrast enhanced CT (left) and post-contrast CT (right) show left a frontal lobe DVA within the cortex and subcortical white matter (arrowhead), with a small area of hemorrhage (arrow) in the adjacent parenchyma.
(B) Perfusion CT maps demonstrate regional increase in CBV and CBF surrounding the DVA, and prolonged MTT.
Discussion
Anatomical venous anomalies can be depicted with different imaging modalities including conventional angiography, MR angiography, CT angiography as well as perfusion- and susceptibility-weighted MR imaging and perfusion CT imaging. Most commonly, DVAs are unilateral and found primarily in the frontal lobes, followed by the parietal lobes [3, 9]. Classical imaging findings are focal enhancements of smaller parenchymal veins draining into a collecting vein, which can be followed transhemispherically to drain into a cortical vein, deep vein, or dural sinus. The venous drainage may follow a centripetal distribution through variations of medullary veins that connect with ependymal veins. Centrifugal distribution may also be observed through abnormal medullary veins that connect with cortical veins. Lastly, cerebellar DVAs usually drain into ependymal veins in the 4th ventricle or through superficial veins.
Perfusion imaging allows qualitative and quantitative assessment of the flow characteristics throughout DVAs. CBV, CBF and MTT maps are calculated to measure the blood volume, blood flow, and mean transit times of the brain parenchyma surrounding the abnormal vasculature. In this case series we report on three patients with DVAs and different perfusion patterns. The first patient had normal PCT. In patients 2 and 3, there were increased CBV, CBF and MTT values surrounding the DVA lesions. In contrast to patient 2, patient 3 demonstrated a focus of hemorrhage adjacent to the DVA, which might have been related to an associated cavernous venous malformation.
Perfusion patterns associated with DVAs need to be recognized so that they are not confused with other entities such as hypervascular cerebral neoplasms or stroke, obviating the need for further unnecessary diagnostic tests.
PCT might help stratification of the risk of complication associated with DVAs. Histopathological analysis of DVAs shows that implicated veins are often abnormally dilated, twisted, and follow a chaotic pattern. In contrast, arteries in the region of the DVAs usually show no abnormality [1, 10]. The surrounding brain parenchyma in proximity to the variant blood vessels has mostly been reported as normal [7, 11]. However, parenchymal abnormalities in the vicinity of the DVA have been reported, such as T2 hyperintensity related to chronic venous congestion or ischemia [12]. These findings suggest that there may be two types of DVAs: one type that leads to tissue damage (due to ischemia or venous congestion), and another type that does not affect the integrity of the surrounding parenchyma. Accordingly, a classification of DVAs has been proposed dividing them into two main groups: Typical (uncomplicated) and atypical DVAs [13]. Most of the DVAs encountered with brain imaging fall into the first category. The vascular anomalies associated with atypical DVAs include DVA stenoses, dystrophic calcifications, and cavernous venous malformations [14]. Cavernous venous malformations associated with atypical DVAs are considered the leading cause of intracerebral hemorrhage due to DVAs [15, 16].
In two of our patients, increased CBV, CBF, and MTT values were observed in the region of the DVA, in agreement with a previous report using perfusion-weighted MRI in four patients with DVAs [13]. This altered flow pattern, suggesting venous congestion, might be due to a venous stenosis of the main draining vein, allowing us to further classify these incidentally identified DVAs into the atypical DVA category. This is a relevant finding since outflow obstruction of the draining vessels is the most common mechanism implicated in the development of symptomatic DVAs [17]. In our third patient, the perfusion pattern of venous congestion might have been a contributing factor to the associated hemorrhage, or to the development of a possible underlying cavernomatous venous malformation. We hypothesize that PCT may serve to provide risk stratification in patients with DVAs, that identification of a perfusion pattern of venous retention may be the hallmark of an increased risk of associated complications. The clinical significance of increased CBV, CBF, and MTT associated with a DVA needs to be confirmed in longitudinal studies.
In summary, abnormal PCT pattern that can be observed in the vicinity of a DVA, namely a venous congestion pattern with increased CBV, CBF and MTT, needs to be reccognized and differentiated from other entities such as cerebral neoplasms or stroke. This pattern might help to stratify risks of associated complications such as hemorrhage.
Acknowledgments
Max Wintermark receives funding from the National Center for Research Resources, Grant KL2 RR024130, GE Healthcare and Philips Healthcare; he is a consultant for Concentric. Hannes Kroll receives funding from a VA merit award (D.S.). The content of the article is solely the responsibility of the authors and does not necessarily represent the official views of the National Institute of Neurological Disorders and Stroke, the National Center for Research Resources, the National Institutes of Health or the other sponsors.
Footnotes
Publisher's Disclaimer: This is a PDF file of an unedited manuscript that has been accepted for publication. As a service to our customers we are providing this early version of the manuscript. The manuscript will undergo copyediting, typesetting, and review of the resulting proof before it is published in its final citable form. Please note that during the production process errors may be discovered which could affect the content, and all legal disclaimers that apply to the journal pertain.
References
- 1.McCormick WF. The pathology of vascular (“arteriovenous”) malformations. J Neurosurg. 1966;24(4):807–16. doi: 10.3171/jns.1966.24.4.0807. [DOI] [PubMed] [Google Scholar]
- 2.McCormick WF, Hardman JM, Boulter TR. Vascular malformations (“angiomas”) of the brain, with special reference to those occurring in the posterior fossa. J Neurosurg. 1968;28(3):241–51. doi: 10.3171/jns.1968.28.3.0241. [DOI] [PubMed] [Google Scholar]
- 3.Garner TB, et al. The natural history of intracranial venous angiomas. J Neurosurg. 1991;75(5):715–22. doi: 10.3171/jns.1991.75.5.0715. [DOI] [PubMed] [Google Scholar]
- 4.Sarwar M, McCormick WF. Intracerebral venous angioma. Case report and review. Arch Neurol. 1978;35(5):323–5. doi: 10.1001/archneur.1978.00500290069012. [DOI] [PubMed] [Google Scholar]
- 5.Saito Y, Kobayashi N. Cerebral venous angiomas: clinical evaluation and possible etiology. Radiology. 1981;139(1):87–94. doi: 10.1148/radiology.139.1.7208947. [DOI] [PubMed] [Google Scholar]
- 6.Toro VE, et al. Cerebral venous angiomas: MR findings. J Comput Assist Tomogr. 1988;12(6):935–40. doi: 10.1097/00004728-198811000-00005. [DOI] [PubMed] [Google Scholar]
- 7.Lasjaunias P, Burrows P, Planet C. Developmental venous anomalies (DVA): the so-called venous angioma. Neurosurg Rev. 1986;9(3):233–42. doi: 10.1007/BF01743138. [DOI] [PubMed] [Google Scholar]
- 8.Biller J, et al. Cerebellar venous angiomas. A continuing controversy. Arch Neurol. 1985;42(4):367–70. doi: 10.1001/archneur.1985.04060040077016. [DOI] [PubMed] [Google Scholar]
- 9.Lee C, Pennington MA, Kenney CM., 3rd MR evaluation of developmental venous anomalies: medullary venous anatomy of venous angiomas. AJNR Am J Neuroradiol. 1996;17(1):61–70. [PMC free article] [PubMed] [Google Scholar]
- 10.Abe M, et al. Histologically classified venous angiomas of the brain: a controversy. Neurol Med Chir (Tokyo) 2003;43(1):1–10. doi: 10.2176/nmc.43.1. discussion 11. [DOI] [PubMed] [Google Scholar]
- 11.Ostertun B, Solymosi L. Magnetic resonance angiography of cerebral developmental venous anomalies: its role in differential diagnosis. Neuroradiology. 1993;35(2):97–104. doi: 10.1007/BF00593962. [DOI] [PubMed] [Google Scholar]
- 12.Matsuda H, et al. Brain perfusion SPECT in a patient with a subtle venous angioma. Clin Nucl Med. 1994;19(9):785–8. doi: 10.1097/00003072-199409000-00008. [DOI] [PubMed] [Google Scholar]
- 13.Camacho DL, et al. Atypical MR imaging perfusion in developmental venous anomalies. AJNR Am J Neuroradiol. 2004;25(9):1549–52. [PMC free article] [PubMed] [Google Scholar]
- 14.San Millan Ruiz D, et al. Parenchymal abnormalities associated with developmental venous anomalies. Neuroradiology. 2007;49(12):987–95. doi: 10.1007/s00234-007-0279-0. [DOI] [PubMed] [Google Scholar]
- 15.Huber G, et al. Regional association of developmental venous anomalies with angiographically occult vascular malformations. Eur Radiol. 1996;6(1):30–7. doi: 10.1007/BF00619949. [DOI] [PubMed] [Google Scholar]
- 16.Wilms G, et al. Simultaneous occurrence of developmental venous anomalies and cavernous angiomas. AJNR Am J Neuroradiol. 1994;15(7):1247–54. discussion 1255–7. [PMC free article] [PubMed] [Google Scholar]
- 17.Pereira VM, et al. Pathomechanisms of symptomatic developmental venous anomalies. Stroke. 2008;39(12):3201–15. doi: 10.1161/STROKEAHA.108.521799. [DOI] [PubMed] [Google Scholar]
- 18.Wintermark M, et al. Simultaneous measurement of regional cerebral blood flow by perfusion CT and stable xenon CT: a validation study. AJNR Am J Neuroradiol. 2001;22(5):905–14. [PMC free article] [PubMed] [Google Scholar]


