

Abstract
Genetic databases contain a variety of annotation errors that often go unnoticed due to the large size of modern genetic data sets. Interpretation of these data sets requires bioinformatics tools that may contribute to this problem. While providing gene symbol annotations for identifiers (IDs) such as microarray probeset, RefSeq, GenBank and Entrez Gene is seemingly trivial, the accuracy is fundamental to any subsequent conclusions. We examine gene symbol annotations and results from three commercial pathway analysis software (PAS) packages: Ingenuity Pathways Analysis, GeneGO and Pathway Studio. We compare gene symbol annotations and canonical pathway results over time and among different input ID types. We find that PAS results can be affected by variation in gene symbol annotations across software releases and the input ID type analyzed. As a result, we offer suggestions for using commercial PAS and reporting microarray results to improve research quality. We propose a wiki type website to facilitate communication of bioinformatics software problems within the scientific community.
Keywords: annotation, gene identifiers, microarray, bioinformatics, systems biology
Introduction
Researchers rely on expression microarrays and pathway analysis software (PAS) to investigate mRNA perturbations. Investigators are unable to critically examine the massive amount of raw data, and very few have the ability to evaluate the veracity of the PAS they use to interpret these data. We describe an incident using commercial software that caused us to examine the situation more deeply to understand the extent and severity of the problem, and to determine if solutions were necessary and what they might entail.
In March 2008, we ran PAS on a set of differentially expressed genes from a microarray experiment and observed that glucocorticoid receptor signaling was an important canonical pathway. In September 2008, we repeated this analysis on the same data and glucocorticoid receptor signaling had shifted in rank from 5th to 27th. This atypical result was due to an annotation “stringency error” that manifested with a new PAS release, such that many of the probeset IDs (PID)s that were recognized and annotated with gene symbols in March 2008 were not annotated in September 2008. This example illustrates how incorrect gene symbol annotations of PIDs can result in dramatic changes in pathways and functional analysis results. As a result, the annotation feature of PAS is critical to its utility and is at least as important as the gene interaction, functional information and data mining tools emphasized by PAS.
Pathway analysis software is invaluable to the interpretation and management of large-scale genetic data sets. Users can import lists of gene IDs such as gene symbol, Entrez Gene, RefSeq, GenBank and Affymetrix probesets (PID), with or without expression data, and PAS provides the following functions: 1) Data set annotation, the assignment of gene symbols or other identifiers to a variety of input identifiers. 2) Network analysis, the assignment of genes that have direct (or both direct and indirect) interactions into groups or networks of manageable size (typically 35–50 genes). 3) Functional analysis, the assessment of key functions that are enriched on the input gene list. 4) Canonical pathway analysis, determining the enrichment of genes within pathways. While features 2–4 are the primary appeal of PAS, the quality of these results depends on the accuracy with which the input gene list is recognized and interpreted.
PAS derive ID relationships from both the array manufacturer and public databases, including NCBI’s GenBank®, RefSeq and Online Mendelian Inheritance in Man® (OMIM) (http://www.ncbi.nlm.nih.gov/omim), and the Human Genome Organization (HUGO) (http://www.genenames.org). While these databases are the reference set for genetic research, they contain annotation errors including typographical errors, loose usage of terms and similar inaccuracies, under-predictions, over-predictions, domain errors, false negatives, and false positives (Gilks et al. 2002; Iliopoulos et al. 2003; Ouzounis and Karp 2002). Annotation errors can result as new data are constantly added and existing data are regularly modified, for example, when a protein-to-sequence assignment was made using sequence similarity rather than experimental data (Gilks et al. 2002; Iliopoulos et al. 2003; Ouzounis and Karp 2002). Given the evolving nature of public databases, array manufacturers and PAS must regularly update to the most current annotations. Figure 1 outlines the construction of the Affymetrix GeneChip® Mouse Genome 430 2.0 array from source data to probe set annotations such as gene symbol and Entrez Gene IDs (Affymetrix)(a,b,c). Some have recommended using custom chip description files that essentially redefine the probe assignments to probe sets (and/or mask certain probes), a process we refer to as “re-mapping”(Andrade et al. 1999; Dai et al. 2005; Lu et al. 2007; Shi et al. 2006; Stalteri and Harrison 2006). Here we focus on the assignment of a gene symbol to the representative sequence ID, UniGene/GenBank, for each probeset, a process we refer to as “annotating” and “re-annotating”(Du et al. 2007; Mattes 2004; van den Berg et al. 2009; Verdugo and Medrano 2006). This focus allows us to compare annotations recommend by Affymetrix with those provided by commercial PAS. Affymetrix updates probeset annotations 3–4 times per year, with each release yielding only small changes (2–4%) in annotations (e-mail correspondence). Pathway analysis software such as Ingenuity Pathways Analysis (IPA), GeneGO and Pathway Studio (PS), also have quarterly releases, reflecting both annotation changes and software upgrades. Thus one might expect minor changes in PAS annotations and the associated networks and functional results with each new release.
Figure 1. Affymetrix GeneChip® Mouse Genome 430 arrays: from source data to probesets and gene symbols.

A. Sequence data are compiled from multiple sources, and B. synthesized to produce 25mer probes. Affymetrix provides the probe sequences, so the user can C. either use Affymetrix’s probeset annotations or re-map the assignment of probes to probesets using a custom chip definition file. Affymetrix provides the target UniGene and GenBank sequence ID for each probeset. These ID types are static as they indicate the reference sequence used to construct a probeset. D. In addition, each reference sequence may correspond to a particular gene symbol. This assignment is considered dynamic as it can change as the source databases evolve. Affymetrix regularly updates these dynamic annotations 3–4 times per year, a process that we refer to as “re-annotating”. E. Pathway analysis software can also be used to re-annotate IDs (Affymetrix a,b,c).
Re-annotation and conversion among gene identifiers IDs, including gene symbol and gene alias, PID, GenBank, RefSeq and Entrez Gene IDs, are fraught with difficulty (Shi et al.). Often several PID, RefSeq and GenBank IDs correspond to the same gene symbol/Entrez Gene ID, and information can be lost or altered in translation (Stalteri and Harrison 2006; Verdugo and Medrano 2006). Entrez Gene (Li et al. 2006; Mattes 2004), RefSeq (Shi et al. 2006; Stalteri and Harrison 2006) and gene symbol (Verdugo and Medrano 2006) identifiers are recommended for annotating microarray probesets. While gene symbols are arguably the most meaningful to readers, they may require researchers to choose between a HUGO gene symbol or alias, or, alternatively, reporting both. Animal models add an additional level of complexity if one wishes to translate native species’ gene IDs to human IDs. Finally, array manufacturers may assign multiple gene symbol IDs per PID, without recommending which ID to use. Even with a recommendation, specialized software is often needed to accurately extract the recommended gene symbols (and/or other ID types) because Microsoft® Office Excel (2007 and previous versions) will convert some IDs such as “MARCH1” to numerical dates and some RIKEN IDs to exponential numbers, both of which are unrecognizable in downstream analyses. As a result, researchers often rely on annotation software even if the array manufacturer provides probeset annotations.
Affymetrix 3′ chips’ NetAffx annotation files such as those from the Mouse 430 2.0 array present another problem when there are multiple IDs annotating the same probeset ID (~3.2% of na29 probesets). In this scenario, the order of IDs is often inconsistent across ID types. For example, the probeset ID 1415927_at from the Mouse 430 2.0 array corresponds to the following set of Entrez Gene IDs: “100048431 /// 11464” and gene symbol: “Actc1 /// LOC100048431” in the NetAffx annotation file v29. So that if one selects the first identifier from the Entrez Gene column, the result is a pseudogene which is dropped by PAS. On the other hand, if one selects the first identifier from the gene symbol column the result is Actc1, a well-annotated gene. Similarly, the probeset ID 1415781_a_at corresponds to four Entrez Gene IDs and four gene symbols, but the ordering differs (the 3rd Entrez Gene ID 170930 corresponds to the 4th gene symbol, “Sumo2”). The good news is that these inconsistencies appear more likely to point to “no-annotation” (ie: a pseudogene) rather than “mis-annotation” (ie: one ID annotating the incorrect gene). Furthermore, free ID conversion tools are available, such as DAVID (http://david.abcc.ncifcrf.gov/conversion.jsp) and Clone|Gene ID Converter (http://idconverter.bioinfo.cnio.es/). Since the Affymetrix array documentation does not provide a recommendation on which ID one should use, and how to handle PIDs with multiple gene annotations, PAS companies and researchers decide themselves or acquire recommendations from Affymetrix through direct consultation.
Annotation errors often go unnoticed, particularly in microarray data analysis where the data sets are large and investigators are separated from their raw data by computer programs that are assumed to be accurate, which is not always the case. Here we show how annotations, networks and/or functional results change: 1) over time, 2) across input identifier types, and 3) among different PAS. We conducted these analyses using data from the Affymetrix GeneChip® Mouse Genome 430 2.0 Array and third party pathway analysis software including Ingenuity Pathways Analysis® (IPA), GeneGO MetaCore v5.4, and Ariadne’s Pathway Studio™ demo 7.0 (ResNet Mammalian database). Since PAS is becoming increasingly important for analyzing large genetic data sets, and PAS results can affect subsequent research directions, the accuracy of this data is vital as research findings are translated into the clinical arena. To address this critical issue, we offer recommendations that can help mitigate PAS inaccuracies.
Results
Canonical pathway results over four Ingenuity Pathway Analysis (IPA) and NetAffx releases
To study temporal effects on IPA results we followed the rankings of three pathways that were relevant to our disease model (constructed from 678 probesets differentially expressed between disease and control mice) over four IPA releases from March 2008 (v6.0), September 2008 (v6.5), December 2008 (v7.0) and February 2009 (v7.1). Figure 2 illustrates the relative change in canonical pathway percentiles for glucocorticoid receptor signaling (GRS), PPAR/RXR activation (PRA) and protein ubiquitination (PU). GRS experienced the most dramatic change, shifting from the 79th percentile in v6.0 to the 31st percentile in v6.5. PRA also experienced a substantial decrease in percentile from the 48th in v6.0 to the 4th in v7.1. PU increased from the 17th percentile v6.0 to the 41st percentile in v6.5, and then returned to the 17th percentile in v7.1. IPA recommends reporting top ranked pathways. This approach would cause our canonical pathway results to vary substantially depending on the IPA release used for the analysis.
Figure 2. Percentiles of three canonical pathways over four IPA releases (v6.0, v6.5, v7.0, v7.1).

A canonical pathway analysis of 678 probesets of interest was conducted with four different IPA releases. “Glucocorticoid Receptor Signaling” experienced the most substantial change between consecutive releases, decreasing from the 79th percentile (v6.0) to the 31st percentile (v6.5). “PPAR/RXR Activation” experienced the most substantial percentile change between v6.0 and v7.1, decreasing from 48th to 4th. Percentiles were calculated out of the set of pathways that achieved significance at the 0.05 level for each analysis, where v6.0 had 29 significant pathways, v6.5 had 39, v7.0 had 48, v7.1 had 53.
Gene symbol annotations of PIDs over four IPA and NetAffx releases
For the same set of 678 differentially expressed PIDs, we compared the IPA and Affymetrix GeneChip® Mouse Genome 430 2.0 Array gene symbol annotations over four IPA (v6.0, 6.5, 7.0 and 7.1) releases and the corresponding Affymetrix releases (na24, na26, na27) from March 2008 to February 2009 (Figure 3A). The percentage of annotated PIDs ranged from 86.7–97.3% across IPA releases and 96.1–96.4% across Affymetrix annotations (Figure 3B).
Figure 3. Ingenuity Pathways Analysis (IPA) and Affymetrix GeneChip® Mouse Genome 430 2.0 Array (Affymetrix a) annotation status for 113 PIDs over four annotation releases.
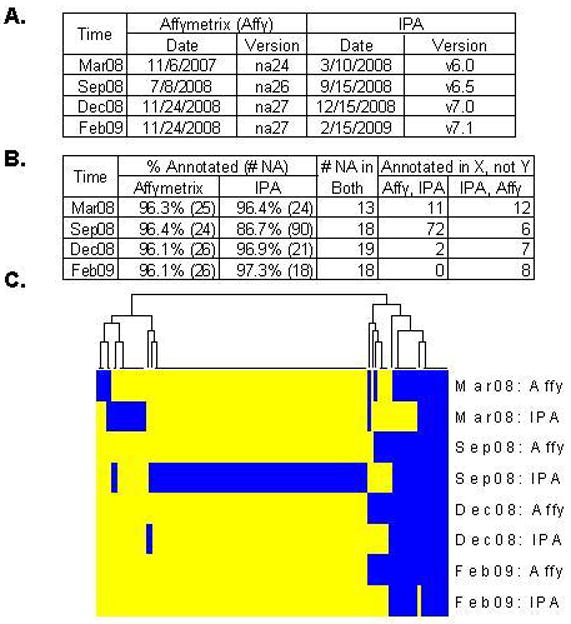
A. IPA release and Affymetrix annotation information. B. Numbers of annotated PIDs among 678 PIDs of interest were compared between Affymetrix and IPA over four IPA releases. Affymetrix consistently annotated 96.1–96.4% of PIDs while IPA varied from 86.7–97.3%, with 90 PIDs that were not annotated by IPA in September 2008. C. Heatmap view of a 113 PID subset (of the 678 set) that lacked a gene symbol annotation at least once from either Affymetrix or IPA over the four time points. Annotated PIDs are indicated in yellow and unannotated in blue. September 2008 (IPA v6.5) had an unusually high percentage of missing annotations in comparison to other versions (v6.0, v7.0, v7.1).
Figure 3C presents a heatmap illustrating how the absence/presence of annotations linking individual PIDs to genes changed over time. This figure’s x-axis represents 113 probesets that were unannotated at least once by either IPA or Affymetrix. The y-axis is ordered by time and March 2008 compares the oldest IPA version and the oldest Affymetrix annotation file, while February 2009 denotes the most recent version comparison. In March 2008, 25 out of 678 probesets were not annotated by Affymetrix (Mouse430_2.na24.annot.csv), 24 out of 678 were not annotated by IPA (v6.0) and 13 were not annotated by either company. In September 2008, about the same number of PIDs were unannotated (24/678) by Affymetrix (Mouse430_2.na26.annot.csv), but the percentage unannotated by IPA increased from 3.6% (v6.1) to 13.3% (v6.5). The percentage of missing gene symbol annotations from Affymetrix was fairly consistent across versions, with an average of 3.7% (95% CI: 3.56–3.91%). In comparison, the average percentage of missing gene symbol annotations from IPA was 5.7% (95% CI: 0.58–10.8%). The annotation loss observed in IPA v6.5 was due to a software problem that was then resolved in the subsequent release, which followed about 3 months after the v6.5 release (personal correspondence from IPA).
Annotation differences across a single release of three different PAS
Pathway analysis can begin with a variety of input ID types, and the gene symbol annotations provided by PAS for your input list can be exported from the software. We compared IPA, GeneGO and Pathway Studio gene symbol annotations for five different ID types: PID, Entrez Gene, gene symbol, GenBank and RefSeq from the Affymetrix NetAffx (v29, released 7/1/09) annotation file for the full GeneChip® Mouse Genome 430 2.0 Array. In the case where the Affymetrix annotation file listed multiple IDs for a PID, the first ID was selected (see Methods sections for details). Figure 4 is a graphical representation of Table 1 and shows that importing either Entrez Gene or PID into the pathway analysis software consistently resulted in the highest percentage of gene symbol annotations. The percentage of Entrez Gene IDs annotated with unique gene symbols had closest agreement with the percent annotated by Affymetrix. The percentage of GenBank IDs annotated with gene symbols was low for GeneGO and PStudio, while IPA had difficulty recognizing the gene symbols provided by Affymetrix. GenBank and gene symbol IDs exhibit the most inter-software variation, with IPA leading by >10% for GenBank IDs and trailing by 10–15% for gene symbols. RefSeq IDs had the most consistent gene symbol annotations across all three PAS, although there were about 7.6% fewer annotations than those provided by Affymetrix. GeneGO and Pathway Studio had similar annotation percentages for all ID types. On average, GeneGO annotated the most ID types but often annotated more IDs than Affymetrix (for example, GeneGO found 4.9% more unique gene symbol annotations for PIDs than Affymetrix provided). This was because GeneGO sometimes exported a single gene symbol with both the official gene symbol from NCBI and its alias(es) (personal correspondence from GeneGO). Fortunately, this problem is expected to be resolved in an upcoming GeneGO release.
Figure 4. Percent of PIDs annotated with unique gene symbol out of 45037 PIDs, by IPA, GeneGO (GGO) and Pathway Studio (PST) in relation to the % annotated by Affymetrix.

This graph represents the “% Exported out of 45037 vs. Affy” data in Table 1. Results are sorted by ID type. The percentage of Entrez Gene IDs that were annotated with gene symbol are in close agreement with Affymetrix for all PAS. GGO and PST have more similar annotation percentages than IPA. The naming convention for the x-axis is [Gene ID.PAS]. Average magnitudes are calculated for ID types.
Table 1. Number of IDs recognized and number of unique gene symbols exported by IPA, GeneGO and Pathway Studio.
Each program assigned gene symbols to four different input ID types from the Affymetrix Mouse 430 2.0 array excluding control probesets (NetAffx v29, released 7/1/09). The “# IDs Recognized” column gives the number of IDs that were recognized by the PAS for each of the five ID types (Entrez Gene, PID, gene symbol, RefSeq, GenBank). The “# Unique gene symbols Exported” column gives the number of unique gene symbol annotations that were exported by the software. The “Species” column indicates whether the exported gene symbols corresponded to mouse (M) and/or human (H) genomes. The “% Exported out of 45037 vs. Affy” column is calculated for each PAS by dividing the “# Unique gene symbols Exported” by the number of unique probe set IDs and subtracting from this Affymetrix’s % PIDs annotated (21417/45037 = 47.6%). For example, GeneGO’s 4.9% mouse gene symbol annotations for PIDs was calculated by: 23614/45037 – 47.6% = 4.9%. Although Pathway Studio is a demo version it is comparable to the full version in terms of its gene symbol annotations (personal correspondence from Pathway Studio, February 2010).
| Affy (v29): # unique IDs | Software | Version | # IDs Recognized | # Unique gene symbols Exported | Species | % Exported out of 45037 vs. Affy |
|---|---|---|---|---|---|---|
| Entrez Gene ID (21450) | IPA | 7.6 build 76537 | 20979 | 20799 | M,H | −1.4% |
| GeneGO | 5.4 build 19940 | 21446 | 21446 | M | 0.1% | |
| PStudio | 7.0 demo | 21447 | 21275 | M,H | −0.3% | |
| Probe ID (45037) | IPA | 7.6 build 76537 | 38825 | 20711 | M,H | −1.6% |
| GeneGO | 5.4 build 19940 | 42055 | 23614 | M | 4.9% | |
| PStudio | 7.0 demo | 40140 | 20516 | M,H | −2.0% | |
| Gene Symbol (21417) | IPA | 7.6 build 76537 | 14915 | 14886 | M,H | −14.5% |
| GeneGO | 5.4 build 19940 | 21356 | 21844 | M | 0.9% | |
| PStudio | 7.0 demo | 19249 | 19250 | M,H | −4.8% | |
| RefSeq ID (18217) | IPA | 7.6 build 76537 | 18153 | 17990 | M,H | −7.6% |
| GeneGO | 5.4 build 19940 | 17922 | 17922 | M | −7.8% | |
| PStudio | 7.0 demo | 18169 | 17997 | M,H | −7.6% | |
| GenBank ID (39015) | IPA | 7.6 build 76537 | 28601 | 19433 | M,H | −4.4% |
| GeneGO | 5.4 build 19940 | 15795 | 14066 | M | −16.3% | |
| PStudio | 7.0 demo | 15759 | 13938 | M,H | −16.6% |
Network and functional annotations across a single PAS release
We compared the number of Entrez Gene IDs recognized by each PAS (as shown in Table 1) with its corresponding percentages of network and function information available for these Entrez Gene IDs. Entrez Gene IDs were selected for this analysis because all PAS had close agreement with Affymetrix (in terms of percentage of annotations, Figure 4). Furthermore, GeneGO’s annotations for PIDs exceeded Affymetrix’s annotations, and IPA had difficulty recognizing Affymetrix gene symbols.
Due to the fact that the network and function databases were not readily comparable (Pathway Studio was not manually curated and IPA did not have a GO analysis option), our focus in this section was on the network and functional annotation differences within each PAS rather than across PAS. All three PAS identified more network than function information (Table 2). IPA identified 7.6% more interactions than functions, and GeneGO had the greatest difference with 50% more network than proprietary functional annotations. GeneGO identified 31.1% more public than proprietary functional annotations, which is expected since the manual curation process should exclude many of GO’s inferred and weak annotations. Interestingly, GeneGO reports 17.9% fewer GO annotations than Affymetrix (which reports all GO annotations), suggesting that GeneGO’s GO analysis may also exclude some inferred annotations.
Table 2. Percent of Entrez Gene IDs that are eligible for network and functional analysis.
Entrez Gene IDs were analyzed because the percentage of Entrez Gene IDs annotated were similar between PAS and Affymetrix. GeneGO had nearly 50% and 20% more network annotations than its proprietary and public functional annotations, respectively. IPA had 7.6% more network annotations than proprietary function annotations, and Pathway Studio had 3.9% more. GeneGO had fewer proprietary functional annotations (31.1%) than its Gene Ontology annotations because the manual curation process removes many of GO’s inferred annotations (http://www.geneontology.org). We used Pathway Studio’s ResNet Mammalian demo database, which contains about 10% of the full database’s network and proprietary functional information (personal correspondence from Pathway Studio, February 2010).
| Software | Version | #Entrez Gene IDs | A. % Network Info. (#) | B. % Functional Annotations | |
|---|---|---|---|---|---|
| Proprietary | Public (GO)* | ||||
| IPA | 7.6 build 76537 | 20979 | 63.2% (13257) | 55.6% (11669) | --- |
| GeneGO | 5.4 build 19940 | 21446 | 75.3% (16144) | 25.5% (5462) | 56.6% (12137) |
| PStudio | 7.0 demo | 21447 | 37.5% (8038) | 33.6% (7206) | 72.1% (15456) |
| Affymetrix | na29 | 21450 | --- | --- | 74.5% (15975) |
IPA does not allow a separate analysis of public functional annotations from GO.
Discussion
Investigators employ expression microarrays to measure changes in mRNA concentrations that result from different biological conditions, such as treatments, time-points and genetic background. They use pathway analysis software to provide biological meaning and significance to the changes measured. Both enterprises depend on connecting the raw data to biology, the underlying genes, gene products and their interactions. The integrity of this process requires that those connections be transparent and open to re-evaluation.
The shift in genome informatics from gene identification to gene annotations, including functions, interactions and pathway involvement, is supported by both commercial PAS and freely available software for academic use, including VisANT (http://visant.bu.edu/), R packages (http://www.bioconductor.org/), Database for Annotation, Visualization and Integrated Discovery (DAVID, http://david.abcc.ncifcrf.gov/), and Babelomics (http://www.babelomics.org/). While these free resources are certainly valuable and can accomplish most commercial PAS tasks, here we have focused on proprietary software for two reasons. First, there is no “gold standard” gene-to-gene interaction database such as NCBI’s sequence, homology, and expression databases. As a result, commercial PAS likely have an advantage over freeware in terms of breadth and quality of interaction data. Until a standardized system (or requirement) is in place for researchers to contribute these data, one may benefit from commercial PAS databases. Second, commercial PAS, like most commercial businesses, are not proactive in communicating defects. Since scientific and clinical progress is affected by PAS accuracy, we hope to promote communication among commercial PAS and the research community. Thus we have limited our scope to three popular commercial software packages: Ingenuity Pathways Analysis® (IPA), GeneGO MetaCore™ v5.4, and Ariadne’s Pathway Studio™ demo 7.0 (ResNet Mammalian database).
We have shown that commercial PAS gene symbol annotations and their resulting canonical pathways can change substantially over time. While the 10% annotation loss observed between IPA versions 6.0 and 6.5 was caused by a software problem and is atypical (personal correspondence from IPA), even moderate changes can have noticeable effects on canonical pathway results. Since pathway results can govern data interpretation and subsequent research directions, users should verify results with an additional software version. It is also possible to use more than one analysis program, but this may warrant a more conservative interpretation of significance levels.
IPA, GeneGO and Pathway Studio differ from each other and Affymetrix in terms of their percentage of gene symbol annotations for a given input ID type, which illustrates the existance of an annotation problem. Since PAS must recognize input IDs and accurately assign gene symbols before moving to more complex analyses, this step is critical and perhaps undervalued by PAS manufacturers and users.
We have found that PAS give more consistent annotations when Entrez Gene and RefSeq input IDs are used, so that these ID types might work best if one wishes to compare results among different PAS. Furthermore, Entrez Gene IDs yielded the highest percentage of GS annotations, so this ID type may be preferable to RefSeq for PAS.
As expected the IPA and GeneGO databases had fewer proprietary functional annotations than Affymetrix’s GO annotations due to manual curation which removes poorly supported functional annotations. However, GeneGO and Pathway Studio give the user the option to use the GO database, and interestingly GeneGO’s GO annotations were substantially fewer than those provided by Affymetrix and Pathway Studio. Perhaps even the GO data are curated by GeneGO, while the proprietary GeneGO database consists of more stringent curation criteria and additional annotations retrieved from the literature rather than GO.
Based on our analysis of annotations across time and input ID types, we recommend the following guidelines for using commercial pathway analysis software.
PAS version numbers should be reported when describing results as different software releases can result in substantial differences in pathway results
Furthermore, data should be analyzed with two or more releases of the same PAS before publication
Entrez Gene IDs should be used as input for commercial PAS
RefSeq IDs or dated Entrez Gene IDs should be reported along with PIDs when summarizing microarray results and distributing data to others for analysis.
Guideline (4) is useful because the original manufacturers’ probeset IDs reveals how conclusions were met and allows for re-evaluation in light of current information. While these guidelines will help mitigate annotation and PAS errors, users should take precautions in interpreting and publishing PAS results.
Just as companies outside the scientific community notify customers when there are problems with their products, we encourage PAS companies to do the same. Companies achieve the highest consumer confidence and loyalty by communicating clearly about problems, immediately initiating their own investigation, and quickly providing a solution. We propose that PAS industries notify all customers by e-mail and a user accessible webpage (that is available to all users at all times, ie it is not limited by concurrent usage restrictions) of significant software and annotation changes, and particularly of known errors in PAS releases. The notification should include detailed documentation explaining the nature of the issue, its potential impact, and recommendations for affected customers. Furthermore, customers should have access to past software releases to see exactly how their annotation and/or analysis results were affected. Finally, PAS should retain all versions of array annotations and make them available so users can track changes at the annotation level.
The results we have presented demonstrate the potentially serious impact of variations in versions of PAS and the choice of ID types analyzed and reported. However, a basic problem with pathway and network analyses is the incomplete information we have regarding genes, the functions of gene products, and the functional interrelationships of these gene products. To assist in addressing PAS problems rapidly, and potentially facilitate the development of a structured interaction data base for researcher contributions we suggest that there is a need for a publicly available wiki type website or for example using www.openwetware.org (Protocols->In Silico->Data Analysis) for exchange of information. This forum would allow timely sharing of database annotation errors and PAS issues. It would improve confidence in published pathway analysis results and, most critically, in the interpretation of clinical results. As researchers would no longer face these issues independently, the outcome would be improved accuracy and efficiency in the interpretation of research and clinical data.
Material and Methods
In the following we summarize methods as well as software and annotation versions. All experiments were performed according to UCLA Animal Research Committee (ARC) approved protocols.
Microarray Expression Analysis
RNA samples were hybridized to Affymetrix GeneChip® Mouse Genome 430 2.0 arrays as previously described (MacLennan et al. 2006). The data were normalized using GC Robust Multi-array Average in R and filtered with dChip using a 1.2 fold change to yield 678 PIDs (Li and Hung Wong 2001; R 2009; Wu 2004).
Canonical pathway and PID annotation results over four PAS and NetAffx releases
Ingenuity Pathways Analysis versions 6.0, 6.5, 7.0, and 7.1 were used to elucidate potentially important pathways enriched in our list of 678 probesets identified by dChip. Current and archived release notes were obtained directly from the IPA website and via IPA technical support. Affymetrix PIDs were uploaded into IPA and a “Core Analysis” was performed.
We compared IPA software annotations of our list of 678 PIDs over the course of four IPA releases from 2008 to 2009 with the corresponding Affymetrix annotations (v24–27). For each release, we counted the number of PIDs annotated with gene symbols by IPA, the number annotated by Affymetrix and the number annotated by both. IPA annotations were obtained as described below.
Gene symbol, network and functional annotations across a single release of three different PAS
We considered three commercial PAS that were curated at least 2–3 times a year and available as a trial or purchase: IPA, GeneGO, and Pathway Studio (Adriaens et al. 2008). All 45,037 PIDs from the Affymetrix GeneChip® Mouse Genome 430 2.0 were used in the software comparison. We analyzed five different IDs types from the Affymetrix na29 annotation file: Entrez Gene, PID, gene symbol, RefSeq and GenBank. In cases where the annotation file listed multiple IDs for a PID (for example, there were 1460 PIDs with multiple gene symbols), the first ID was used. We adopted this strategy because a PID should only be represented by one gene ID in downstream analyses (such as functional enrichment analysis), and it is simple and intuitive to select the first ID.
These sets of five IDs were separately uploaded into the three PAS, and we recorded the number of unique gene symbols that were recognized by each analysis package. The unique gene symbols were obtained by exporting the corresponding gene symbol for each ID type from PAS and removing duplicate gene symbols in R (R 2009), for a total of 15 files. The data file for each ID type consisted of two columns, where the first contained the IDs and the second contained a vector of dummy expression data (the dummy expression data was required by Pathway Studio, see Supplementary Material 1 for details). An overview of methods for each program are described below, and detailed tutorials on how to construct Tables 1 and 2 are provided in Supplementary Material 1 and 2, respectively.
Affymetrix GeneChip® Mouse Genome 430 2.0 NetAffx v29 (3/12/09) (Affymetrix)(a)
Using the NetAffx v29 annotation file for the Affymetrix GeneChip® Mouse Genome 430 2.0 Array, we selected the following identifiers for our analyses: “Probe Set ID” (column 1), “Representative Public ID”, “Gene Symbol”, “Entrez Gene”, “RefSeq Transcript ID”. “Representative Public ID” was used as our GenBank ID. The Mouse 430 array consists of 45101 probe sets, but we removed the 64 control probe sets (that had an “AFFX” prefix), which resulted in the 45037 PIDs reported in Table 1. We refer to this set of 45037 PIDs as the “full” mouse array. In the case where a PID was annotated with multiple IDs of the same type (for example, there were 1460 PIDs that had multiple gene symbol annotations), we selected the first ID. We later learned that instead of selecting the first ID type, a better method for annotating genes with multiple IDs in 3′ arrays such as the GeneChip® Mouse Genome 430 2.0 Array is to select the first RefSeq ID and translate this ID type to gene symbol or Entrez Gene IDs using NCBI or the UCSC Genome Browser (personal correspondence from Affymetrix). Since this recommendation is not in any written documentation provided by Affymetrix, we adopted the intuitive strategy of selecting the first ID type.
The three GO columns “Gene Ontology Biological Process”, “Gene Ontology Cellular Component” and “Gene Ontology Molecular Function” of the NetAffx v29 file were used to obtain the Affymetrix functional annotation count in Table 2. A GO ID was considered present if at least one of these three columns contained at least one ID.
Ingenuity Pathways Analysis v7.6 build 76537
From the main “Quick Start” screen we selected “Analyze dataset” and “Upload”, which brings up a “Create Core Analysis” window. This window provides the number of IDs that are annotated, unannotated, network eligible, and “Functions/Pathways/Lists Eligible” or “functions eligible”. The annotated number was recorded as the “# of IDs recognized” in Table 1. The network eligible and functions eligible values were recorded in Table 2. Under the “Mapped IDs” tab we exported the data and removed non-unique IDs with R software to obtain the “# unique gene symbols exported” in Table 1.
GeneGO MetaCore+MetaDrug™ (version 5.4, build 19940)
From the main “Data Manager” screen we selected “Upload data” from the file menu. Clicking on the data set under “Active Data” brings up a properties window that summarizes the number of IDs recognized, network eligible (“On networks”) and functions eligible (“GeneGo processes”). We exported the list of gene symbol annotations by right clicking on the active data file and selecting “Export Genes”. This brought up a window titled “Lists of genes” where we selected “EntrezGene ID” and “Gene Symbol ID” for export. The numbers of unique gene symbols from this exported list were reported in Table 1 “# unique gene symbols exported”.
Pathway Studio (ResNet Mammalian demo database v7.0)
Under the “Home” tab we selected “Import” and “Experiment”. This brought up an “Experiment Import Wizard” where we identified the ID and expression columns in our file. On step 7 of the import wizard, we provided the following types of probeset identifiers corresponding to the appropriate ID type: a) PID: “Use mapfile”, “AffyMammal.txt”, b) GenBank: “GenBank ID”, c) Entrez Gene: “Entrez GeneID” and d) gene symbol: “Name”. Before importing, Pathway Studio provided the number of “Mapped Rows” which was recorded in Table 1 in the “# of IDs recognized” column. Once the data were imported, we selected all rows and “Send Selected Rows to Text Format” from the Tools menu. The numbers of unique gene symbols from this exported list were reported in Table 1 “# unique gene symbols exported”. To obtain network and pathway eligible genes, we selected “Blank Pathway” from the “New” menu on the “Folders” tab. Within this window we changed the view to a table format, and added in GO columns from the Tools menu. We then copied and pasted our gene list into this empty pathway. Entries in this results matrix with “connectivities” exceeding one were counted toward the number of network eligible genes (Table 2A). Genes that had at least one GO term were added to the count of GO eligible genes in Table 2B.
Footnotes
Web Resources
Ingenuity Pathways Analysis (IPA), (www.ingenuity.com)
GeneGO, (www.genego.com)
Pathway Studio (PS), (www.ariadnegenomics.com/products/pathway-studio)
Gene Ontology (GO), http://www.geneontology.org
Supplemental Methods
Supplemental Methods include two files describing how Tables 1 and 2 were generated, respectively, as well as Supplemental Table 1 with annotated versus unannotated raw data used to construct Figure 3.
Publisher's Disclaimer: This is a PDF file of an unedited manuscript that has been accepted for publication. As a service to our customers we are providing this early version of the manuscript. The manuscript will undergo copyediting, typesetting, and review of the resulting proof before it is published in its final citable form. Please note that during the production process errors may be discovered which could affect the content, and all legal disclaimers that apply to the journal pertain.
References
- Adriaens ME, Jaillard M, Waagmeester A, Coort SL, Pico AR, Evelo CT. The public road to high-quality curated biological pathways. Drug Discov Today. 2008;13:856–862. doi: 10.1016/j.drudis.2008.06.013. Affymetrix. (a) www.affymetrix.com (b) Technical Note: Array Design and Performance of the GeneChip Mouse Expression Set 430 ( http://www.affymetrix.com/support/technical/technotes/mouse430_technote.pdf) (c) Data Sheet, GeneChip Mouse Genome Arrays ( http://www.affymetrix.com/support/technical/datasheets/mg430arrays_datasheet.pdf) [DOI] [PMC free article] [PubMed]
- Andrade MA, Brown NP, Leroy C, Hoersch S, de Daruvar A, Reich C, Franchini A, Tamames J, Valencia A, Ouzounis C, Sander C. Automated genome sequence analysis and annotation. Bioinformatics. 1999;15:391–412. doi: 10.1093/bioinformatics/15.5.391. [DOI] [PubMed] [Google Scholar]
- Dai M, Wang P, Boyd AD, Kostov G, Athey B, Jones EG, Bunney WE, Myers RM, Speed TP, Akil H, Watson SJ, Meng F. Evolving gene/transcript definitions significantly alter the interpretation of GeneChip data. Nucleic Acids Res. 2005;33:e175. doi: 10.1093/nar/gni179. [DOI] [PMC free article] [PubMed] [Google Scholar]
- Du P, Kibbe WA, Lin SM. nuID: a universal naming scheme of oligonucleotides for illumina, affymetrix, and other microarrays. Biol Direct. 2007;2:16. doi: 10.1186/1745-6150-2-16. [DOI] [PMC free article] [PubMed] [Google Scholar]
- Gilks WR, Audit B, De Angelis D, Tsoka S, Ouzounis CA. Modeling the percolation of annotation errors in a database of protein sequences. Bioinformatics. 2002;18:1641–1649. doi: 10.1093/bioinformatics/18.12.1641. [DOI] [PubMed] [Google Scholar]
- Iliopoulos I, Tsoka S, Andrade MA, Enright AJ, Carroll M, Poullet P, Promponas V, Liakopoulos T, Palaios G, Pasquier C, Hamodrakas S, Tamames J, Yagnik AT, Tramontano A, Devos D, Blaschke C, Valencia A, Brett D, Martin D, Leroy C, Rigoutsos I, Sander C, Ouzounis CA. Evaluation of annotation strategies using an entire genome sequence. Bioinformatics. 2003;19:717–726. doi: 10.1093/bioinformatics/btg077. [DOI] [PubMed] [Google Scholar]
- Li C, Hung Wong W. Model-based analysis of oligonucleotide arrays: model validation, design issues and standard error application. Genome Biol. 2001;2:RESEARCH0032. doi: 10.1186/gb-2001-2-8-research0032. [DOI] [PMC free article] [PubMed] [Google Scholar]
- Li S, Li YH, Wei T, Su EW, Duffin K, Liao B. Too much data, but little inter-changeability: a lesson learned from mining public data on tissue specificity of gene expression. Biol Direct. 2006;1:33. doi: 10.1186/1745-6150-1-33. [DOI] [PMC free article] [PubMed] [Google Scholar]
- Lu J, Lee JC, Salit ML, Cam MC. Transcript-based redefinition of grouped oligonucleotide probe sets using AceView: high-resolution annotation for microarrays. BMC Bioinformatics. 2007;8:108. doi: 10.1186/1471-2105-8-108. [DOI] [PMC free article] [PubMed] [Google Scholar]
- MacLennan NK, Rahib L, Shin C, Fang Z, Horvath S, Dean J, Liao JC, McCabe ER, Dipple KM. Targeted disruption of glycerol kinase gene in mice: expression analysis in liver shows alterations in network partners related to glycerol kinase activity. Hum Mol Genet. 2006;15:405–415. doi: 10.1093/hmg/ddi457. [DOI] [PubMed] [Google Scholar]
- Mattes WB. Annotation and cross-indexing of array elements on multiple platforms. Environ Health Perspect. 2004;112:506–510. doi: 10.1289/ehp.6698. [DOI] [PMC free article] [PubMed] [Google Scholar]
- Ouzounis CA, Karp PD. The past, present and future of genome-wide re-annotation. Genome Biol. 2002;3 doi: 10.1186/gb-2002-3-2-comment2001. COMMENT2001. [DOI] [PMC free article] [PubMed] [Google Scholar]
- R. R: A language and environment for statistical computing. R Foundation for Statistical Computing; Vienna, Austria: 2009. http://www.R-project.org/ [Google Scholar]
- Shi L, Reid LH, Jones WD, Shippy R, Warrington JA, Baker SC, Collins PJ, de Longueville F, Kawasaki ES, Lee KY, Luo Y, Sun YA, Willey JC, Setterquist RA, Fischer GM, Tong W, Dragan YP, Dix DJ, Frueh FW, Goodsaid FM, Herman D, Jensen RV, Johnson CD, Lobenhofer EK, Puri RK, Schrf U, Thierry-Mieg J, Wang C, Wilson M, Wolber PK, Zhang L, Amur S, Bao W, Barbacioru CC, Lucas AB, Bertholet V, Boysen C, Bromley B, Brown D, Brunner A, Canales R, Cao XM, Cebula TA, Chen JJ, Cheng J, Chu TM, Chudin E, Corson J, Corton JC, Croner LJ, Davies C, Davison TS, Delenstarr G, Deng X, Dorris D, Eklund AC, Fan XH, Fang H, Fulmer-Smentek S, Fuscoe JC, Gallagher K, Ge W, Guo L, Guo X, Hager J, Haje PK, Han J, Han T, Harbottle HC, Harris SC, Hatchwell E, Hauser CA, Hester S, Hong H, Hurban P, Jackson SA, Ji H, Knight CR, Kuo WP, LeClerc JE, Levy S, Li QZ, Liu C, Liu Y, Lombardi MJ, Ma Y, Magnuson SR, Maqsodi B, McDaniel T, Mei N, Myklebost O, Ning B, Novoradovskaya N, Orr MS, Osborn TW, Papallo A, Patterson TA, Perkins RG, Peters EH, Peterson R, Philips KL, Pine PS, Pusztai L, Qian F, Ren H, Rosen M, Rosenzweig BA, Samaha RR, Schena M, Schroth GP, Shchegrova S, Smith DD, Staedtler F, Su Z, Sun H, Szallasi Z, Tezak Z, Thierry-Mieg D, Thompson KL, Tikhonova I, Turpaz Y, Vallanat B, Van C, Walker SJ, Wang SJ, Wang Y, Wolfinger R, Wong A, Wu J, Xiao C, Xie Q, Xu J, Yang W, Zhang L, Zhong S, Zong Y, Slikker W., Jr The MicroArray Quality Control (MAQC) project shows inter- and intraplatform reproducibility of gene expression measurements. Nat Biotechnol. 2006;24:1151–1161. doi: 10.1038/nbt1239. [DOI] [PMC free article] [PubMed] [Google Scholar]
- Stalteri M, Harrison A. Comparisons of annotation predictions for affymetrix GeneChips. Appl Bioinformatics. 2006;5:237–248. doi: 10.2165/00822942-200605040-00006. [DOI] [PubMed] [Google Scholar]
- van den Berg BH, Konieczka JH, McCarthy FM, Burgess SC. ArrayIDer: automated structural re-annotation pipeline for DNA microarrays. BMC Bioinformatics. 2009;10:30. doi: 10.1186/1471-2105-10-30. [DOI] [PMC free article] [PubMed] [Google Scholar]
- Verdugo RA, Medrano JF. Comparison of gene coverage of mouse oligonucleotide microarray platforms. BMC Genomics. 2006;7:58. doi: 10.1186/1471-2164-7-58. [DOI] [PMC free article] [PubMed] [Google Scholar]
- Wu Z, Irizarry RA, Gentleman R, Murillo F, Spencer F. A model based background adjustment for oligonucleotide expression arrays. John Hopkins University; Baltimore: 2004. [Google Scholar]