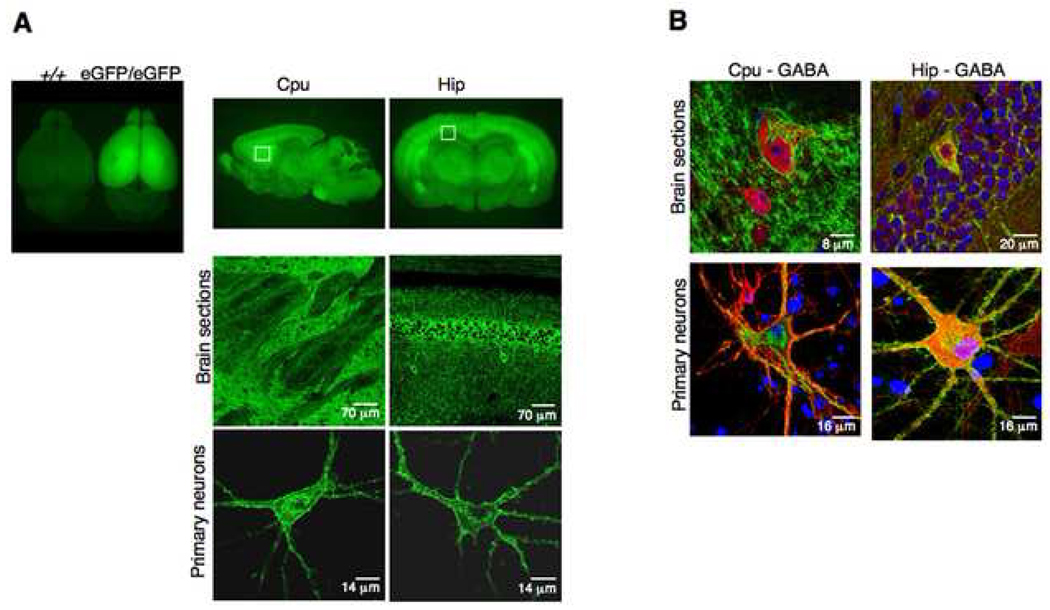
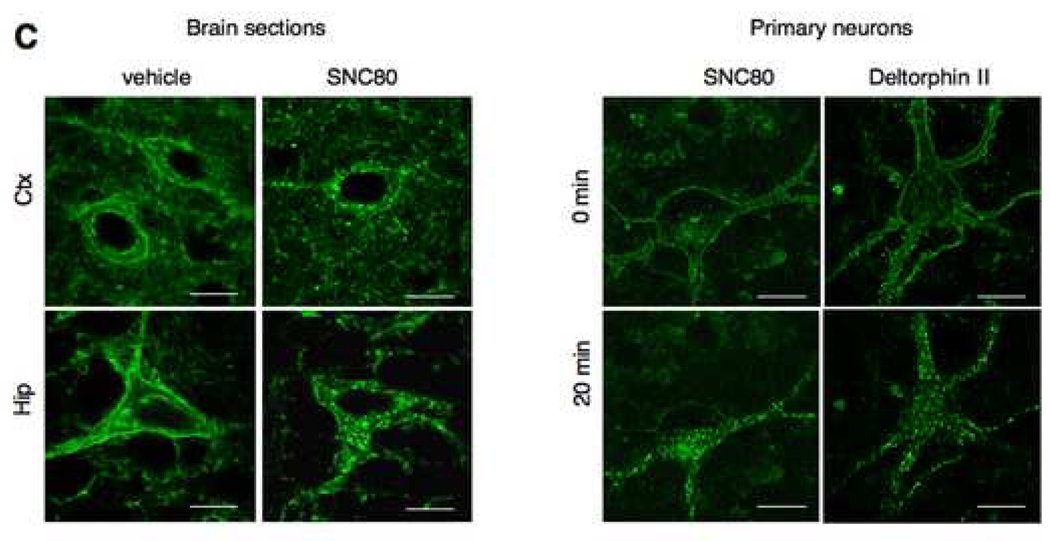
Fig. 2. Receptor imaging in delta-eGFP knock-in mice.
Images are adapted from Scherrer et al. (Scherrer et al., 2006) (A) Epifluorescence macroscopy shows the general anatomical distribution of delta receptors. Top left, whole brain from wild-type (+/+) and knock-in (eGFP/eGFP) mice; top midde, coronal section at the level of the caudate putamen (Cpu); top right, sagittal section at the level of the hippocampus (Hip). Confocal microscopy of regions delimited by insets reveals receptor distribution with a cellular resolution (middle panels). Confocal microscopy of primary neurons from caudate putamen and hippocampus highlights the subcellular distribution of delta receptors (bottom panels). (B) Immunostaining with GAD antibodies (red) identifies GABAergic neurons expressing fluorescent delta receptors in neurons from the Cpu (Cpu-GABA) and Hip (Hip-GABA) in either brain sections (top) or primary cultures (bottom). Nuclei are stained in blue. (C) Delta receptor internalization in vivo, upon exposure to delta agonists. Left panels show prominent surface labeling in cortical (Ctx) and hippocampal (Hip) neurons in brain sections of vehicle-treated animals (left) and the typical punctate pattern of internalized receptors in brain sections of SNC80-treated animals (right); Scale bars 8 µm. Right panels shows delta-eGFP labeling in striatal primary neurons before (0 min) and 20 minutes after exposure to both a non-peptidic (SNC80) and a peptidic (deltorphin II) delta agonist; scale bars 12 µm. In those preparations, the receptor internalization process can be observed in real time, using time-lapse confocal microscopy (see Scherrer et al., 2006).


