Abstract
Electrospinning can be used to selectively process a variety of natural and synthetic polymers into highly porous scaffolds composed of nano-to-micron diameter fibers. This process shows great potential as a gateway to the development of physiologically relevant tissue engineering scaffolds. In this study we examine how incremental changes in fiber alignment modulate the material properties of a model scaffold. We prepared electrospun scaffolds of gelatin composed of varying fiber diameters and degrees of anisotropy. The scaffolds were cut into a series of “dog-bone” shaped samples in the longitudinal, perpendicular and transverse orientations and the relative degree of fiber alignment, as measured by the fast Fourier transform (FFT) method, was determined for each sample. We measured peak stress, peak strain and the modulus of elasticity as function of fiber diameter and scaffold anisotropy. Fiber alignment was the variable most closely associated with the regulation of peak stress, peak strain and modulus of elasticity. Incremental changes, as judged by the FFT method, in the proportion of fibers that were aligned along a specific axis induced incremental changes in peak stress in the model scaffolds. These results underscore the critical role that scaffold anisotropy plays in establishing the material properties of an electrospun tissue engineering scaffold and the native extracellular matrix.
INTRODUCTION
The electrospinning process shows great potential as a gateway for the development and fabrication of physiologically relevant tissue engineering scaffolds [1–3]. A variety of native proteins [4–6], synthetic polymers [7–9], and blends of native and synthetic materials [10] can be selectively processed and electrospun into highly porous scaffolds composed of small diameter fibers. The physical, biochemical, biological and material properties of this unique class of materials can be regulated at several sites in the production process. Physical properties, including fiber diameter and pore dimension, can be regulated by controlling the composition of the electrospinning solvent and the identity, concentration and/or degree of chain entanglements (viscosity) present in the starting polymer(s) [11,12]. The structural profile of the selected materials can even be modulated after the completion of the electrospinning process through nanofiber self-assembly events [13]. The biochemical profile of scaffolds can be manipulated through the addition of soluble growth factors [14] and other pharmaceuticals [15,16] during and/or after the electrospinning process. Biological properties can be further tailored to specific applications by controlling fiber identity and alignment.
Emerging evidence suggests that fiber alignment and overall scaffold anisotropy play a critical role in determining the material properties of electrospun materials [7,17,18]. However, efforts to examine how scaffold material properties develop as a function of these characteristics have been limited; developing an objective, quantitative measure of fiber alignment is a challenging task. In previous studies we adapted and used the fast Fourier transform (FFT) to measure the relative degree of fiber alignment present in an electrospun scaffold [17,19]. We observed distinct material properties as scaffold anisotropy reached a critical threshold and here we extend our preliminary observations to define this threshold more precisely. In this study we examine how fiber diameter and specific degrees of fiber alignment, as determined by the FFT method, interact with the testing angle to dictate the material properties of an electrospun scaffold.
To explore how fiber alignment regulates material properties, calfskin gelatin scaffolds of varying fiber diameters are electrospun onto a rectangular, grounded mandrel. Differing degrees of fiber alignment can be induced by rotating the mandrel at a constant rate between 0 and 6000 rpm [15]. Scaffolds are cut into “dog-bone” shaped samples (for materials testing purposes) in the longitudinal, perpendicular or transverse orientations. From these samples the relative degree of fiber alignment, as measured by the FFT method, is determined. The samples are then tested to failure using a materials testing machine. From the data it appears that fiber alignment is the variable most closely associated with changes in scaffold material properties, and increasing the proportion of fibers aligned along a specific axis induces incremental changes in peak stress. These results emphasize the central role that scaffold anisotropy plays in determining the material properties of the native matrix and engineered scaffolds.
MATERIALS AND METHODS
Electrospinning
Reagents were purchased from Sigma Aldrich (St Louis, MO) unless noted. Gelatin was suspended (120, 150 and 180 mg ml−1) and agitated in 2,2,2 trifluoroethanol (TFE) for 24 h. Electrospinning suspensions were loaded into a 20 ml Becton Davis syringe capped with an 18 gauge blunt-tipped needle. The air gap distance between the source suspension and the grounded mandrel was set to 20 cm. A Harvard perfusion pump was used to meter the delivery of the electrospinning suspensions to the electric field. The positive output lead of a high-voltage supply (Spellman CZE1000R; Spellman High Voltage Electronics Corporation) was attached by an alligator clip to the blunt-tipped needle. For a detailed schematic of the electrospinning system, see Ref. [4]. Electrospinning was conducted at an accelerating voltage of 25 kV. The rate of solvent/polymer delivery was set at the maximal rate that did not induce dripping from the tip of the syringe. A stainless steel rectangular mandrel (75 × 20 × 6 mm) was used as a grounded target.
The target mandrel was regulated to rotate between 0 to 6000 rpm to induce varying degrees of alignment in the electrospun scaffolds. A digital stroboscope (Shimpo Instruments DT3-11A) was used to continuously monitor the rotational speed of the target mandrel. Under the conditions of this study, fiber diameter remained constant over the range of mandrel rpm used to collect the scaffolds (not shown, see Ref. [17]). Samples were stored in a desiccation chamber to limit hydration prior to analysis.
Scanning electron microscopy
Average fiber diameter was determined from samples processed for conventional scanning electron microscopy (SEM, JEOL JSM-820). Dry, unfixed electrospun scaffolds were sputter coated with gold for imaging. SEM images were captured on Polaroid film, digitized via a flatbed scanner and analyzed with NIH ImageTool (UTHSCSA version 3). Average fiber diameter was determined from measurements taken perpendicular to the long axis of the fibers within representative microscopic fields (25 measurements per field). All measurements were calibrated from size bars incorporated into the SEM images at the time of capture (N = 3 from independent experiments).
Light microscopy
The scaffolds were imaged using a Nikon TE300 microscope equipped with a Nikon DXM 1200 digital camera. Bright-field images (3840 × 3072 pixels) were captured with a 20× 0.40 NA bright-field objective lens. All images were archived as TIFF files.
Fast Fourier Transform
As described in detail in a previous study, the FFT method was used to evaluate relative fiber alignment in electrospun scaffolds [17]. For a complete description of this method see Ref. [19]. The FFT function converts information present in an optical data image from a “real” domain into a mathematically defined “frequency” domain. The resulting FFT output image contains grayscale pixels that are distributed in a pattern that reflects the degree of fiber alignment present in the original data image. A graphical depiction of the FFT frequency distribution is generated by placing an oval projection on the FFT output image and conducting a radial summation of the pixel intensities for each angle between 0 and 360°, in 1° increments. The pixel intensities are summed along each radius and then plotted as a function of the angle of acquisition (position of the radial projection on the oval profile), usually between 0 and 180° (FFT data are symmetric so a pixel summation to 360° is unnecessary). The degree of alignment present in the original data image is reflected by the height and overall shape of the peak present in this plot. The position of the peak on the plot reports the principle axis of alignment.
For analysis, grayscale, 8-bit TIFF bright-field microscopic images were cropped to 2048 × 2048 pixels. FFT analysis was conducted using ImageJ software (NIH, http://rsb.info.nih.gov/ij) supported by an oval profile plug-in (created by William O’Connnell). The FFT data was normalized to a baseline value of 0 and plotted in arbitrary units ranging from 0 to 0.1.
Materials testing
After FFT analysis, samples were subjected to materials testing using a Bionix 200 Mechanical Testing Systems instrument equipped with a 50 N load cell (MTS Systems Corp., Eden Prairie, MN). Scaffolds were removed from the target mandrel and laid flat to maximize surface area for sample cutting. Samples were cut into a series of “dog-bone” shaped samples (2.67 mm wide with a gauge length of 7.49 mm). Samples were cut in three orientations: longitudinal (the length of the sample cut parallel to the direction of mandrel rotation), perpendicular (the length of the sample cut perpendicular to the direction of mandrel rotation) and transverse (the length of the sample cut at a 45° angle to the direction of mandrel rotation). Each scaffold was large enough to produce a minimum of four samples in each of the three orientations. Each specimen was assigned a unique serial number to allow for tracking. Specimen thickness was determined with a Mitutoyo IP54 digital micrometer (Mitutoyo American Corp., Aurora, IL). Scaffolds were tested to failure using an extension rate of 10 mm min−1 to evaluate the stress, strain and modulus of elasticity as a function of electrospinning condition (e.g. starting concentration), average fiber diameter and relative fiber alignment (as reported by FFT analysis).
Statistical evaluation
One-way ANOVA was used to screen the morphometric fiber diameter data sets. A Tukey test was used in the post hoc analysis of these data sets. Two-way ANOVA was used to screen for the effects of fiber diameter, testing angle (i.e. longitudinal, perpendicular and transverse) and interactions between these variables. Two-way ANOVA was also used to screen for the effects of fiber orientation, testing angle and interactions between these variables. For this analysis (see Figs. 6 and 7) data were sorted by the angle of testing (i.e. longitudinal, perpendicular and transverse) and then by the FFT alignment value. The alignment values for each individual scaffold were rounded down and the data sets were binned in 0.01 FFT units (Fig. 6(A)–(C)). The binned data sets were then analyzed to examine how the degree of alignment and angle of testing impacted scaffold material properties. A Tukey test was also used in the post hoc analysis of these data sets. For all pairwise comparisons, significance was defined at P<0.05. Actual P values are presented in Tables 1–3. A total N = 12–18 samples were used for each fiber diameter and orientation.
Fig. 6.
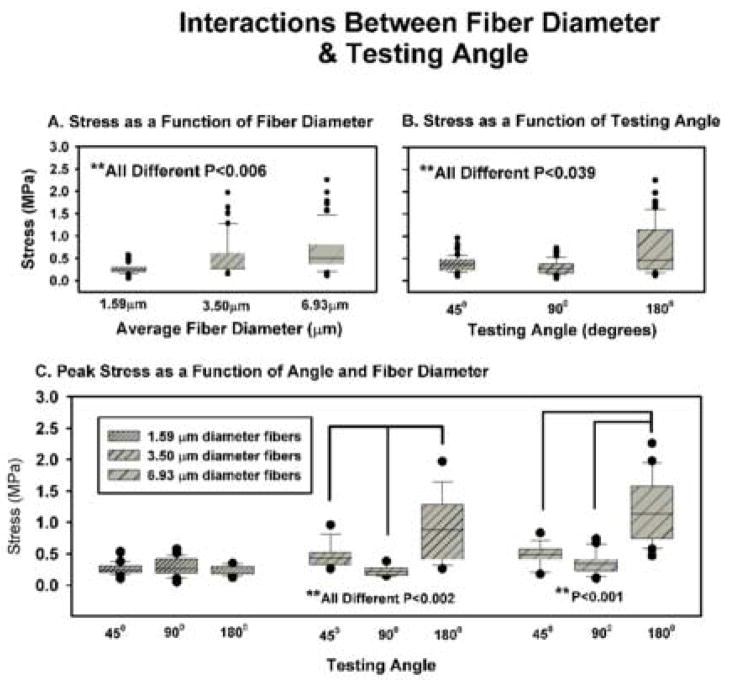
Contributions of fiber diameter (A), testing angle (B) and interactions between these variables in the determination of peak stress (C). Scaffolds composed of different fiber diameters (A, P<0.006) and examined at different testing angles (B, P<0.039) had unique peak stress properties. Specific interactions existed between these variables in scaffolds composed of 2.27 and 4.68 μm diameter fibers (C). All data are ±SE.
Fig. 7.
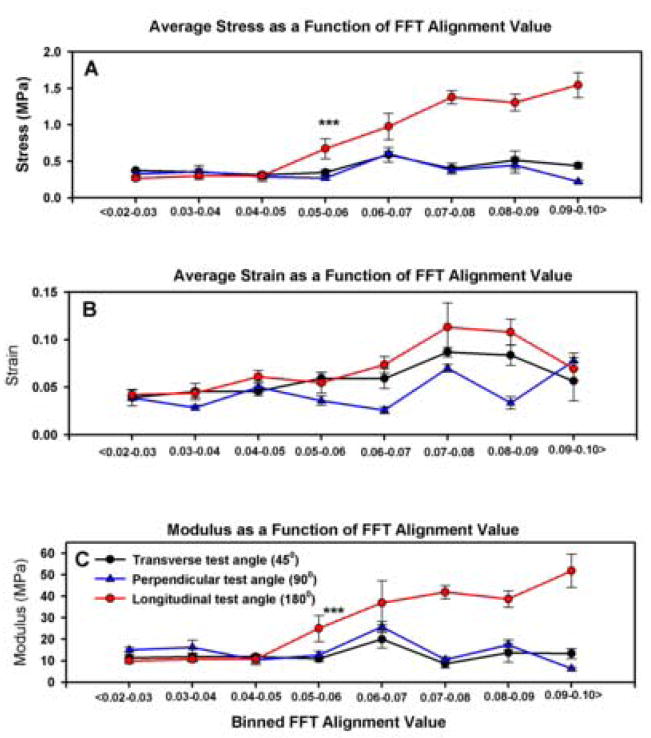
Impact of FFT and testing angle on the peak stress (A), peak strain (B) and modulus of elasticity (C). From the peak stress data we conclude: (i) onset of anisotropy begins at FFT values greater than 0.05 units, (ii) scaffolds tested in the transverse orientation are isotropic with scaffolds tested in the perpendicular orientation and (iii) peak stress of longitudinal samples changes incrementally in 1–2 FFT alignment units. Asterisks in A and B indicate the onset of anisotropic properties within the longitudinal samples and the divergence of these samples from the perpendicular and longitudinal test groups. See Fig. 6 for a complete breakdown of the statistical analysis. All data are ±SE.
Table 1.
Peak stress as a function of FFT alignment value
| Longitudinal FFT | 0.02 | 0.03 | 0.04 | 0.05 | 0.06 | 0.07 | 0.08 | 0.09 | 0.10 |
|---|---|---|---|---|---|---|---|---|---|
| 0.10 | P<0.001 | P<0.001 | P<0.001 | P<0.001 | P<0.001 | P<0.001 | P<0.001 | P<0.001 | NA |
| 0.09 | P<0.001 | P<0.001 | P<0.001 | P<0.001 | No | No | No | NA | |
| 0.08 | P<0.001 | P<0.001 | P<0.001 | P<0.001 | P<0.024 | No | NA | ||
| 0.07 | P<0.001 | P<0.001 | P<0.001 | P<0.001 | No | NA | |||
| 0.06 | P<0.002 | P<0.003 | P<0.002 | No | NA | ||||
| 0.05 | P<0.005 | P<0.006 | P<0.001 | NA | |||||
| 0.04 | No | No | NA | ||||||
| 0.03 | No | NA | |||||||
| 0.02 | NA |
| Perpendicular FFT | 0.09 |
| 0.06 | P<0.049 |
| Transverse FFT | 0.04 |
| 0.06 | P<0.022 |
Asterisk denotes the putative threshold where scaffold anisotropy begins to impact material properties.
Table 3.
Peak modulus of elasticity as a function of FFT alignment value
| Longitudinal FFT | 0.02 | 0.03 | 0.04 | 0.05 | 0.06 | 0.07 | 0.08 | 0.09 | 0.10 |
|---|---|---|---|---|---|---|---|---|---|
| 0.10 | P<0.005 | P<0.005 | P<0.001 | P<0.035 | No | No | No | No | NA |
| 0.09 | No | No | P<0.009 | No | No | No | No | NA | |
| 0.08 | P<0.039 | P<0.018 | P<0.001 | No | No | No | NA | ||
| 0.07 | No | No | No | No | No | NA | |||
| 0.06 | P<0.001 | P<0.001 | P<0.001 | P<0.003 | NA |
| Perpendicular FFT | 0.02 | 0.03 | 0.04 | 0.05 | 0.06 | 0.07 | 0.08 | 0.09 | 0.10 |
| 0.10 | No | No | No | No | P<0.015 | No | No | No | NA |
| 0.09 | No | No | No | No | P<0.023 | No | No | NA |
RESULTS
Fiber characterization
Screening the morphometric data sets indicated that three distinct classes of fibers were generated from the different starting concentrations of gelatin (P<0.001). Representative SEM images are illustrated in Fig. 1. The average cross-sectional fiber diameter of each scaffold increased two-fold with every 30 mg ml−1 increase in starting concentration. Starting concentrations of 120, 150 and 180 mg ml−1 produced average cross-sectional fiber diameters of 1.59, 3.46 and 6.93 μm, respectively.
Fig. 1.
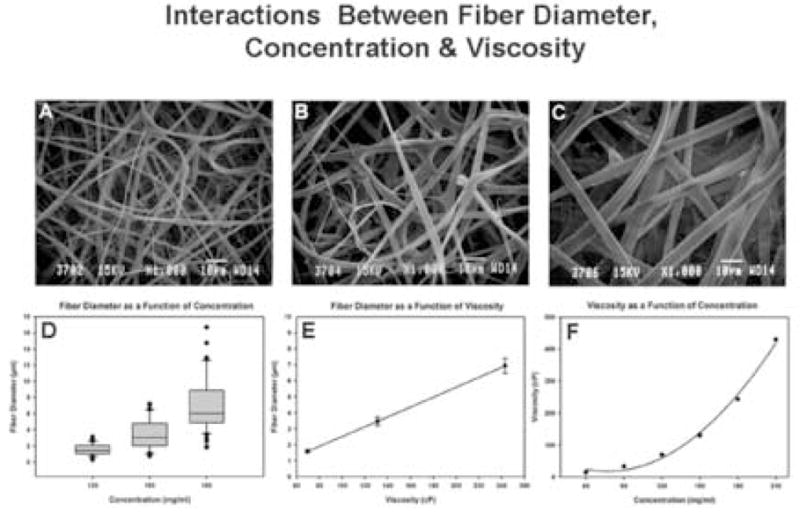
Scanning electron micrographs of scaffolds produced from starting concentrations of 120 (A), 150 (B) and 180 mg ml−1 (C). Interactions between fiber diameter, concentration and viscosity: fiber diameter as a function of concentration (D), fiber diameter as a function of viscosity (E) and viscosity as a function of concentration (F).
The interrelatedness of starting concentration, suspension viscosity and average fiber diameter in our electrospinning system is documented in Fig. 1(D)–(F). Fiber diameter remained constant over all mandrel rotational speeds used in this study.
Material properties: longitudinal orientation
The material properties of the electrospun scaffolds are summarized in Figs. 2–5. The samples were sorted and plotted solely by the angle at which the scaffolds were tested (i.e. longitudinal, perpendicular or transverse). The data sets include material properties of scaffolds composed of all fiber diameters as a function of the FFT alignment value.
Fig. 2.
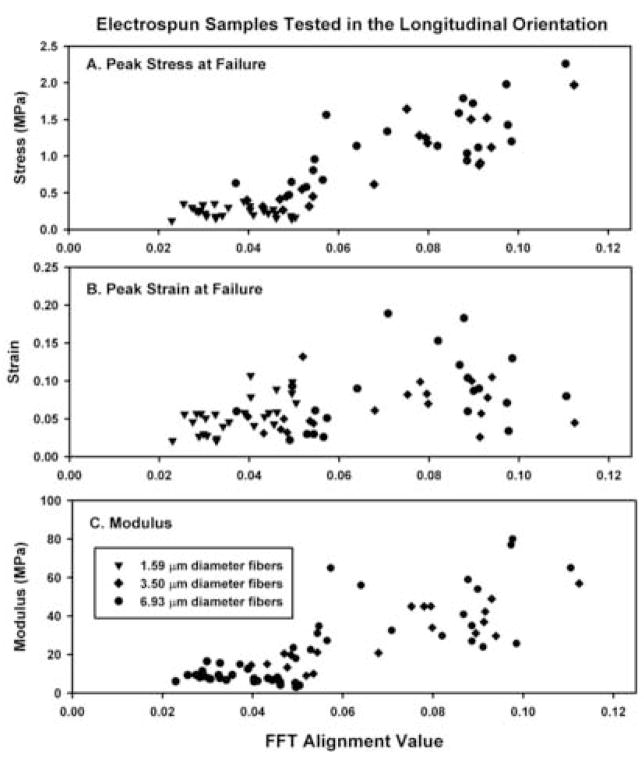
Summary of the peak stress (A), peak strain (B) and modulus of elasticity (C) as a function of the absolute FFT alignment value for each electrospun scaffold tested in the longitudinal orientation. Linear regression analysis for the FFT alignment value and the peak stress (R2=0.760), peak strain (R2=0.194) and modulus of elasticity (R2=0.233). Subdividing and analyzing the data by average fiber diameter did not alter the results (not shown).
Fig. 5.
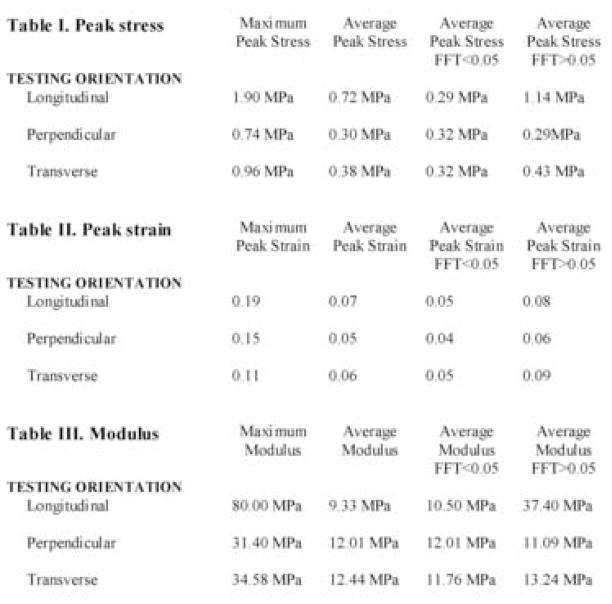
Samples cut and tested in the longitudinal orientation exhibited increased levels of peak stress as a function of increasing FFT alignment value (Fig. 2(A)). In addition, a distinct change in material properties occurred at an FFT alignment value of approximately 0.05 units. Specific peak stress values for different conditions are summarized in Fig. 5 and Table 1. Peak strain was highly variable over the FFT values that we examined and no relationship was evident between the peak strain and the FFT alignment value (Figs. 2(B) and 5, Table 2). Analogous to the peak stress for this test group, the modulus of elasticity increased as a function of the FFT alignment value (Figs. 2(C) and 5, Table 3).
Table 2.
Peak strain as a function of FFT alignment value
| Longitudinal FFT | 0.02 | 0.03 | 0.04 | 0.05 | 0.06 | 0.07 | 0.08 | 0.09 | 0.10 |
|---|---|---|---|---|---|---|---|---|---|
| 0.08 | P<0.001 | P<0.001 | P<0.001 | P<0.001 | No | No | No | No | NA |
| 0.07 | P<0.002 | P<0.001 | P<0.037 | P<0.019 | No | No | No | NA |
| Perpendicular FFT | 0.02 | 0.03 | 0.04 | 005 | 0.06 | 0.07 | 0.08 | 0.09 | 0.10 |
| 0.10 | P<0.002 | P<0.001 | No | P<0.001 | P<0.011 | No | P<0.045 | No | NA |
| Transverse FFT | 0.02 | 0.03 | 0.04 | 0.05 | 0.06 | 0.07 | 0.08 | 0.09 | 0.10 |
| 0.10 | P<0.001 | P<0.001 | P<0.001 | P<0.001 | P<0.001 | P<0.001 | P<0.001 | P<0.001 | NA |
Material properties: perpendicular orientation
Samples cut and tested in the perpendicular orientation exhibited lower and more uniform peak stress values than scaffolds tested in the longitudinal orientation (compare Fig. 2(A) with Figs. 3(A), 5 and Table 1). Peak strain values were similar to those reported for the longitudinal test group (compare Figs. 2(B) and 3(B), 5, Table 2). The modulus of elasticity exhibited a modest decrease as a function of increasing FFT alignment value (Figs. 3(C), 5, Table 3).
Fig. 3.
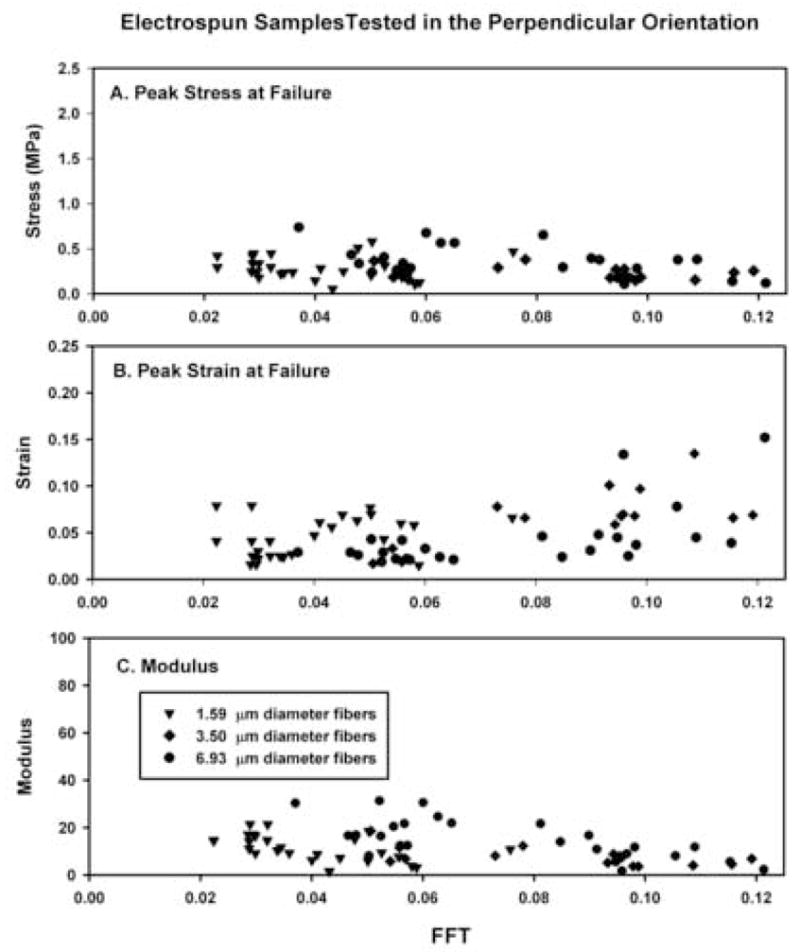
Summary of the peak stress (A), peak strain (B) and modulus of elasticity (C) as a function of the absolute FFT alignment value for each electrospun scaffold tested in the perpendicular orientation. Linear regression analysis for the FFT alignment value and the peak stress (R2=0.048), peak strain (R2=0.288) and modulus of elasticity (R2=0.185). Subdividing and analyzing the data by average fiber diameter did not alter the results (not shown).
Material properties: transverse orientation
Samples cut and tested in the transverse orientation exhibited material properties that were similar to the material properties of the perpendicular samples (compare Figs. 3 and 4). Peak stress values were comparable for all samples tested across all FFT alignment values (Figs. 4(A), 5, Table 3). Peak strain values (Fig. 4(B)) and the modulus of elasticity (Fig. 4(C)) were similar to those of samples tested in the perpendicular orientation (Fig. 5, Table 3).
Fig. 4.
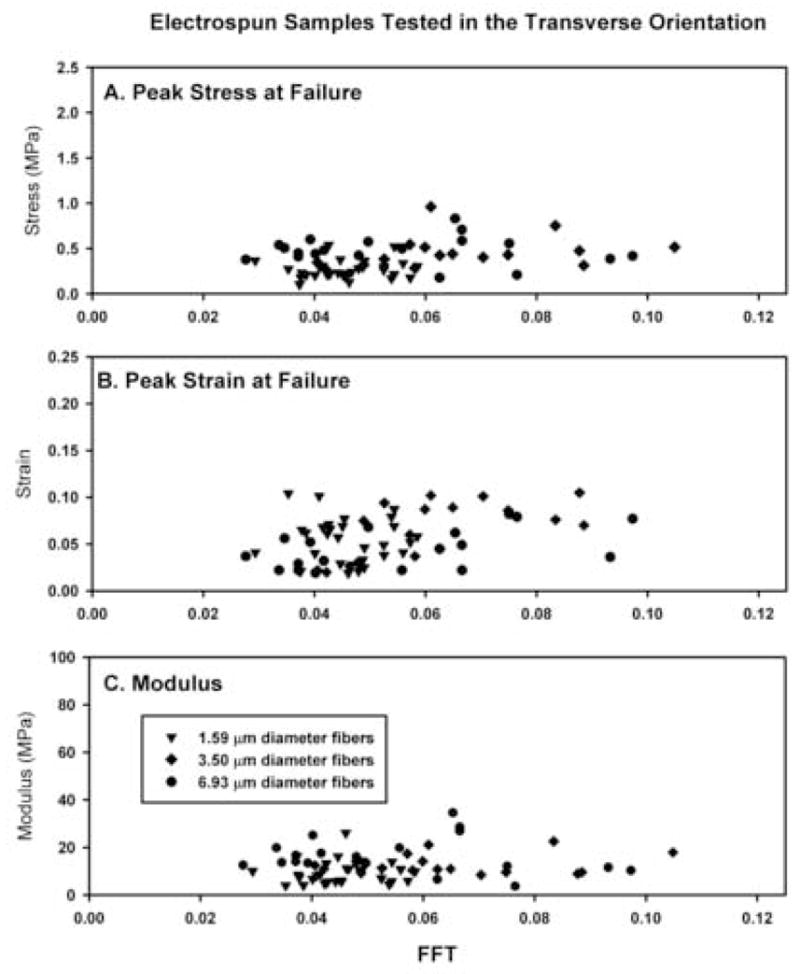
Summary of the peak stress (A), peak strain (B) and modulus of elasticity (C) as a function of the absolute FFT alignment value for each electrospun scaffold tested in the transverse orientation. Linear regression analysis for the FFT alignment value and the peak stress (R2=0.080), peak strain (R2=0. 198) and modulus of elasticity (R2=0.149). Subdividing and analyzing the data by average fiber diameter did not alter the results (not shown)
Intermediate summary
Initial examination of these data sets suggests that the calculated material properties of an electrospun scaffold may be governed by a complex interaction between fiber size (cross-sectional diameter), degree of alignment present (FFT alignment value) and angle of testing (longitudinal, perpendicular or transverse). Next, we systematically examine how each of these variables modulates the peak stress of an electrospun scaffold. We have elected to concentrate on peak stress because it is most closely associated with the evolution of anisotropy in an electrospun scaffold [17].
Effects of fiber diameter and testing angle
Analysis of fiber diameter and angle of testing indicated that peak stress increased as a function of fiber diameter (Fig. 6(A), P<0.006) and varied as a function of testing angle (Fig. 6(B), P<0.039). Peak stress was highest in scaffolds tested in the longitudinal orientation, intermediate in scaffolds tested in the transverse orientation and lowest in scaffolds tested in the perpendicular orientation.
Under specific conditions, the two-way ANOVA detected interactions between fiber diameter and angle of testing (P<0.001). There was no directional bias in scaffolds prepared from the 120 mg ml−1 starting concentrations (average fiber diameter = 1.59 μm). This result is consistent with scaffolds composed of randomly oriented fibers; peak stress (and strain) should be uniform in each direction. Scaffolds prepared from the 150 mg ml−1 starting concentrations (average fiber diameter = 3.46 μm) exhibited three distinct patterns of stress as a function of the testing angle (Fig. 6(C), P<0.002). The scaffolds prepared from the 180 mg ml−1 concentrations (average fiber diameter = 6.93 μm) exhibited higher peak stresses in the longitudinal orientation than in the transverse and perpendicular orientations (Fig. 6(C), P<0.001). Samples from this suspension tested in the perpendicular and transverse orientations could not be distinguished from one another.
Effects of fiber alignment and angle of testing
Analysis of fiber alignment and angle of testing indicated that peak stress was greater in the longitudinal orientation with respect to the perpendicular and transverse orientations (P<0.001), which were indistinguishable from each other (Fig. 7(A)–(C)). An interaction between the binned FFT alignment value and the angle of testing was also detected (P<0.001). These interactions were primarily evident in the longitudinal test samples.
Samples exhibiting FFT alignment values of less than 0.05 units did not exhibit evidence of directional bias in materials testing. The peak stress of the scaffolds at each angle of testing and binned between 0.02 and 0.04 units was identical (Fig. 7(A) and Table 1). These results are consistent with a material composed of random elements. Statistical analysis suggests that anisotropic material properties begin to develop in the longitudinal test group at a binned FFT alignment value of 0.05 units. This value also marks the threshold where the peak stress of the longitudinal test group diverges and can be distinguished from the peak stress present in the perpendicular and transverse test groups (P<0.05). Beyond this threshold, detectable changes in peak stress developed as a function of 1–2 bins in the longitudinal test group (Table 1).
Peak strain values as a function of the binned FFT alignment value are summarized in Fig. 7(B) and Table 2. Examining the effects of angle of testing in terms of the binned FFT alignment value indicated that peak strain was different across each of the three test groups (longitudinal vs. perpendicular vs. transverse; P<0.001). An interaction between the FFT alignment value and the angle of testing was also present in this analysis (P<0.001). In addition, there were specific interactions within each of the test groups as a function of FFT alignment value (Table 2). However, differences across the FFT alignment values for peak strain were less consistent than for the peak stress values for the same test groups.
The modulus of elasticity values as a function of the binned FFT alignment value are summarized in Fig. 7(C) and Table 3. Examining the effects of angle of testing in terms of the binned FFT alignment value indicated that the modulus of elasticity in the longitudinal orientation was different from the perpendicular and transverse orientations (P<0.001), which were statistically indistinguishable from each other. Evidence of the transition from a random to anisotropic material occurred between a binned FFT alignment value of 0.05 and 0.06 units. As with peak strain, the modulus of elasticity of the longitudinal test samples diverged from the perpendicular and transverse test samples at a binned FFT value of 0.05 units (P<0.05). Interactions between the binned FFT alignment value and orientation of testing were also present (P<0.001). Changes in the modulus of elasticity for longitudinal test samples were detectable over 4–5 bins (Table 3). Limited interactions between the FFT value and testing angle were detected in the perpendicular test groups and none were evident in the transverse test groups (Table 3).
DISCUSSION
In this study we examined how fiber diameter, scaffold architecture and angle of testing interact to modulate the material properties of an electrospun scaffold. The results of these experiments provide support for two distinct conclusions. First, within limits, fiber diameter does not appear to play a direct role in governing the material properties of an electrospun scaffold. Second, optical FFT alignment values of greater than 0.05 units must be achieved before any evidence of directional bias in materials testing can be detected. Once this FFT alignment threshold was been surpassed, incremental changes in scaffold anisotropy resulted in incremental changes in peak stress as a function of 1–2 FFT alignment bins when scaffolds are tested in the longitudinal orientation.
Average fiber diameter and the degree to which a population of fibers are aligned along a given axis represent properties that are intrinsic to the three-dimensional architecture and structure of an electrospun scaffold. The angle at which a test load is applied across a scaffold is independent of, and extrinsic to, the structural characteristics of that particular sample. The material properties of an idealized scaffold composed of random elements can be expected to be identical regardless of the angle of testing (orientation of the test load with respect to mandrel rotation). Under these circumstances, the material properties should vary as a function of polymer identity and potentially the diameter, density and tortuosity of the fibers in the scaffold, as well as the degree to which the constituent fibers are entangled (and/or solvent welded) with one another. The calculated material properties of a scaffold should only vary as a function of the angle of testing if a substantial percentage of the fibers are aligned along a unique axis [18]. A consideration of scaffold anisotropy represents a critical design feature in the fabrication of blood vessels, ligaments and other tissues that may be subject to uniaxial mechanical loads.
On first pass, statistical evaluation of our data sets indicated that fiber diameter represents an underlying variable that defines scaffold material properties (Fig. 6(A)). However, we argue that fiber diameter plays a relatively minor and indirect role in determining the material properties observed in our gelatin-based scaffolds. To support this conclusion we cite experiments in which we independently examined how the angle of testing (Fig. 6(B): in the context of fiber diameter, ignoring the contributions of alignment) and fiber alignment (Fig. 7: in the context of the testing angle, ignoring the contributions of fiber diameter) regulate scaffold material properties. Data presented in Fig. 6(B) indicate that peak stress varies as a function of the testing angle. This effect was only present in a specific subset of the data. Evidence of directional bias was absent in scaffolds prepared from the 120 mg ml−1 starting concentrations under all conditions, and was present in scaffolds prepared from the 150 and 180 mg ml−1 starting concentrations under selected conditions (Fig. 6(C)).
Experiments presented in Fig. 7(A) provide an explanation for the previously stated results. In these experiments the peak stress in scaffolds with FFT alignment values of less than 0.05 units, regardless of fiber diameter, did not exhibit any evidence of directional bias in materials testing. This data range includes samples prepared from each of the starting concentrations and contains scaffolds composed of all fiber diameters. Peak stress at failure was similar in each of the three orientations (longitudinal, perpendicular and transverse) tested in this subset of samples. Since these scaffolds exhibit no evidence of directional bias in materials testing they are, by definition, composed of random elements. This result makes it possible to discount the potential contributions of scaffold architecture (e.g. preferential fiber alignment) and provides direct evidence that fiber diameter does not play a crucial role in determining peak stress.
Scaffolds produced from the 120 mg ml−1 solutions are composed of fibers less than 2.0 μm in diameter. Consistent with our previous work [16], we were unable to produce any scaffolds from this treatment group with a FFT alignment value of greater than 0.05 units (Figs. 2–4). The charged electrospinning jet produced by a low viscosity starting solution (e.g. 120 mg ml−1) has a highly erratic path within the air gap, leading to the deposition of fibers along many different orientations when they collide with the target mandrel [11,12]. Thus, it is very difficult to induce alignment in a scaffold composed of small diameter fibers. Extremely high rates of mandrel rotation [9], more sophisticated collecting mandrels and/or the use of AC electrospinning potentials [20] must be used to induce anisotropy in this type of scaffold.
Directional bias in materials testing was evident in scaffolds that had FFT alignment values of 0.05 units and greater. On our arbitrary FFT alignment scale, this value appears to represent a threshold where a sufficient fraction of fibers have become aligned along a common axis to induce directional bias in materials testing. Once this threshold was reached, peak stress underwent incremental increases as function of 1–2 FFT alignment bins in the longitudinal test groups (again regardless of fiber diameter). The data sets that exceed the 0.05 FFT alignment value are populated with scaffolds derived from the 150 and 180 mg ml−1 starting solutions (scaffold composed of fibers >3.0 μm in diameter). In conventional electrospinning systems fiber diameter is primarily determined by polymer concentration, the viscosity of the starting solutions and the degree of chain entanglements that are present at the onset of processing. Within limits, manipulating these parameters to increase the mass of the charged electrospinning jet induces the formation of progressively larger diameter fibers (Fig. 1). In addition, increasing the mass of the charged jet increases its inertia, a condition that tends to dampen the amplitude of the whipping motions typically observed during fiber formation in the electrospinning air gap. This dampening effect makes it possible to induce fiber alignment at a progressively lower mandrel rotational speeds as a function of increasing fiber diameter [17]. We contend that the statistical treatment of the data presented in Fig. 6(A) indirectly documents the evolution of fiber alignment in selected data sets. We conclude from these results that it is the evolution of fiber alignment as a consequence of the fundamental characteristics of the electrospinning process, not fiber diameter, which plays a central role in modulating the material properties of our model scaffolds.
CONCLUSIONS
We were able to detect incremental changes in peak stress as a function of 1–2 FFT alignment bins (Fig. 7(A)), suggesting that data generated from this sampling technique can represent a sensitive measure of fiber alignment. Incremental changes in the FFT alignment value were correlated with incremental changes in peak stress at failure. From our results, it is evident that scaffold anisotropy plays a central role in determining the material properties of a fibrous matrix. However, a determination of how mechanical loads are distributed across the individual fibers of an electrospun matrix has yet to be developed. Conventional materials testing cannot be used establish the extent to which the populations of fibers undergo rearrangement in response to an applied load. At present we are examining this issue by using real-time changes in two-dimensional FFT alignment values in scaffolds subjected to different loading conditions [19].
Acknowledgments
This work supported in part by NIH R01EB003087 (D.G.S.), NIH 5R21EB003407 (G.L.B.) and NanoMatrix, Inc. (D.G.S. and G.L.B.). Scanning electron microscopy was performed at the VCU, Department of Neurobiology and Anatomy Microscopy Facility, supported with funding from NIH-NCRR shared instrumentation grant (1S10RR022495) and, in part, NIH-NINDS Center core grant (5P30NS047463). D.G.S. and G.L.B. have US and International Patents Issued and Pending concerning the electrospinning process.
Footnotes
Publisher's Disclaimer: This is a PDF file of an unedited manuscript that has been accepted for publication. As a service to our customers we are providing this early version of the manuscript. The manuscript will undergo copyediting, typesetting, and review of the resulting proof before it is published in its final citable form. Please note that during the production process errors may be discovered which could affect the content, and all legal disclaimers that apply to the journal pertain.
References
- 1.Simpson DG, Bowlin GL. Tissue engineering scaffolds – can we re-engineer Mother Nature? Expert Reviews of Medical Devices. 2006;3(1):9–15. doi: 10.1586/17434440.3.1.9. [DOI] [PubMed] [Google Scholar]
- 2.Telemeco TA, Ayres CE, Bowlin GL, Wnek G, Boland G, Cohen N, Baumgarten CM, Matthews JA, Simpson DG. regulation of cellular infiltration into tissue engineering scaffolds composed of submicron diameter fibrils produced by electrospinning. Acta Biomater. 2005;1(4):377–385. doi: 10.1016/j.actbio.2005.04.006. [DOI] [PubMed] [Google Scholar]
- 3.Subbiah T, Bhat GS, Tock RW, Parameswaran S, Ramkumar SS. Electrospinning of nanofibers. J Appl Poly Sci. 2005;96(2):557–569. [Google Scholar]
- 4.Matthews JA, Wnek GE, Simpson DG, Bowlin GL. Electrospinning of collagen nanofibers. Biomacromolecules. 2002;3(2):232–238. doi: 10.1021/bm015533u. [DOI] [PubMed] [Google Scholar]
- 5.Wnek GE, Carr ME, Simpson DG, Bowlin GL. Electrospinning of fibrinogen nanofiber structures. Nano Letters. 2003;2:213–216. [Google Scholar]
- 6.Boland ED, Matthews JA, Pawlowski KJ, Simpson DG, Wnek GE, Bowlin GL. Electrospinning collagen and elastin: preliminary vascular tissue engineering. Front Biosci. 2004;1(9):1422–32. doi: 10.2741/1313. [DOI] [PubMed] [Google Scholar]
- 7.Boland ED, Coleman BD, Barnes CP, Simpson DG, Wnek GE, Bowlin GL. Electrospinning polydioxanone for biomedical applications. Acta Biomater. 2005;1:115–123. doi: 10.1016/j.actbio.2004.09.003. [DOI] [PubMed] [Google Scholar]
- 8.Boland ED, Wnek GE, Simpson DG, Pawlowski KJ, Bowlin GL. Tailoring tissue engineering scaffolds using electrostatic processing techniques: a study of poly(glycolic acid) electrospinning. J Macromol Sci. 2001;38 (12):1231–1243. [Google Scholar]
- 9.Yang F, Murugan R, Wang S, Ramakrishna S. Electrospinning of nano/micro scale poly(L-lactic acid) aligned fibers and their potential in neural tissue engineering. Biomaterials. 2005;26(15):2603–10. doi: 10.1016/j.biomaterials.2004.06.051. [DOI] [PubMed] [Google Scholar]
- 10.Sell SA, McClure MJ, Barnes CP, Knapp DC, Simpson DG, Walpoth BH, Bowlin GL. Electrospun polydioxanone-elastin blends: potential for bioresorbable vascular grafts. Biomed Mater. 2006;1:72–80. doi: 10.1088/1748-6041/1/2/004. [DOI] [PubMed] [Google Scholar]
- 11.Doshi J, Reneker DH. Electrospinning process and applications of electrospun fibers. J Electrost. 1995;35:151–160. [Google Scholar]
- 12.Deitzel JM, Kleinmeyer J, Harris D, Beck Tan NC. The effect of processing variables on the morphology of electrospun nanofibers and textiles. Polymer. 2001;42(1):261–72. [Google Scholar]
- 13.Thandavmoorthy S, Gopinath S, Ramkumar S. Self-assembled honeycomb polyurethane nanofibers. J Appl Poly Sci. 2006;101(5):3121–3124. [Google Scholar]
- 14.Keen C, Wnek GE, Baumgarten CM, Newton D, Bowlin GL, Simpson DG. Bioengineered skeletal muscle. In: Wnek GE, Bowlin GL, editors. Encyclopedia of Biomaterials and Biomedical Engineering. New York: Marcel Dekker; 2004. pp. 1639–1651. [Google Scholar]
- 15.Kenawy E, Mansfield K, Bowlin GL, Simpson DG, Wnek GE. Release of Tetracycline hydrochloride from electrospun poly(ethylene-co-vinyl acetate), poly(lactic acid) and a blend. J Control Release. 2002;81:57–64. doi: 10.1016/s0168-3659(02)00041-x. [DOI] [PubMed] [Google Scholar]
- 16.Sanders EH, Kloefkorn R, Bowlin GL, Simpson DG, Wnek GE. Two phase electrospinning from a single electrified jet: microencapsulation of aqueous reservoirs in poly(ethylene-co-vinyl acetate) fibers. Macromolecules. 2003;36(11):3803–3805. [Google Scholar]
- 17.Ayres CE, Bowlin GL, Henderson SC, Taylor L, Schultz J, Alexander JK, Telemeco TA, Simpson DG. Modulation of anisotropy in electrospun tissue engineering scaffolds: analysis of fiber alignment by the fast Fourier transform. Biomaterials. 2006;27(32):5524–5534. doi: 10.1016/j.biomaterials.2006.06.014. [DOI] [PMC free article] [PubMed] [Google Scholar]
- 18.Courtney T, Sacks MS, Stankus J, Guan J, Wagner WR. Design and analysis of tissue engineering scaffolds that mimic soft tissue mechanical anisotropy. Biomaterials. 2006;27(19):3631–3638. doi: 10.1016/j.biomaterials.2006.02.024. [DOI] [PubMed] [Google Scholar]
- 19.Ayres CE, Jha S, Meredith H, Bowman JR, Bowlin GL, Simpson DG. Optical determination of anisotropy in electrospun tissue engineering scaffolds: a user’s guide to the 2d fast Fourier transform approach. doi: 10.1163/156856208784089643. Submitted. [DOI] [PubMed] [Google Scholar]
- 20.Kessick R, Fenn J, Tepper G. The use of AC potentials in electrospraying and electrospinning processes. Polymer. 2004;45(9):2981–2984. [Google Scholar]


