Abstract
Background
The processing of rapidly presented stimuli has been shown to be a precursor for the perception of speech in infants, long before they learn to speak. However, the onset and early development of rapid temporal processing (RTP) skills is not yet well understood. The main goal of this study was to assess the development of RTP skills during the prenatal and early postnatal stages of life.
Methodology
Tone pairs were presented in two difficulties (long and short) and event-related magnetic fields were recorded using MEG. 22 pregnant women (gestational ages between 29 and 38 weeks’) participated in the fetal study and 15 returned for a neonatal follow-up study between 2 and 38 days after delivery or 38 and 44 weeks gestational age (GA).
Results
In the postnatal follow-up study, a trend towards two peaks with increasing chronological and gestational age was observed in the longer tone pair. However, no such trend was evident in neonatal responses to the short tone pairs or in fetal recordings.
Conclusions
Neonates showed a gradual trend to successful processing of the longer tone pair with increasing age. By 22 days of chronological age, the infants processed this tone pair successfully, as indicated by two-peak waveforms. Therefore, the first three weeks of life could be critical for the development of RTP.
Significance
This study is a first approach towards the assessment of early RTP development. The results provide promising indications for future studies, which might lead to an early detection of deficits in speech perception and therefore prevent further language impairments.
Keywords: fetus, prenatal, postnatal, MEG, evoked response, development
1. Introduction
Human newborns can discriminate different syllables within the first days after delivery [1, 2] and recognize their mother’s voice [3–5]. Moreover, the auditory perception of neonates at genetic risk for language disorders, such as dyslexia or specific language impairment (SLI), differs from infants without genetic predetermination. These differences are evident not only for speech sounds such as syllables, but also for non-speech sounds [1]. This suggests that a more basic auditory processing scheme precedes the successful perception of speech. Speech consists of sequential frequencies separated by gaps as short as 10 milliseconds [6]. However, the ability to process consecutive stimuli is limited by the time interval between the stimuli. The preceding stimulus can affect the perception of the subsequent one - a phenomenon called forward masking. If stimuli occur within very short time intervals, the processing of the first stimulus can overlap or mask the occurrence of the subsequent one. Therefore, forward masking can explain incomplete language perception. In adults, stimuli divided by gaps of about 20ms are perceived as successive events, but when presented with a gap of less than 20ms the triggers are perceived as simultaneous [7]. Children, aged 5–10 years are able to process sequential stimuli separated by tens of milliseconds. However, language impaired children require considerably longer gaps between stimuli in order to perceive them properly [8].
Therefore, the processing of rapidly presented (within milliseconds) stimuli is believed to be an important precursor for successful speech perception and language acquisition. Impaired rapid temporal processing (RTP) prevents the accurate processing of brief acoustic transitions crucial for the successful perception of speech. Therefore, adequate language learning is impeded on a very basic level and could contribute to the development of language disorders. Accordingly, RTP skills have been shown to be impaired in individuals at risk for, or suffering from, language disorders such as SLI or dyslexia [e.g. 8–13]. Moreover, RTP is predictive of an infant’s language performance later in life, regardless of an existing family history [14]. In a magnetoencephalographic (MEG) study, Oram Cardy et al. [15] showed differences in brain responses evoked by rapidly presented tones. Subjects with language impairments responded significantly less often to the second tone of a pair than individuals with non-impaired speech performance and vice versa.
An important component in the investigation of speech development is the physiological correlate of the auditory discriminative ability, called mismatch negativity (MMN). This difference wave is obtained by subtracting the response to the standard from the response to the deviant stimulus [16–18]. The MMN is independent of attention and therefore suitable for the assessment of an infant’s ability to discriminate auditory stimuli. Several studies have shown this brain component to be evident in preterm and full-term neonates [19–26]. However, some authors found this change-detection response to be of positive polarity in newborns and young children [27–31]. Therefore, we call this component mismatch response (MMR) instead of MMN. Recent technological advancements enabled the detection of this discriminative response prenatally. Huotilainen et al. [32] and Draganova et al. [33, 34] used a frequent standard tone of 500 Hz, intermixed with a deviant tone of 750 Hz. In both studies, the MMR was detected successfully in fetuses as early as 28 weeks gestational age (GA).
Uwer et al. [35] found the MMR of speech stimuli to differentiate between a group of children with SLI and their control group. But the two groups did not differ significantly in their ability to differentiate tone stimuli. Ors et al. [36] showed differences in P3 latencies to tones as well as speech stimuli between children with SLI and their control group. Bishop & McArthur [37] found that the waveforms of auditory event-related potentials (ERPs) produced in response to tone stimuli showed delays in SLI subjects that were not detected in a frequency discrimination (FD) task. Also, group differences found in younger subjects were no longer evident in the same subjects at a later age. The authors reasoned that behavioral FD thresholds might be more sensitive to maturational processes than ERP response patterns. More recently, Benasich et al. [8] conducted an ERP study on six-month-old infants. Electrocortical responses to rapidly presented tone pairs as well as FD were used to investigate differences between infants at risk for language disorders and a control group. Rapidly presented tone pairs were used as non-speech stimuli with two levels of difficulty: a) the sounds were separated by a 300 ms gap (long), b) the sounds were separated by a 70 ms gap (short). Both conditions included a standard and a deviant tone (defined by frequency) in order to record the MMR. The ERPs between the groups were clearly different in the more difficult short version. The babies with no known risk for language disorders showed both faster ERP responses (shorter latencies) and higher amplitudes in their MMR. However, statistically significant predictions for language performance at two years of age were found only in the ERP latencies, not in the MMR latencies. These results seem to indicate that ERPs generated in response to rapidly presented stimuli are more useful for predicting later language outcome than FD.
Despite increasing evidence to support the importance of non-speech precursors for language acquisition even in modalities other than auditory [38, 39], some controversy remains in the literature. A number of studies did not find a general deficit in the processing of rapidly presented tones to be crucial in the development of language disorders [40–42]. However, methodological issues such as age of the subjects and selection criteria for the impaired experimental group make these results somewhat difficult to compare with the aforementioned studies [43, 44].
The neural basis of maturation of RTP processing is still not entirely understood. Questions regarding the development of RTP, such as the minimum gap length between the two tones in a tone pair for certain maturational stages, and the onset of RTP impairments in at-risk populations, have not yet been addressed. Some neuropathological studies found malformations in the brains of dyslexics that are believed to originate in the fetal stages of life [45–47]. This suggests that the underlying deficits leading to disordered language acquisition might develop during cell migration in the prenatal period. Whether such early neuroanatomical malformations lead to RTP deficits is still subject to speculation. A better understanding of the early maturation of RTP skills in low-risk fetuses and infants could be a first step towards a better insight into the roots of language impairments. Until now, no study has addressed the development of RTP skills and its neurophysiological correlates in the prenatal and early postnatal stages below 6 months of age.
The main goal of this study was to apply a tone pair protocol to neonates and fetuses in order to determine their processing capabilities during the pre- and early postnatal development. The deviant tone pair was presented for the sole purpose of avoiding response decrement due to habituation. MMR was not part of this investigation and was therefore not computed. Data collection started in the prenatal stages as early as 29 weeks’ GA, and continued into the first six weeks of life. Evoked responses to tone pairs with two different levels of difficulty were recorded with non-invasive fetal MEG.
2. Experimental Procedure
2.1 Subjects
The subjects were recruited in their last trimester of pregnancy in order to evaluate the development of RTP beginning in the prenatal stage of life. Twenty-two mothers with no known risks or complications participated at gestational ages between 29 and 38 weeks. All babies were delivered without complications between 36 and 40 weeks GA. Fifteen mothers participated in the postnatal follow-up study. At the time of recording, the infants were aged between two and 38 days and between 38 and 44 weeks GA. The study was approved by the local Institutional Review Board, and each mother or their legal representative signed an informed consent form.
2.2 Stimulation
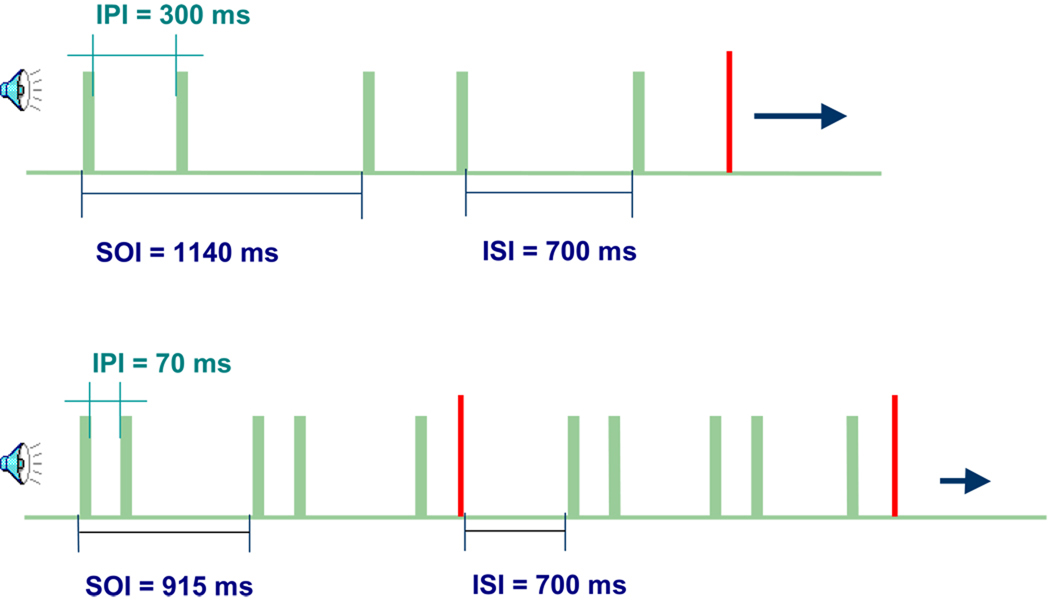
Two separate recordings were performed on each subject, including short or long time gaps between the two tones of a tone pair. The duration of all tones was 70 ms. The gap between the two tones of a pair, the intra-pair interval (IPI), was 300 ms in the long and 70 ms in the short IPI condition (Figure 1). The stimulus-onset interval, from the onset of the first stimulus in a tone pair to the onset of the first stimulus in the next tone pair, was 915 ms in the short and 1140 ms in the long tone pair. The recording time for the short IPI study was 11 minutes, resulting in about 721 stimulus presentations; whereas the total duration of the long IPI condition was 14 minutes, in which 735 tone pairs were presented. The standard and deviant tone pairs were presented with a probability of 85% and 15%, respectively. The standard tone pair consisted of two 500 Hz tones, whereas the deviant tone pair had the same 500 Hz tone followed by a second tone with a frequency of 750 Hz. The stimulus presentation was based on studies conducted by other groups that reported the processing of tone pairs in older infants [8]. The long and the short IPI conditions were presented separately, but applied consecutively in random order.
Figure 1. Stimulus presentation in the long and short IPI condition.
The deviant tone pair was presented in 15 % of the stimuli and is indicated by the red bar in the second tone of the pair.
SOI = Stimulus-onset Interval; ISI = Inter-stimulus Interval; IPI = Intra-pair Interval
Stimulus presentation was controlled by software called STIMPRO (UAMS, Little Rock, AR). The speaker generating the sound was located outside of the magnetically shielded room (Vakuumschmelze, Germany) in which the study was conducted. The sound intensity for the neonatal study was 80 dB. Taking into account the sound attenuation of the maternal abdomen [4], the intensity for the prenatal study was accordingly adjusted to 120dB in order to ensure that a similar audibility reaches the fetus.
2.3 Data acquisition and recording
The evoked responses were recorded with a MEG system called SARA (SQUID Array for Reproductive Assessment), that consists of a 151-channel sensor array [48, 49]. It is designed specifically for the recording of prenatal data. The sensor array is shaped to fit the gravid abdomen and covers it from the pubic symphysis to the costal arch.
In the prenatal studies, the mother leaned forward into the sensor array from a sitting position. Prior to the recording, an ultrasound was performed in order to determine the fetal position, weight, size and level of activity. The mother was then guided to the magnetically shielded room and seated on the SARA system. The sound was transmitted through a plastic tube whose distal end consisted of an inflated plastic bag [33] that was placed on the maternal abdomen over the fetal head. A special marking system consisting of four localization coils [33] recorded the position of the mother and her fetus in relation to the MEG sensors, as well as the location of the fetal head. Three coils were attached to an elastic belt fitted around the maternal waist in order to indicate her mid-back, right and left side. A fourth coil was then placed over the fetal head as indicated by ultrasound. In order to determine any major fetal head-or-body movements that may have occurred during the recording, a second ultrasound was conducted immediately after completion of the study.
For the neonatal recordings, the maternal seat was replaced by a cradle attachment that enables the infant to lie in a supine position with the head resting on the lower center of the sensor array. The “sound bag” was attached to the ceiling, approximately 50 cm above the baby’s head. The infant’s mother or father was seated next to the cradle inside the shielded room and the recording session was monitored by a camera. This allowed the investigator to observe and note down the neonate’s state, movements and parental intervention in a qualitative fashion. The recording session was discontinued when the babies started to cry or if extensive movements occurred.
In both studies participants were instructed to sit as still as possible. In the neonatal recording, the mother or father was told to intervene only if the child became agitated. For the prenatal study the mother was told to communicate any discomforts immediately.
2.4 Data analysis
The magnetic field signals were recorded with a sampling rate of 312.5 Hz in continuous mode. In the first step, the neonatal or the maternal and fetal heart signals were removed using orthogonal projection method [50, 51]. Then, the dataset was split into two separate trial categories (deviants and standards) based on the type of stimulus. The number of stimuli used for averaging affects the noise level of the average response and therefore influences the probability of a peak to reach statistical significance. Since one of the objectives in this study was the comparison of peak number between deviant and standard tone pairs, the number of deviant and standard tone pairs was equalized: Only responses to the standard tone pair preceding the deviant (pre-deviant) were used for data analysis. Each response segment had a window length of 200 ms pre- and 1 s post-stimulus interval in the long IPI condition and 100 ms pre- and 800 ms post-stimulus interval in the short IPI condition. Automatic threshold detection was applied in order to reject artifact-contaminated trials with MEG single-channel amplitude larger than 2 pT. Then, the deviant and standard trials were averaged separately.
To evaluate the data for the occurrence of an evoked brain response, we used a two-step procedure. The first step consisted of a simple statistical test, in which trigger markers were placed at random times in the continuous recording, and the noise distribution was determined from the post-stimulus averages with the random trigger points. The activity peak evoked by the true stimulus was compared to this noise estimate. If the difference was significant on the second percentile, the dataset containing this peak entered the next step for visual analysis. The second step was based on visual analysis of the waveforms. Significant peaks were defined as evoked responses: a) If the channels showing evident peaks in the post-stimulus area were in the location of the fetal/neonatal head and, b) If the peak occurred later than 100 ms after onset of the first stimulus in the pair. This latency criterion was defined based on the findings in our previous studies on auditory evoked responses [48, 52, 53], c) Furthermore, two peaks were determined as dual responses only, if they were of the same polarity. Thus either both peaks had to positive or both peaks had to be negative. d) Both peaks had to be significant on the second percentile as of step 1. This two-step evaluation procedure was used to determine separately the responses to each combination of IPI condition (long and short) with stimulus type (pre-deviant standard and deviant). The neonatal data were analyzed first, due to the lower noise level and fewer artifacts. Having a first impression of the response patterns in neonates facilitated the analysis of the fetal datasets. All datasets were analyzed by the same person.
2.5 Statistical Analysis
For each combination of IPI condition and stimulus type, the neonate tone-pair response patterns (zero, one, or two responses) were plotted as a function of chronological age in days after birth as well as GA in weeks. They were characterized for trend versus age using Spearman’s coefficient of rank correlation. Plots included nonparametric “smoothed” estimates of response-number trend with age using Loess Regression [54] with smoothing parameter equal to 0.80. Response patterns in fetal data were likewise characterized via rank correlation for trends with gestational age. Under each IPI-stimulus combination, the neonates and fetuses were compared for response-pattern differences using an ordered-categorical-data version of the Wilcoxon rank-sum (WRS) test [55]. The comparison between responses to deviant and standard stimuli was evaluated for each IPI condition using McNemar test of symmetry for paired data. The same test was used to assess differences in response patterns to long versus short IPI. Exact P values for the McNemar test were calculated using the Binomial distribution. All analyses were conducted using SAS version 9.1 (The SAS Institute, Cary, NC). Results were considered statistically significant if P<0.05, and marginally significant if 0.05<P<0.10.
3. Results
A total of 15 neonatal measurements were conducted from 15 newborns between two and 38 days chronological age or 38 and 44 weeks GA. All of the babies completed both, the short and long paradigm. The number of trials recorded can be found in tables 1a and 1b. In the prenatal study, recordings were performed on 22 fetuses at gestational ages between 29 and 38 weeks. In two fetal recording sessions, only one of the two paradigms (long or short) was conducted due to maternal discomfort. These incomplete recordings were excluded from data analysis, leaving 20 datasets for further processing.
Table 1.
| a: Neonate responses to deviant stimulus (long and short), including number of trials, gestational age (GA) (in weeks), chronological age (in days), number of responses, amplitudes (in fT) and latencies (in ms). | ||||||||||
|---|---|---|---|---|---|---|---|---|---|---|
| Stim_type | ID | Trials | long/short | GA | age_days | responses | ampl1 | ampl2 | latency1 | latency2 |
| Deviant | TP01 | 8 | Long | 42 | 22 | 1 | −16.0 | 204.8 | ||
| Deviant | TP01 | 10 | Short | 42 | 22 | 1 | 10.6 | 409.6 | ||
| Deviant | TP02 | 14 | Long | 41 | 10 | 1 | −43.4 | 444.8 | ||
| Deviant | TP02 | 11 | Short | 41 | 10 | 1 | 17.5 | 448.0 | ||
| Deviant | TP03 | 8 | Long | 41 | 21 | 1 | −72.7 | 486.4 | ||
| Deviant | TP03 | 6 | Short | 41 | 21 | 1 | −27.0 | 326.4 | ||
| Deviant | TP06 | 14 | Long | 44 | 37 | 2 | 37.8 | 59.9 | 268.8 | 633.6 |
| Deviant | TP06 | 11 | Short | 44 | 37 | 1 | 50.1 | 316.8 | ||
| Deviant | TP07 | 14 | Long | 43 | 25 | 2 | 43.0 | 79.9 | 102.4 | 646.4 |
| Deviant | TP07 | 11 | Short | 43 | 25 | 1 | −52.3 | 176.0 | ||
| Deviant | TP09 | 14 | Long | 42 | 29 | 2 | 15.9 | 23.6 | 163.2 | 643.2 |
| Deviant | TP09 | 11 | Short | 42 | 29 | 1 | 18.4 | 390.4 | ||
| Deviant | TP10 | 14 | long | 44 | 38 | 2 | 41.5 | 40.5 | 268.8 | 656.0 |
| Deviant | TP10 | 11 | short | 44 | 38 | 1 | −36.1 | 26.2 | 201.6 | 441.6 |
| Deviant | TP13 | 14 | long | 43 | 21 | 2 | −16.9 | −14.4 | 166.4 | 704.0 |
| Deviant | TP13 | 11 | short | 43 | 21 | 1 | −44.2 | 432.0 | ||
| Deviant | TP14 | 14 | long | 42 | 19 | 2 | −18.3 | −18.1 | 137.6 | 726.4 |
| Deviant | TP14 | 11 | short | 42 | 19 | 1 | −36.9 | 668.8 | ||
| Deviant | pat3053 | 14 | long | 41 | 12 | 2 | 44.5 | 27.6 | 220.8 | 521.6 |
| Deviant | pat3053 | 11 | short | 41 | 12 | 1 | −19.3 | 502.4 | ||
| Deviant | pat3500 | 14 | long | 39 | 2 | 1 | 16.1 | −10.4 | 380.8 | 912.0 |
| Deviant | pat3500 | 10 | short | 39 | 2 | 1 | −30.7 | 291.2 | ||
| Deviant | pat3504 | 14 | long | 38 | 22 | 2 | −19.2 | −30.5 | 208.0 | 646.4 |
| Deviant | pat3504 | 11 | short | 38 | 22 | 1 | −20.9 | 646.4 | ||
| Deviant | pat3505 | 14 | long | 39 | 13 | 1 | 18.6 | 489.6 | ||
| Deviant | pat3505 | 10 | short | 39 | 13 | 1 | 18.9 | 489.6 | ||
| Deviant | pat3506 | 11 | short | 40 | 6 | 2 | 18.7 | 23.6 | 342.4 | 451.2 |
| Deviant | pat3506 | 14 | long | 40 | 6 | 1 | −21.7 | 806.4 | ||
| Deviant | pat3510 | 14 | long | 39 | 14 | 1 | −21.3 | 412.8 | ||
| Deviant | pat3510 | 11 | short | 39 | 14 | 1 | −20.9 | 211.2 | ||
| b: Neonate responses to standard stimulus (long and short), including number of trials, gestational age (GA) (in weeks), chronological age (in days), number of responses, amplitudes (in fT) and latencies (in ms). | ||||||||||
|---|---|---|---|---|---|---|---|---|---|---|
| Stim_type | ID | Trials | long/short | GA | age_days | responses | ampl1 | ampl2 | latency1 | latency2 |
| Standard | TP01 | 8 | long | 42 | 22 | 1 | 13.2 | 140.8 | ||
| Standard | TP01 | 10 | short | 42 | 22 | 1 | −12.0 | 428.8 | ||
| Standard | TP02 | 14 | long | 41 | 10 | 1 | −24.4 | 480.0 | ||
| Standard | TP02 | 11 | short | 41 | 10 | 1 | 14.0 | 310.4 | ||
| Standard | TP03 | 8 | long | 41 | 21 | 2 | 59.2 | 37.4 | 195.2 | 601.6 |
| Standard | TP03 | 6 | short | 41 | 21 | 1 | 36.6 | 352.0 | ||
| Standard | TP06 | 14 | long | 44 | 37 | 2 | 44.3 | 42.9 | 252.8 | 905.6 |
| Standard | TP06 | 11 | short | 44 | 37 | 1 | 48.1 | 451.2 | ||
| Standard | TP07 | 14 | long | 43 | 25 | 2 | 27.1 | 26.6 | 211.2 | 518.4 |
| Standard | TP07 | 11 | short | 43 | 25 | 1 | 19.3 | −27.0 | 102.4 | 640.0 |
| Standard | TP09 | 14 | long | 42 | 29 | 2 | −28.5 | −27.6 | 185.6 | 358.4 |
| Standard | TP09 | 11 | short | 42 | 29 | NER* | ||||
| Standard | TP10 | 14 | long | 44 | 38 | 2 | 20.9 | 24.5 | 288.0 | 665.6 |
| Standard | TP10 | 11 | short | 44 | 38 | 1 | 33.4 | 329.6 | ||
| Standard | TP13 | 14 | long | 43 | 21 | 2 | 15.3 | 14.4 | 153.6 | 544.0 |
| Standard | TP13 | 11 | short | 43 | 21 | 2 | 32.5 | 20.3 | 204.8 | 348.8 |
| Standard | TP14 | 11 | short | 42 | 19 | 1 | −23.3 | 416.0 | ||
| Standard | TP14 | 14 | long | 42 | 19 | NER* | ||||
| Standard | pat3053 | 14 | long | 41 | 12 | NER* | ||||
| Standard | pat3053 | 11 | short | 41 | 12 | NER* | ||||
| Standard | pat3500 | 14 | long | 39 | 2 | 1 | 25.6 | 262.4 | ||
| Standard | pat3500 | 10 | short | 39 | 2 | NER* | ||||
| Standard | pat3504 | 11 | short | 38 | 22 | 1 | 30.0 | 214.4 | ||
| Standard | pat3504 | 14 | long | 38 | 22 | NER* | ||||
| Standard | pat3505 | 14 | long | 39 | 13 | NER* | ||||
| Standard | pat3505 | 10 | short | 39 | 13 | NER* | ||||
| Standard | pat3506 | 14 | long | 40 | 6 | 2 | −30.0 | −25.9 | 272.0 | 544.0 |
| Standard | pat3506 | 11 | short | 40 | 6 | 2 | −21.7 | −16.0 | 137.6 | 624.0 |
| Standard | pat3510 | 11 | short | 39 | 14 | 2 | −13.1 | −24.2 | 153.6 | 652.8 |
| Standard | pat3510 | 14 | long | 39 | 14 | 1 | 13.7 | 284.8 | ||
NER = no evident response
3.1 Neonatal Recordings
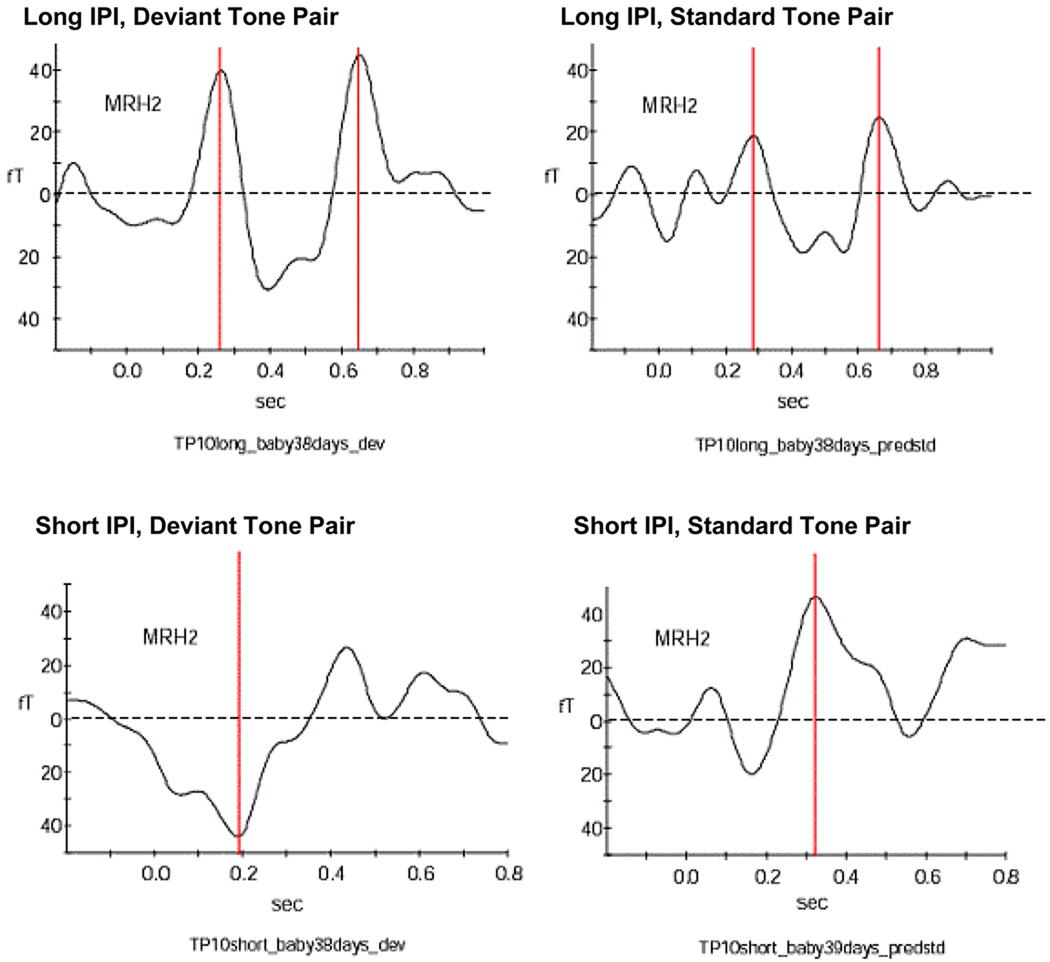
Data from each recording session were extracted for the different variations of this paradigm: Long IPI condition with deviant tone, long IPI condition with standard tone, short IPI condition with deviant tone, and short IPI condition with standard tone. Therefore, the results are reported in four different sections, each representing the findings for the different stimulus types. A summary of significant differences in the responses to each stimulus variation is described in the last section. Figure 2 shows an example for neonatal responses to the different stimulus variations and the neonatal response patterns are shown in Tables 1a and 1b.
Figure 2. Example for responses from a 38 day old neonate.
This neonate responded with two peaks to both long IPI conditions and with one peak to both short IPI conditions. The peaks are indicated by the red bar. The dotted line marks the zero level of the amplitude.
MRH2 indicates which one of the 151 sensor arrays recorded the signal shown above.
3.1.1 Long IPI Condition, Deviant Tone
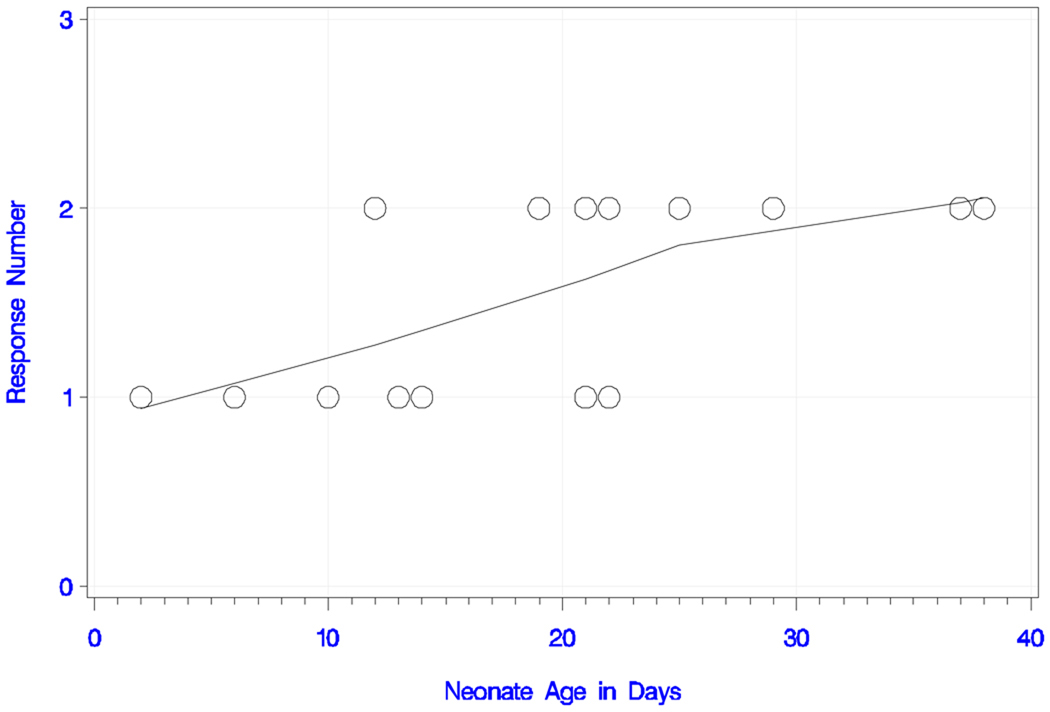
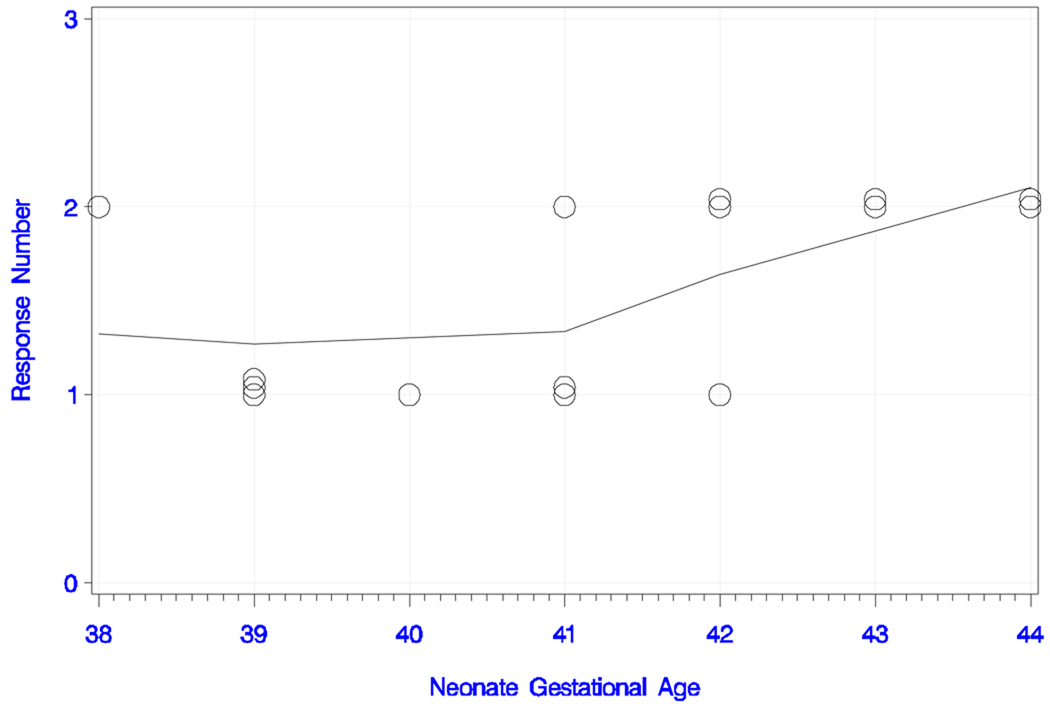
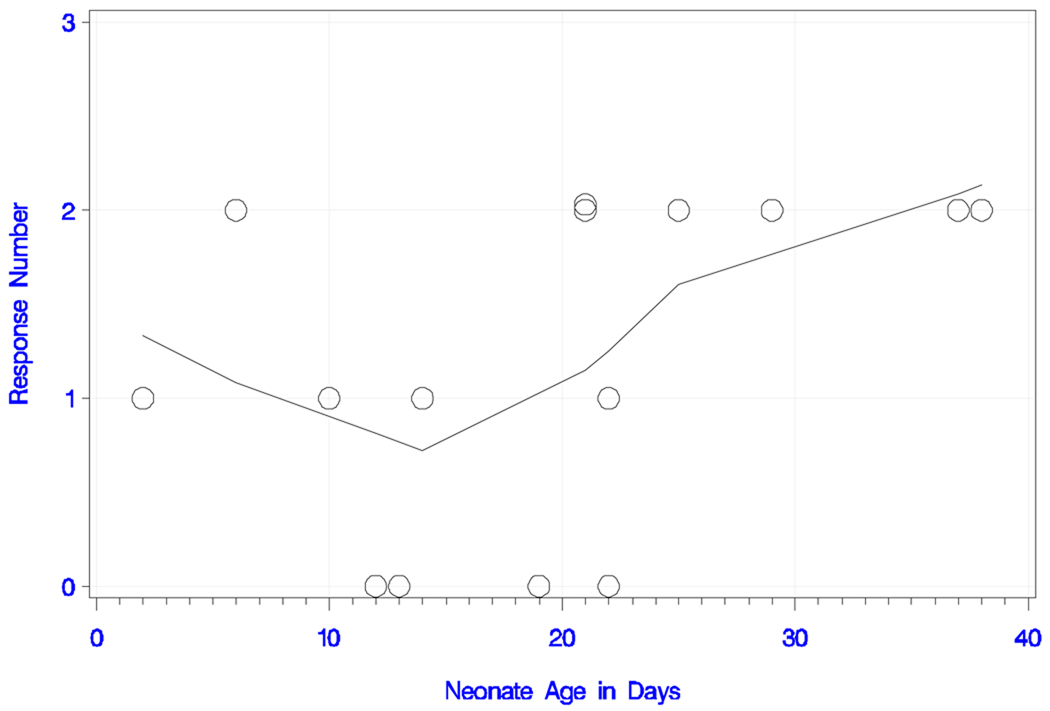
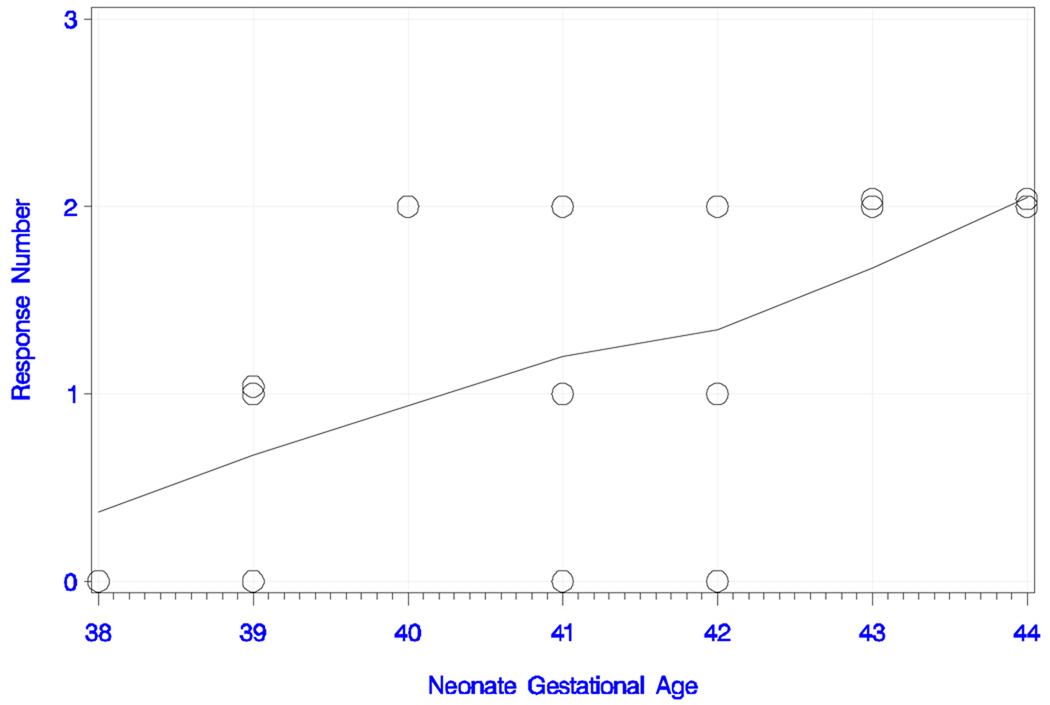
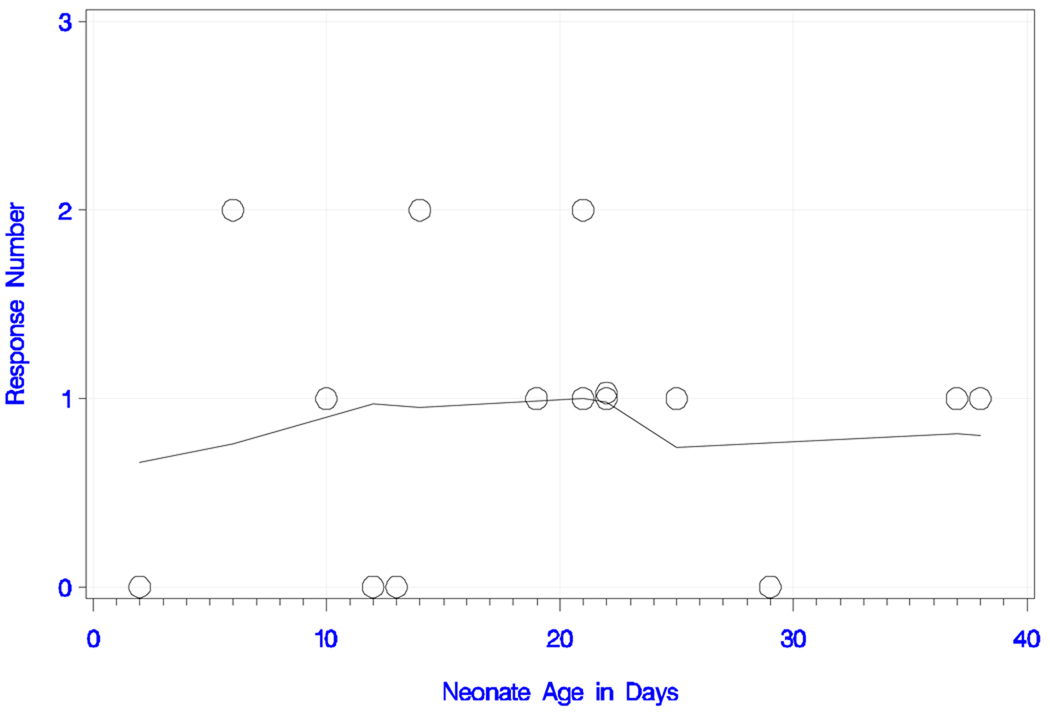
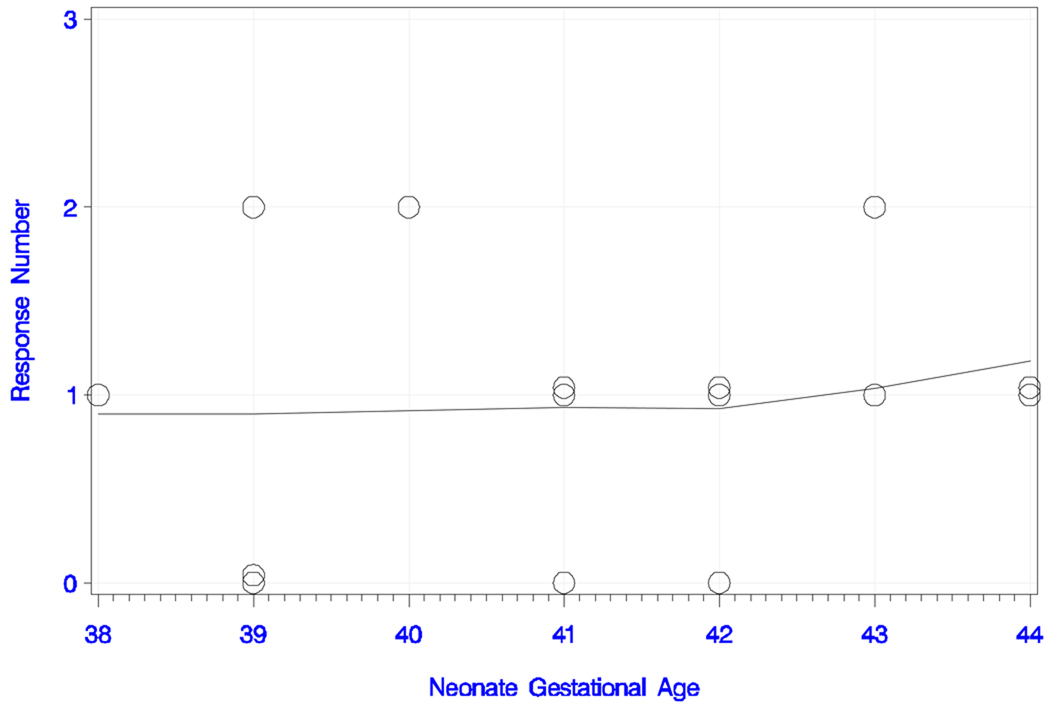
All neonates responded to the long IPI and the deviant tone pair with either one or two peaks. The plots of response number (i.e., peak number) and smoothed trend estimate with neonate age (in days) and GA are shown in Figures 3a and 3b, respectively. The overall trend for peak number with increasing age was statistically significant (rank correlation = +0.620; P = 0.014). All neonates older than 22 days responded with two peaks, whereas the ones younger than 12 days had only one detectable peak. This trend was also confirmed for peak number with increasing GA (rank correlation = +0.564; P = 0.029). In summary, seven babies (47%) responded with one peak and eight (53%) with two peaks. Table 1a shows the latencies, amplitudes, GA and chronological age of the newborns.
Figure 3.
Figure 3a) Neonatal responses to the long IPI condition with the deviant tone pair.
Neonatal responses (zero, one or two) to the long IPI condition with the deviant tone pair as a function of chronological age (in days), with smoothed trend estimate.
Figure 3b) Neonatal responses to the long IPI condition with the deviant tone pair.
Neonatal responses (zero, one or two) to the long IPI condition with the deviant tone pair as a function of gestational age (in weeks), with smoothed trend estimate.
Figure 3c) Neonatal responses to the long IPI condition with the standard tone pair.
Neonatal responses (zero, one or two) to the long IPI condition with the standard tone pair as a function of chronological age (in days), with smoothed trend estimate.
Figure 3d) Neonatal responses to the long IPI condition with the standard tone pair.
Neonatal responses (zero, one or two) to the long IPI condition with the standard tone pair as a function of gestational age (in weeks), with smoothed trend estimate.
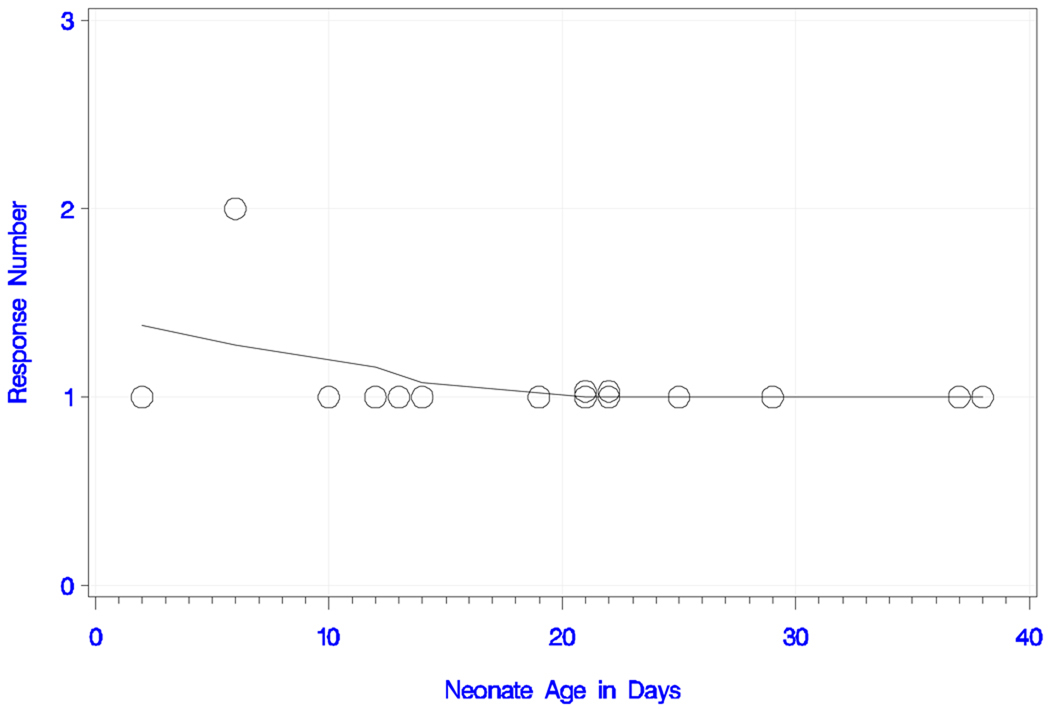
Figure 3e) Neonatal responses to the short IPI condition with the deviant tone pair.
Neonatal responses (zero, one or two) to the short IPI condition with the deviant tone pair as a function of chronological age (in days), with smoothed trend estimate.
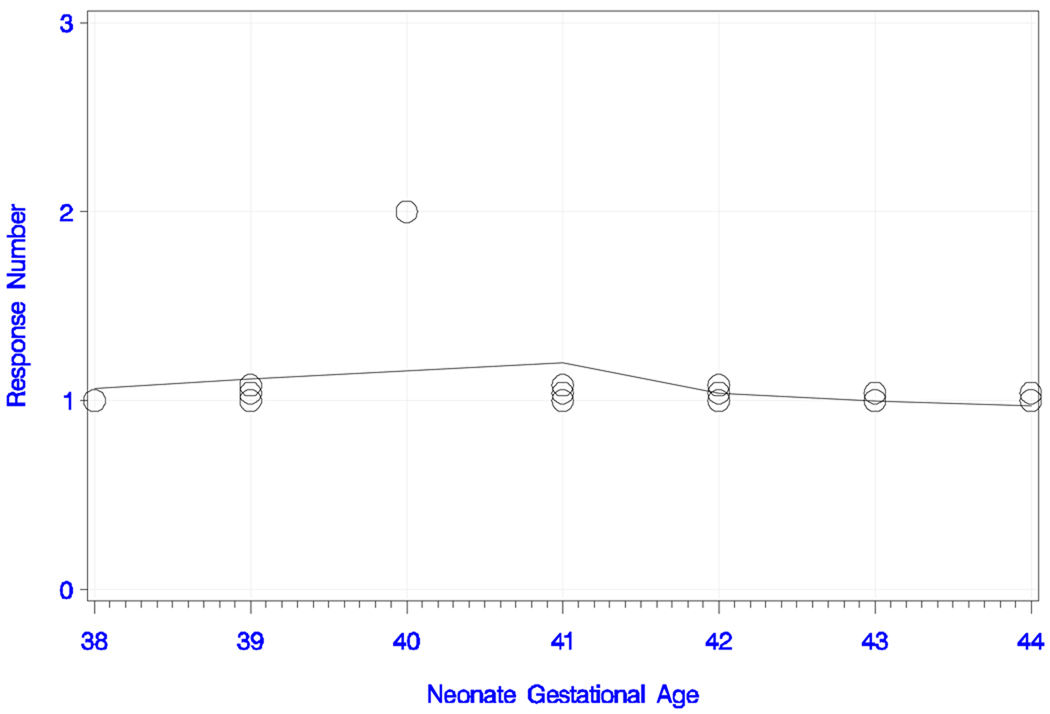
Figure 3f) Neonatal responses to the short IPI condition with the deviant tone pair.
Neonatal responses (zero, one or two) to the short IPI condition with the deviant tone pair as a function of gestational age (in weeks), with smoothed trend estimate.
Figure 3g) Neonatal responses to the short IPI condition with the standard tone pair.
Neonatal responses (zero, one or two) to the short IPI condition with the standard tone pair as a function of chronological age (in days), with smoothed trend estimate.
Figure 3h) Neonatal responses to the short IPI condition with the standard tone pair.
Neonatal responses (zero, one or two) to the short IPI condition with the standard tone pair as a function of gestational age (in weeks), with smoothed trend estimate.
3.1.2 Long IPI Condition, Standard Tone
In the long IPI condition with the standard tone pair, seven newborns (47%) responded with two peaks, four (27%) responded with one peak, and four (27%) did not show an evident response to the stimulus. Figure 3c and 3d show the number of responses and smoothed trend estimates for chronological age and GA. The overall trend in peak number with chronological age was positive, but only marginally significant (rank correlation = +0.445; P = 0.097). This finding was also supported by the trend for peak number with increasing GA (rank correlation = +0.599; P = 0.018). Six of the seven newborns that exhibited responses with two peaks were between 21 and 38 days old; the seventh was 6 days of age. The responders with one peak were between two and 22 days old. Latencies, amplitudes and the infant’s age are shown in table 1b.
3.1.3 Short IPI Condition, Deviant Tone
In the short IPI condition, all newborns responded with at least one peak to the deviant tone pair. One participant, six days old, showed a response with two peaks. The other 14 infants (93%) responded with one peak. Table 1a contains the latencies, amplitudes and age of the infants. Figures 3e 3f show the numbers of peaks and smoothed trend estimate; the trend with age was statistically non-significant (s = −0.372; P = 0.17 and s = −0.188; P = 0.50), and negative only because of the six-day-old baby that responded with two peaks.
3.1.4 Short IPI condition, Standard Tone
Three newborns (20%) responded with two peaks, eight (53%) responded with one peak, and four (27%) showed no evident response to the short IPI condition with standard tone. The overall trend with age was almost non-existent in both chronological age and GA (s = +0.050; P = 0.86 and s = +0.138; P = 0.62), as shown by the smoothed trend estimate in Figures 3g and 3h. The neonatal latencies, amplitudes, GA and chronological ages at the time of recording are displayed in Table 1b.
3.1.5 Summary of neonate recordings
The deviant tone pair elicited at least one peak in all fifteen neonates, while the standard tone pair elicited no peaks in four newborns, but the differences were not statistically significant (McNemar Exact P values = 0.13 for both IPI conditions). Under the long IPI condition, 8 infants (53%) responded with 2 peaks to the deviant tone pair, while 7 babies (47%) responded with 2 peaks to the standard tone pair (McNemar Exact P = 1.00). Under the short IPI condition, 3 newborns (20%) produced two responses to the standard tone pair, and 1 (7%) produced two responses to the deviant tone pair (McNemar Exact P = 0.50). Comparing the responses to the deviant tone pair, eight infants (53%) responded with two peaks to the tone pair with the long IPI, whereas in the short-IPI tone pair only one (7%) responded with two peaks. This difference was statistically significant (McNemar P = 0.039). For the responses to the standard tone pair we obtained that six neonates (40%) responded with more peaks to the long IPI condition than the short one, whereas 3 (20%) responded with fewer peaks. But the difference was not significant (McNemar P = 0.51). Neither deviant nor standard tone pairs showed a trend of response pattern with age in the short IPI conditions. However, in the studies with long IPI, the trend to an increasing number of responses with age was observable with both the deviant and standard stimulus types. These results were confirmed by the trend estimate of response number and GA.
3.2 Fetal Recordings
In the prenatal study, recordings were performed on 22 fetuses at gestational ages between 29 and 38 weeks. In two participants, only one of the two IPI conditions was recorded due to maternal discomfort. These incomplete studies were excluded from data analysis, leaving complete datasets from 20 subjects for further processing. The data from each recording session were separated into the same four categories as the neonatal data. The fetal response patterns are shown in Table 2a and 2b, and Figure 4 shows an example for a fetal response.
Table 2.
| a: Fetal responses to deviant stimulus (long and short), including number of trials, gestational age (GA) (in weeks), number of responses, amplitudes (in fT) and latencies (in ms). | |||||||||
|---|---|---|---|---|---|---|---|---|---|
| Stim_type | ID | Trials | long/short | GA_weeks | responses | ampl1 | ampl2 | latency1 | latency2 |
| Deviant | pat3051 | 14 | long | 35 | 1 | −12.3 | 393.6 | ||
| Deviant | pat3051 | 11 | short | 35 | 1 | 17.5 | 249.6 | ||
| Deviant | pat3052 | 14 | long | 35 | 1 | 7.5 | 380.8 | ||
| Deviant | pat3052 | 11 | short | 35 | 1 | 12.3 | 140.8 | ||
| Deviant | pat3053 | 14 | long | 35 | NER* | ||||
| Deviant | pat3053 | 8 | short | 35 | NER* | ||||
| Deviant | pat3500 | 14 | long | 32 | 1 | −14.7 | 540.8 | ||
| Deviant | pat3500 | 11 | short | 32 | 1 | −8.0 | 425.6 | ||
| Deviant | pat3505 | 14 | long | 29 | 1 | 6.2 | 470.4 | ||
| Deviant | pat3505 | 11 | short | 29 | NER* | ||||
| Deviant | pat3506 | 14 | long | 31 | 1 | −7.8 | 249.6 | ||
| Deviant | pat3506 | 11 | short | 31 | 1 | −6.4 | 243.2 | ||
| Deviant | pat3508 | 14 | long | 32 | 2 | −12.7 | −12.6 | 201.6 | 640.0 |
| Deviant | pat3508 | 11 | short | 32 | 1 | 8.1 | 115.2 | ||
| Deviant | pat3509 | 14 | long | 34 | 1 | 7.8 | 249.6 | ||
| Deviant | pat3509 | 11 | short | 34 | 1 | 3.6 | 316.8 | ||
| Deviant | pat3510 | 14 | long | 29 | 1 | 9.3 | 102.4 | ||
| Deviant | pat3510 | 11 | short | 29 | NER* | ||||
| Deviant | pat3511 | 14 | long | 30 | 1 | −10.7 | 547.2 | ||
| Deviant | pat3511 | 11 | short | 30 | 1 | 7.8 | 345.6 | ||
| Deviant | TP02 | 11 | long | 36 | 1 | −21.8 | 160.0 | ||
| Deviant | TP02 | 12 | short | 36 | 1 | 9.4 | 444.8 | ||
| Deviant | TP06 | 14 | long | 33 | 1 | −20.0 | 147.2 | ||
| Deviant | TP06 | 11 | short | 33 | NER* | ||||
| Deviant | TP08 | 14 | long | 35 | 2 | −8.7 | −7.3 | 208.0 | 729.6 |
| Deviant | TP08 | 12 | short | 35 | 1 | 6.7 | 249.6 | ||
| Deviant | TP09 | 14 | long | 37 | NER* | ||||
| Deviant | TP09 | 11 | short | 37 | 1 | 14.6 | 336.0 | ||
| Deviant | TP10 | 14 | long | 35 | NER* | ||||
| Deviant | TP10 | 11 | short | 35 | 1 | −17.2 | 496.0 | ||
| Deviant | TP11 | 14 | long | 33 | 1 | −6.7 | 368.0 | ||
| Deviant | TP11 | 11 | short | 33 | 1 | 8.2 | 515.2 | ||
| Deviant | TP12 | 14 | long | 35 | 1 | −8.2 | 678.4 | ||
| Deviant | TP12 | 11 | short | 35 | 1 | 9.8 | 569.6 | ||
| Deviant | TP13 | 14 | long | 35 | 1 | 6.7 | 544.0 | ||
| Deviant | TP13 | 11 | short | 35 | 1 | 8.1 | 409.6 | ||
| Deviant | TP14 | 14 | long | 33 | 1 | 9.4 | 396.8 | ||
| Deviant | TP14 | 11 | short | 33 | 1 | 7.6 | 636.8 | ||
| Deviant | TP15 | 14 | long | 33 | 1 | −6.4 | 492.8 | ||
| Deviant | TP15 | 11 | short | 33 | 1 | 7.0 | 7.8 | 374.4 | 553.6 |
| b: Fetal responses to standard stimulus (long and short), including number of trials, gestational age (GA) (in weeks), number of responses, amplitudes (in fT) and latencies (in ms). | |||||||||
|---|---|---|---|---|---|---|---|---|---|
| Stim_type | ID | Trials | long/short | GA_weeks | responses | ampl1 | ampl2 | latency1 | latency2 |
| Standard | pat3051 | 14 | long | 35 | 1 | −5.6 | 371.2 | ||
| Standard | pat3051 | 11 | short | 35 | 1 | 6.7 | 326.4 | ||
| Standard | pat3052 | 14 | long | 35 | NER* | ||||
| Standard | pat3052 | 11 | short | 35 | 1 | 7.8 | 326.4 | ||
| Standard | pat3053 | 14 | long | 35 | 1 | −13.0 | 534.4 | ||
| Standard | pat3053 | 8 | short | 35 | NER* | ||||
| Standard | pat3500 | 14 | long | 32 | 1 | −18.9 | 358.4 | ||
| Standard | pat3500 | 11 | short | 32 | 1 | 8.5 | 342.4 | ||
| Standard | pat3505 | 14 | long | 29 | 1 | −8.6 | 172.8 | ||
| Standard | pat3505 | 11 | short | 29 | 1 | 13.2 | 275.2 | ||
| Standard | pat3506 | 14 | long | 31 | 1 | −14.2 | 240.0 | ||
| Standard | pat3506 | 11 | short | 31 | 1 | −18.9 | 172.8 | ||
| Standard | pat3508 | 14 | long | 32 | 1 | 14.6 | 377.6 | ||
| Standard | pat3508 | 11 | short | 32 | NER* | ||||
| Standard | pat3509 | 14 | long | 34 | 1 | −10.0 | 480.0 | ||
| Standard | pat3509 | 11 | short | 34 | NER* | ||||
| Standard | pat3510 | 14 | long | 29 | 1 | 11.0 | 195.2 | ||
| Standard | pat3510 | 11 | short | 29 | 1 | 5.5 | 201.6 | ||
| Standard | pat3511 | 14 | long | 30 | 1 | 13.4 | 102.4 | ||
| Standard | pat3511 | 11 | short | 30 | 1 | −11.2 | 435.2 | ||
| Standard | TP02 | 11 | long | 36 | 2 | −18.5 | −14.6 | 521.6 | 707.2 |
| Standard | TP02 | 12 | short | 36 | 1 | 15.7 | 313.6 | ||
| Standard | TP06 | 14 | long | 33 | 2 | −26.8 | −22.2 | 361.6 | 518.4 |
| Standard | TP06 | 11 | short | 33 | 1 | −8.8 | 252.8 | ||
| Standard | TP08 | 14 | long | 35 | 1 | 9.2 | 499.2 | ||
| Standard | TP08 | 12 | short | 35 | 1 | 4.3 | 214.4 | ||
| Standard | TP09 | 14 | long | 37 | 2 | −9.2 | −9.6 | 352.0 | 425.6 |
| Standard | TP09 | 11 | short | 37 | 1 | 12.5 | 329.6 | ||
| Standard | TP10 | 14 | long | 35 | NER* | ||||
| Standard | TP10 | 11 | short | 35 | 1 | 11.3 | 336.0 | ||
| Standard | TP11 | 14 | long | 33 | 1 | −10.6 | 262.4 | ||
| Standard | TP11 | 11 | short | 33 | 1 | 10.1 | 588.8 | ||
| Standard | TP12 | 11 | short | 35 | 1 | 10.4 | 313.6 | ||
| Standard | TP12 | 14 | long | 35 | 1 | −6.3 | 316.8 | ||
| Standard | TP13 | 14 | long | 35 | 1 | −7.1 | 342.4 | ||
| Standard | TP13 | 11 | short | 35 | 1 | 4.8 | 288.0 | ||
| Standard | TP14 | 14 | long | 33 | 1 | −11.7 | 201.6 | ||
| Standard | TP14 | 11 | short | 33 | 1 | −6.9 | 185.6 | ||
| Standard | TP15 | 14 | long | 33 | 1 | −6.9 | 560.0 | ||
| Standard | TP15 | 11 | short | 33 | NER* | ||||
NER = no evident response
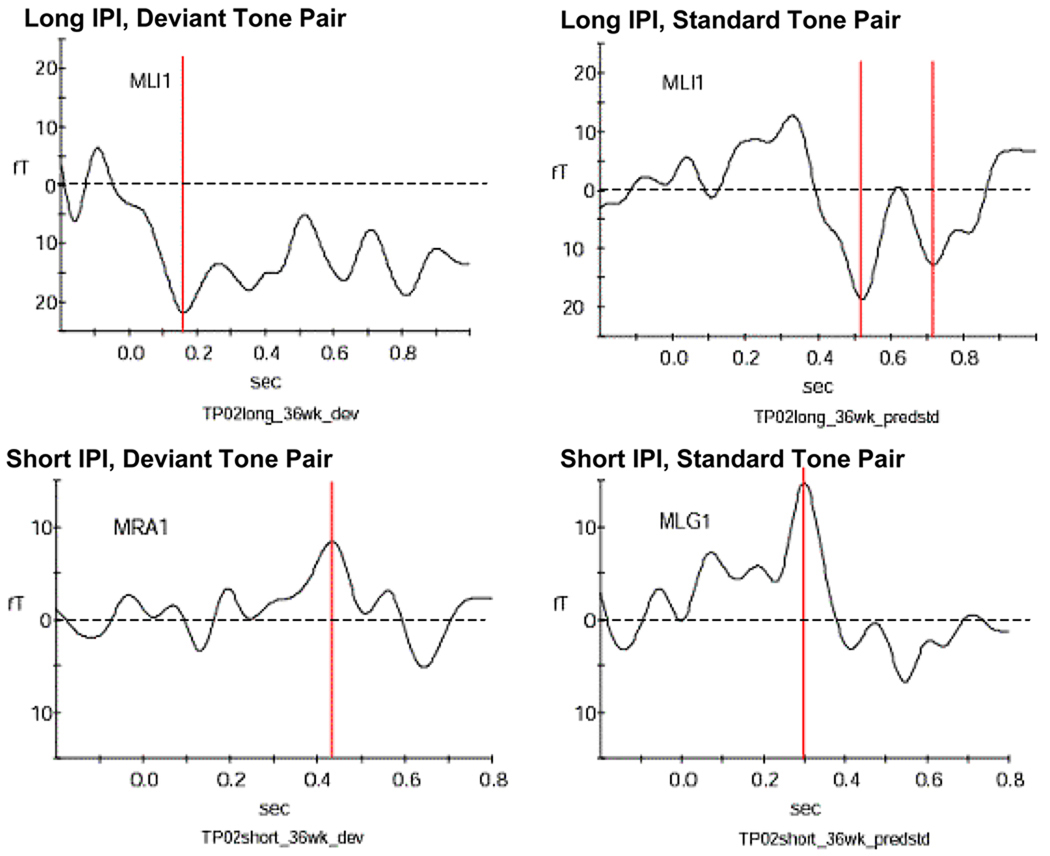
Figure 4. Example for responses from a fetus at 36 weeks GA.
This neonate responded with one peak to the long deviant tone pair, with two peaks to the long standard tone pair and with one peak to both short IPI conditions. The peaks are indicated by the red bar. The dotted line marks the zero level of the amplitude.
MLI1, MRA1 and MLG1 indicate which one of the 151 sensor arrays recorded the signal shown above.
3.2.1 Long IPI Condition, Deviant Tone
In the 20 fetal recordings analyzed, three (15%) showed no response, 15 (75%) showed responses with one peak, and two (10%) showed responses with two peaks to the long deviant tone pair. The trend in response number with gestational age was moderately negative, but not statistically significant (rank correlation = −0.348; P = 0.13). Latencies and amplitudes, as well as fetal GA are shown in table 2a.
3.2.2 Long IPI Condition, Standard Tone
To the long IPI condition and standard tone pair, two fetuses (10%) showed no response, 15 (75%) showed responses with one peak, and three (15%) showed responses with two peaks. The trend in number of peaks with gestational age was not statistically significant (rank correlation = +0.137; P = 0.56). Table 2b shows fetal GA at the time of recording, latencies and amplitudes of the responses.
3.2.3 Short IPI Condition, Deviant Tone
To the short IPI condition with deviant tone pair, four fetuses (20%) showed no response while the remaining 16 (80%) showed responses with one peak. The trend in peak number with GA was moderately positive, but not statistically significant (rank correlation = +0.345; P = 0.14). Response latencies and amplitudes can be found in table 2a.
3.2.4 Short IPI Condition, Standard Tone
For the short IPI condition with standard tone pair, three fetuses (15%) showed no response while the remaining 17 (85%) showed one peak. The trend in peak number with GA was not statistically significant (rank correlation = +0.062; P = 0.79). Table 2b contains response latencies, amplitudes and fetal GA.
3.2.5 Summary of fetal recordings
None of the McNemar exact test results for the seven comparisons discussed next were statistically significant. Under short IPI, no fetus responded with two peaks to either type of tone pair. Under long IPI, two fetuses (10%) responded with two peaks to the deviant tone pair (McNemar Exact P = 0.50) and three (15%) responded with two peaks to the standard tone pair (McNemar Exact P = 0.25). To the deviant tone pair, three fetuses (15%) showed no response under long IPI, and four (20%) showed no response under short IPI (McNemar Exact P = 1.00). In response to the standard tone pair, two fetuses (10%) showed no peak in the long IPI condition, and three (15%) showed no peak in the short IPI condition (McNemar Exact P = 1.00). To summarize responses in the short IPI condition, 16 fetuses (80%) showed peaks to the deviant tone pair, and 17 (85%) to the standard tone pair (McNemar Exact P = 1.00). In the long IPI condition, 18 fetuses (90%) responded to the standard tone pair and 17 (85%) to the deviant one (McNemar Exact P = 1.00). Two-peak responses were observed in three fetuses (15%) in the standard tone pair and in two fetuses (10%) in the deviant tone pair (McNemar Exact P = 1.00).
3.3 Comparison of fetal to neonatal recordings
Table 3 shows the comparisons between fetuses and neonates for the number of peaks elicited by each combination of tone-pair type and IPI condition. Regardless of IPI, the deviant tone pair tended to elicit a smaller proportion of non-responses and a larger proportion of two-peak responses in neonates compared to fetuses (Wilcoxon rank-sum (WRS) P values = 0.0032 for deviant long and 0.037 for deviant short). By contrast, neonates showed no significant shift, compared to fetuses, towards more peaks in response to the standard tone pair (WRS P values = 0.42 for standard long and 0.74 for standard short).
Table 3.
Comparisons of Response Pattern between Fetuses and Neonates
| Response Pattern |
Deviant, long: N (%)A |
Deviant, short: N (%)A |
Standard, long: N (%)A |
Standard, short: N (%)A |
||||
|---|---|---|---|---|---|---|---|---|
| Fetal | Neonatal | Fetal | Neonatal | Fetal | Neonatal | Fetal | Neonatal | |
|
No Responses |
30 (15%) |
0 (0%) |
4 (20%) |
0 (0%) |
2 (10%) |
4 (27%) |
3 (15%) |
4 (27%) |
|
One Response |
15 (75%) |
7 (47%) |
16 (80%) |
14 (93%) |
15 (75%) |
4 (27%) |
17 (85%) |
8 (53%) |
|
Two Responses |
2 (10%) |
8 (53%) |
0 (0%) |
1 (7%) |
3 (15%) |
7 (47%) |
0 (0%) |
3 (20%) |
| WRSB P value |
0.0032 | 0.037 | 0.43 | 0.74 | ||||
Comparisons of Response Patterns between Fetuses and Neonates under each combination of tone pair type (deviant or standard) and IPI condition (long or short).
N=Number of subjects; %=percent of total subjects, which is 20 for fetuses and 15 for neonates.
Wilcoxon rank-sum test, contingency-table version for ordered categorical data (Agresti, 1996).
4. Discussion
The main finding of this study was that brain responses to RTP tasks could be detected with MEG technology on fetuses and neonates. A trend over age was observed: older neonates responded more often with two peaks than younger neonates. After 22 days of chronological age, all newborns, except one, showed responses with two peaks to two tones separated by a 300 ms IPI. This indicates that infants can successfully process rapidly presented stimuli by three weeks of age. The learning processes involved could be based on increased exposure to or experience with rapid temporal stimuli within this time frame. However, these findings have also been confirmed by the analysis using GA instead of chronological age. This indicates that cortical maturational processes might play an important role in improved cortical processing capabilities. Future studies are needed to investigate the effects of brain development versus learning through experience and exposure to speech stimuli on the maturation of RTP. No trend towards improved RTP with age was evident under the short IPI conditions. This might indicate that the short interval between the tones (70 ms IPI) might be too difficult for the neonates to process, whereas the long IPI condition showed a gradual trend to successful processing with increasing age. The reasons for the trend over age in the longer IPI condition remains speculative, but might indicate a critical stage for the processing capabilities of rapid, successive stimuli within the first three weeks of life. This needs to be investigated in future studies with a larger number of subjects in different age groups and longer IPIs (> 300 ms) between the two tones.
Compared to the standard tone pair, the deviant tone pair did not significantly increase the number of two-peak responses in neonates under either IPI condition. However, the proportions of neonate non-responders were appreciably higher under both IPI conditions to standard tone pairs (27% for both) compared to deviant tone pairs (0% for both), although the differences were not statistically significant because of the small sample sizes. This is in concordance with the findings of an EEG study conducted by Carral et al. [56]. The authors presented standard and deviant tone pairs of frequencies between 1661 Hz and 523 Hz to neonates and found the response amplitudes in the deviant tone pairs to be higher than in the standard tone pairs. Therefore, habituation processes might have lowered the responsiveness to the standard tone pair, which constituted 85% of all tone-pair presentations [57].
Under a short IPI, the majority (eight out of 11) of responders showed only one peak in response to the standard tone. This finding was repeated more strongly for the deviant tone pair, where only one infant responded with a two-peak response, and where that one infant (pat3506) surprisingly showed two peaks to three of the four IPI-stimulus combinations of this study. Moreover, the neonatal response patterns (zero, one or two peaks) did not show a trend over age under short IPI. These findings might reflect an inability to successfully process a rapid succession of stimuli. However, this possibility remains unclear until addressed in future studies with a larger number of subjects that include different age groups, and in which IPI between the tones in a pair can be varied.
The fetal recordings revealed an interesting observation. With the presentation of tone pairs, the auditory fetal response rate to the standard tones was increased from 60% in a study with similar length and stimulus duration [34] to between 76% and 86% in our study. This might be due to the overall longer duration of the tone pair compared to a single tone. The fetal auditory system perceives both tones in the pair as one, which activates more neurons and increases the probability to record a response. Another question that needs further investigation is that of the two-peak responses of some fetuses as early as 32 weeks of gestational age in the long IPI condition. One explanation might be the fetal state at the time of recording. The processing of rapidly presented stimuli might differ depending on whether the fetus was asleep or awake. But this question needs to be addressed in a longitudinal study with more subjects.
In summary, this study succeeded in recording evoked responses to rapid auditory stimuli at very early developmental stages. Moreover, this investigation offered important implications for future studies in the field of pre- and neonatal precursors for the maturation of speech. With fMEG technology neurophysiological recordings at early developmental ages were possible due to the non-invasive nature of the device. In future studies, the determination of a critical time frame for rapid, successive evoked responses in low-risk subjects might be possible.
The findings from this study could lead to a better understanding of early RTP skills as well as the cortical responses representing them. Therefore, it might be the first step towards an early diagnosis of auditory processing delays. Further studies could compare clinical and control groups and might contribute to the development of intervention methods that improve delayed auditory processing and therefore prevent further deficits in speech development.
Acknowledgments
This study was supported by the funds of the National Institutes of Health (NIH): 2R01NS036277-08A1 and 1R01EB007826.
Abbreviations
- IPI
Intra-Pair Interval, the length of time (in ms) between the two tones in a tone pair
- GA
Gestational Age
- RTP
Rapid Temporal Processing
- MEG
Magnetoencephalography
- MMN
Mismatch Negativity
- MMR
Mismatch Response
- ERP
Event-Related Response
- FD
Frequency Discrimination
- SARA
SQUID (Super Quantum Interference Device) Array for Reproductive Assessment
- pT
Pico-Tesla
- WRS
Wilcoxon Rank-Sum Test
Footnotes
Publisher's Disclaimer: This is a PDF file of an unedited manuscript that has been accepted for publication. As a service to our customers we are providing this early version of the manuscript. The manuscript will undergo copyediting, typesetting, and review of the resulting proof before it is published in its final citable form. Please note that during the production process errors may be discovered which could affect the content, and all legal disclaimers that apply to the journal pertain.
References
- 1.Molfese DL. Predicting dyslexia at 8 years of age using neonatal brain responses. Brain Lang. 2000;72:238–245. doi: 10.1006/brln.2000.2287. [DOI] [PubMed] [Google Scholar]
- 2.Guttorm TK, Leppänen PH, Tolvanen A, Lyytinen H. Event-related potentials in newborns with and without familial risk for dyslexia: principal component analysis reveals differences between the groups. J Neural Transm. 2003;110:1059–1074. doi: 10.1007/s00702-003-0014-x. [DOI] [PubMed] [Google Scholar]
- 3.DeCasper AJ, Fifer WP. Of human bonding: newborns prefer their mothers' voices. Science. 1980;208:1174–1176. doi: 10.1126/science.7375928. [DOI] [PubMed] [Google Scholar]
- 4.Ockleford EM, Vince MA, Layton C, Reader MR. Responses of neonates to parents' and others' voices. Early Hum Dev. 1988;18:27–36. doi: 10.1016/0378-3782(88)90040-0. [DOI] [PubMed] [Google Scholar]
- 5.Fifer WP, Moon C. Psychobiology of newborn auditory preferences. Semin Perinatol. 1989;13:430–433. [PubMed] [Google Scholar]
- 6.Fitch RH, Miller S, Tallal P. Neurobiology of speech perception. Annu Rev Neurosci. 1997;20:331–353. doi: 10.1146/annurev.neuro.20.1.331. [DOI] [PubMed] [Google Scholar]
- 7.Jusczyk PW, Pisoni DB, Walley A, Murray J. Discimination of relative onset time of two-component tones by infants. J Acoust Soc Am. 1980;67:262–270. doi: 10.1121/1.383735. [DOI] [PMC free article] [PubMed] [Google Scholar]
- 8.Benasich AA, Choudhury N, Friedman JT, Realpe-Bonilla T, Chojnowska C, Gou Z. The infant as a prelinguistic model for language learning impairments: predicting from event-related potentials to behavior. Neuropsychologia. 2006;44:396–411. doi: 10.1016/j.neuropsychologia.2005.06.004. [DOI] [PMC free article] [PubMed] [Google Scholar]
- 9.Benasich AA, Thomas JJ, Choudhury N, Leppanen PH. The importance of rapid auditory processing abilities to early language development: evidence from converging methodologies. Dev Psychobiol. 2002;40:278–292. doi: 10.1002/dev.10032. [DOI] [PMC free article] [PubMed] [Google Scholar]
- 10.Farmer ME, Klein RM. The evidence for a temporal processing deficit linked to dyslexia: A review. Psychon Bull Rev. 1995;2:460–493. doi: 10.3758/BF03210983. [DOI] [PubMed] [Google Scholar]
- 11.Tallal P, Piercy M. Defects of non-verbal auditory perception in children with developmental aphasia. Nature. 1973;241:468–469. doi: 10.1038/241468a0. [DOI] [PubMed] [Google Scholar]
- 12.Walker KM, Hall SE, Klein RM, Phillips DP. Development of perceptual correlates of reading performance. Brain Res. 2006;1124:126–141. doi: 10.1016/j.brainres.2006.09.080. [DOI] [PubMed] [Google Scholar]
- 13.Wright BA, Lombardino LJ, King WM, Puranik CS, Leonard CM, Merzenich MM. Deficits in auditory temporal and spectral resolution in language-impaired children. Nature. 1997;387:176–178. doi: 10.1038/387176a0. [DOI] [PubMed] [Google Scholar]
- 14.Benasich AA, Tallal P. Infant discrimination of rapid auditory cues predicts later language impairment. Behav Brain Res. 2002;136:31–49. doi: 10.1016/s0166-4328(02)00098-0. [DOI] [PubMed] [Google Scholar]
- 15.Oram Cardy JE, Flagg EJ, Roberts W, Brian J, Roberts TP. Magnetoencephalography identifies rapid temporal processing deficit in autism and language impairment. Neuroreport. 2005;16:329–332. doi: 10.1097/00001756-200503150-00005. [DOI] [PubMed] [Google Scholar]
- 16.Näätänen R. The perception of speech sounds by the human brain as reflected by the mismatch negativity (MMN) and its magnetic equivalent (MMNm) Psychophysiology. 2001;38:1–21. doi: 10.1017/s0048577201000208. [DOI] [PubMed] [Google Scholar]
- 17.Näätänen R, Gaillard AW, Mäntysalo S. Early selective-attention effect on evoked potential reinterpreted. Acta Psychol. 1978;42:313–329. doi: 10.1016/0001-6918(78)90006-9. [DOI] [PubMed] [Google Scholar]
- 18.Sams M, Paavilainen P, Alho K, Näätänen R. Auditory frequency discrimination and event-related potentials. Electroencephalogr Clin Neurophysiol. 1985;62:437–448. doi: 10.1016/0168-5597(85)90054-1. [DOI] [PubMed] [Google Scholar]
- 19.Alho K, Sainio K, Sajaniemi N, Reinikainen K, Näätänen R. Event-related brain potential of human newborns to pitch change of an acoustic stimulus. Electroencephalogr Clin Neurophysiol. 1990;77:151–155. doi: 10.1016/0168-5597(90)90031-8. [DOI] [PubMed] [Google Scholar]
- 20.Cheour M, Leppänen PH, Kraus N. Mismatch negativity (MMN) as a tool for investigating auditory discrimination and sensory memory in infants and children. Clin Neurophysiol. 2000;111:4–16. doi: 10.1016/s1388-2457(99)00191-1. [DOI] [PubMed] [Google Scholar]
- 21.Cheour-Luhtanen M, Alho K, Sainio K, Rinne T, Reinikainen K, Pohjavuori M, et al. The ontogenetically earliest discriminative response of the human brain. Psychophysiology. 1996;33:478–481. doi: 10.1111/j.1469-8986.1996.tb01074.x. [DOI] [PubMed] [Google Scholar]
- 22.Dehaene-Lambertz G, Baillet S. A phonological representation in the infant brain. Neuroreport. 1998;9:1885–1888. doi: 10.1097/00001756-199806010-00040. [DOI] [PubMed] [Google Scholar]
- 23.Dehaene-Lambertz G, Dehaene S. Speed and cerebral correlates of syllable discrimination in infants. Nature. 1994;370:292–295. doi: 10.1038/370292a0. [DOI] [PubMed] [Google Scholar]
- 24.Huotilainen M, Kujala A, Hotakainen M, Shestakova A, Kushnerenko E, Parkkonen L, et al. Auditory magnetic responses of healthy newborns. Neuroreport. 2003;14:1871–1875. doi: 10.1097/00001756-200310060-00023. [DOI] [PubMed] [Google Scholar]
- 25.Kushnerenko E, Cheour M, Ceponiene R, Fellman V, Renlund M, Soininen K, et al. Central auditory processing of durational changes in complex speech patterns by newborns: an event-related brain potential study. Dev Neuropsychol. 2001;19:83–97. doi: 10.1207/S15326942DN1901_6. [DOI] [PubMed] [Google Scholar]
- 26.Tanaka M, Okubo O, Fuchigami T, Harada K. A study of mismatch negativity in newborns. Pediatr Int. 2001;43:281–286. doi: 10.1046/j.1442-200x.2001.01395.x. [DOI] [PubMed] [Google Scholar]
- 27.Duclaux R, Challamel MJ, Collet L, Roullet-Solignac I, Revol M. Hemispheric asymmetry of late auditory evoked response induced by pitch changes in infants: influence of sleep stages. Brain Res. 1991;566:152–158. doi: 10.1016/0006-8993(91)91693-u. [DOI] [PubMed] [Google Scholar]
- 28.Friederici AD, Friedrich M, Weber C. Neural manifestation of cognitive and precognitive mismatch detection in early infancy. Neuroreport. 2002;13:1251–1254. doi: 10.1097/00001756-200207190-00006. [DOI] [PubMed] [Google Scholar]
- 29.Pihko E, Leppänen PH, Eklund KM, Cheour M, Guttorm TK, Lyytinen H. Cortical responses of infants with and without a genetic risk for dyslexia: I. Age effects. Neuroreport. 1999;10:901–905. doi: 10.1097/00001756-199904060-00002. [DOI] [PubMed] [Google Scholar]
- 30.Ruusuvirta T, Huotilainen M, Fellman V, Näätänen R. The newborn human brain binds sound features together. Neuroreport. 2003;14:2117–2119. doi: 10.1097/00001756-200311140-00021. [DOI] [PubMed] [Google Scholar]
- 31.Tokioka AB, Pearce JW, Crowell DH. Endogenous event-related potentials in term and preterm infants. J Clin Neurophysiol. 1995;12:468–475. doi: 10.1097/00004691-199509010-00006. [DOI] [PubMed] [Google Scholar]
- 32.Huotilainen M, Kujala A, Hotakainen M, Parkkonen L, Taulu S, Simola J, et al. Short-term memory functions of the human fetus recorded with magnetoencephalography. Neuroreport. 2005;16:81–84. doi: 10.1097/00001756-200501190-00019. [DOI] [PubMed] [Google Scholar]
- 33.Draganova R, Eswaran H, Murphy P, Huotilainen M, Lowery C, Preissl H. Sound frequency change detection in fetuses and newborns, a magnetoencephalographic study. Neuroimage. 2005;28:354–361. doi: 10.1016/j.neuroimage.2005.06.011. [DOI] [PubMed] [Google Scholar]
- 34.Draganova R, Eswaran H, Murphy P, Lowery C, Preissl H. Serial magnetoencephalographic study of fetal and newborn auditory discriminative evoked responses. Early Hum Dev. 2007;83:199–207. doi: 10.1016/j.earlhumdev.2006.05.018. [DOI] [PubMed] [Google Scholar]
- 35.Uwer R, Albrecht R, von Suchodoletz W. Automatic processing of tones and speech stimuli in children with specific language impairment. Dev Med Child Neurol. 2002;44:527–532. doi: 10.1017/s001216220100250x. [DOI] [PubMed] [Google Scholar]
- 36.Ors M, Lindgren M, Blennow G, Nettelbladt U, Sahlen B, Rosén I. Auditory event-related brain potentials in children with specific language impairment. Eur J Paediatr Neurol. 2002;6:47–62. doi: 10.1053/ejpn.2001.0541. [DOI] [PubMed] [Google Scholar]
- 37.Bishop DV, McArthur GM. Individual differences in auditory processing in specific language impairment: a follow-up study using event-related potentials and behavioural thresholds. Cortex. 2005;41:327–341. doi: 10.1016/s0010-9452(08)70270-3. [DOI] [PMC free article] [PubMed] [Google Scholar]
- 38.Witton C, Talcott JB, Hansen PC, Richardson AJ, Griffiths TD, Rees A, et al. Sensitivity to dynamic auditory and visual stimuli predicts nonword reading ability in both dyslexic and normal readers. Curr Biol. 1998;8:791–797. doi: 10.1016/s0960-9822(98)70320-3. [DOI] [PubMed] [Google Scholar]
- 39.Talcott JB, Hansen PC, Assoku EL, Stein JF. Visual motion sensitivity in dyslexia: evidence for temporal and energy integration deficits. Neuropsychologia. 2000;38:935–943. doi: 10.1016/s0028-3932(00)00020-8. [DOI] [PubMed] [Google Scholar]
- 40.Studdert-Kennedy M, Mody M, Brady S. Speech perception deficits in poor readers: a reply to Denenberg's critique. J Learn Disabil. 2000;33:317–321. doi: 10.1177/002221940003300403. [DOI] [PubMed] [Google Scholar]
- 41.McArthur GM, Bishop DV. Auditory perceptual processing in people with reading and oral language impairments: current issues and recommendations. Dyslexia. 2001;7:150–170. doi: 10.1002/dys.200. [DOI] [PubMed] [Google Scholar]
- 42.Mody M, Studdert-Kennedy M, Brady S. Speech perception deficits in poor readers: auditory processing or phonological coding? J Exp Child Psychol. 1997;64:199–231. doi: 10.1006/jecp.1996.2343. [DOI] [PubMed] [Google Scholar]
- 43.Denenberg VH. A critique of Mody, Studdert-Kennedy, and Brady's "Speech perception deficits in poor readers: auditory processing or phonological coding?". J Learn Disabil. 1999;32:379–383. doi: 10.1177/002221949903200502. [DOI] [PubMed] [Google Scholar]
- 44.Tallal P, Gaab N. Dynamic auditory processing, musical experience and language development. Trends Neurosci. 2006;29:382–390. doi: 10.1016/j.tins.2006.06.003. [DOI] [PubMed] [Google Scholar]
- 45.Galaburda AM, Kemper TL. Cytoarchitectonic abnormalities in developmental dyslexia: a case study. Ann Neurol. 1979;6:94–100. doi: 10.1002/ana.410060203. [DOI] [PubMed] [Google Scholar]
- 46.Galaburda AM, Sherman GF, Rosen GD, Aboitiz F, Geschwind N. Developmental dyslexia: four consecutive patients with cortical anomalies. Ann Neurol. 1985;18:222–233. doi: 10.1002/ana.410180210. [DOI] [PubMed] [Google Scholar]
- 47.Humphreys P, Kaufmann WE, Galaburda A. Developmental dyslexia in women: neuropathological findings in three patients. Ann Neurol. 1990;28:727–738. doi: 10.1002/ana.410280602. [DOI] [PubMed] [Google Scholar]
- 48.Preissl H, Lowery CL, Eswaran H. Fetal magnetoencephalography: current progress and trends. Exp Neurol. 2004;190:S28–S36. doi: 10.1016/j.expneurol.2004.06.016. [DOI] [PubMed] [Google Scholar]
- 49.Lowery CL, Eswaran H, Murphy P, Preissl H. Fetal magnetoencephalography. Semin Fetal Neonatal Med. 2006;11:430–436. doi: 10.1016/j.siny.2006.09.002. [DOI] [PubMed] [Google Scholar]
- 50.Vrba J, Robinson SE, McCubbin J, Lowery CL, Eswaran H, Wilson JD, et al. Fetal MEG redistribution by projection operators. IEEE Trans Biomed Eng. 2004;51:1207–1218. doi: 10.1109/TBME.2004.827265. [DOI] [PubMed] [Google Scholar]
- 51.McCubbin J, Robinson SE, Cropp R, Moiseev A, Vrba J, Murphy P, et al. Optimal reduction of MCG in fetal MEG recordings. IEEE Trans Biomed Eng. 2006;53:1720–1724. doi: 10.1109/TBME.2006.876619. [DOI] [PubMed] [Google Scholar]
- 52.Eswaran H, Preissl H, Wilson JD, Murphy P, Robinson SE, Rose D, et al. Short-term serial magnetoencephalography recordings of fetal auditory evoked responses. Neurosci Lett. 2002;331:128–132. doi: 10.1016/s0304-3940(02)00859-5. [DOI] [PubMed] [Google Scholar]
- 53.Holst M, Eswaran H, Lowery C, Murphy P, Norton J, Preissl H. Development of auditory evoked fields in human fetuses and newborns: a longitudinal MEG study. Clin Neurophysiol. 2005;116:1949–1955. doi: 10.1016/j.clinph.2005.04.008. [DOI] [PubMed] [Google Scholar]
- 54.Cleveland WS, Devlin SJ, Grosse E. Regression by local fitting: methods, properties, and computational algorithms. J Econom. 1988;37:87–114. [Google Scholar]
- 55.Agresti A. An Introduction to Categorical Data Analysis. New York: John Wiley & Sons, Inc; 1996. Testing independence for ordinal data; pp. 34–39. [Google Scholar]
- 56.Carral V, Huotilainen M, Ruusuvirta T, Fellman V, Näätänen R, Escera C. A kind of auditory 'primitive intelligence' already present at birth. Eur J Neurosci. 2005;21:3201–3204. doi: 10.1111/j.1460-9568.2005.04144.x. [DOI] [PubMed] [Google Scholar]
- 57.Sheridan CJ, Preissl H, Siegel ER, Murphy P, Ware M, Lowery CL, et al. Neonatal and fetal response decrement of evoked responses: a MEG study. Clin Neurophysiol. 2008;119:796–804. doi: 10.1016/j.clinph.2007.11.174. [DOI] [PMC free article] [PubMed] [Google Scholar]


