

Abstract
T cell receptor (TCR) mediated activation of the transcription factor NF-κB is required for T cell proliferation, survival, and effector differentiation. Although this pathway is the subject of intense study, it is not known whether TCR signaling to NF-κB is digital (switch-like) or analog in nature. Through analysis of the phosphorylation and degradation of IκBα and the nuclear translocation and phosphorylation of the NF-κB subunit RelA, we show that TCR directed NF-κB activation is digital. Furthermore, digitization occurs well upstream of the IKK complex, as PKCθ translocation to the immunologic synapse and activation-associated aggregation of Bcl10 and Malt1 also demonstrate both digital behavior and high correlation with RelA nuclear translocation. Thus, similar to the TCR-to-MAPK signaling cascade, analog antigen inputs are converted to digital activation outputs to NF-κB at an early step downstream of TCR ligation.
Introduction
NF-κB is a transcription factor of central importance in T cell biology, inducing expression of genes involved in proliferation, effector differentiation, and survival. Ligation of the TCR and CD28 initiates a complex series of cytosolic phosphorylation and ubiquitination events that culminate in the activation of NF-κB (Fig. S1) (1).
Signal transduction pathways can be broadly characterized as digital or analog. Digital signaling is switch-like, specifying either ‘on or off’ outcomes, with no intermediate state. Thus, once the threshold for signal activation has been met, the intensity of the output signal is constant. In contrast, analog signaling entails a graded response, with the intensity of the output signal proportional to the intensity of the input stimulus. Frequently, biological signaling cascades combine digital and analog features to achieve exquisite control over outcomes. For example, EGF activation of ERK combines digital and analog signaling mechanisms (2). Specifically, plasma membrane Ras nanoclusters activate ERK in a digital manner, but the number of signaling Ras nanoclusters is dependent on the strength of the input signal (EGF concentration). In this way, the number of “on” Ras nanoclusters tunes the magnitude of the output response, allowing the cell to appropriately respond to different concentrations of EGF.
The TCR-triggered ERK pathway in T cells also combines both digital and analog elements. One model suggests that while ERK phosphorylation is digital, the inhibitory activity of the SHP-1 phosphatase is analog in nature (3). This model predicts that signals generated from weak TCR ligands are not strong enough to overcome SHP-1 inhibition, and therefore fail to trigger the phosphorylation of ERK. In contrast, strong TCR ligands quickly overcome SHP-1 inhibition, yielding a defined amount of ERK phosphorylation and T cell activation (3, 4). Another model proposes that weak antigen signals through the TCR trigger activation of Ras-GRP (but not SOS), yielding (weak) analog activation of Ras. In contrast, strong antigen signals trigger activation of both Ras-GRP and SOS, resulting in digital activation of the Ras-ERK pathway (5). Although the mechanistic details of these models differ, both postulate that analog antigen signals through the TCR are converted to digital outputs at an early (receptor-proximal) point in the ERK signaling cascade.
In contrast to TCR activation of ERK, recent data suggest that SDF-1 signaling through CXCR4 triggers ERK activation in T cells in an analog manner (6). Additionally, bypassing the TCR via PMA stimulation also results in analog activation of ERK (5). Thus, within a single cell, the same signaling module may be activated in either an analog or digital manner, depending on the nature of the stimulus.
Although there are now substantial data defining the TCR-to-ERK cascade as a digital signaling process (3–6), we are aware of no published reports examining the question of whether TCR activation of NF-κB occurs in a digital or analog manner. We thus conducted experiments to assess T cell NF-κB activation on a per-cell basis. These analyses reveal that TCR activation of NF-κB is digital in nature: i.e., with increasing TCR stimulation, the number of cells triggering the NF-κB pathway increases, whereas the magnitude of the NF-κB activation response is remarkably constant. All examined NF-κB signaling events exhibited digital behavior, including steps downstream of IKK activation (IκBα phosphorylation and degradation, RelA phosphorylation and nuclear translocation) and upstream of IKK activation (Bcl10/Malt1 aggregation, PKCθ immunological synapse (IS) translocation). Thus, analogous to the ERK signaling cascade, digitization of TCR signaling to NF-κB apparently occurs at a very early step in signal transmission.
Materials and Methods
Antibodies and stains
Antibodies and stains used in this study were purchased from eBiosciences: anti-human CD3 (OKT3), PE anti-mouse CD4 (GK1.5); from Cell Signaling Technology: rabbit anti-phospho-IκBα (Ser32; 14D4), rabbit anti-phospho-RelA (Ser536; 93H1), DRAQ5; from BD Biosciences: PE anti-IκBα (clone 25), PerCP anti-CD8 (53–6.7), anti-human CD28 (CD28.2); from Invitrogen: Alexa 488-, Alexa 555-, and Alexa 647-goat anti-rabbit IgG; from Jackson Immunoresearch: goat anti-mouse IgG; from Santa-Cruz Biotechnology: rabbit anti-p65/RelA antibody (C-20); or purified from hybridoma supernatants: anti-mouse CD3 (145-2C11), anti-mouse TCRβ (H57-597).
Mice
C57BL/6 (WT) mice, 4–8 weeks old, were purchased from NCI (Frederick, MD). OTII mice (7) between 6–10 weeks old were bred in-house. All experiments were approved by the USUHS IACUC.
T cell stimulation
Jurkat T cells (clone E6-1, ATCC) and the Carma1- and IKKγ-deficient mutants of Jurkat (8, 9) (kind gifts from Xin Lin and Shao-Cong Sun, respectively) were cultured at a density of 1–5 × 10⁵ cells/mL in RPMI + 10% FBS. Following 16 h starvation in RPMI + 0.2% FBS, cells were incubated on ice for 30 min with the indicated concentrations of anti-CD3 and anti-CD28, followed by 15 min incubation with 10 μg/mL anti-mouse IgG. Cells were activated by incubation in a 37°C water bath for 20 min. For PMA stimulation Jurkat T cells were incubated on ice for 30 minutes with the indicated concentrations of PMA and 1μM Ionomycin. Cells were activated by incubation in a 37°C water bath for 25 min.
Construction and maintenance of D10 T cell lines expressing PKCθ-GFP or Bcl10-CFP+Malt1-YFP has been previously described (10, 11). D10 T cells were stimulated either with immobilized anti-CD3, PMA plus ionomycin, or with CH12 B cells loaded overnight with conalbumin, as indicated in the figure legends. For primary T cell stimulations, lymph nodes were harvested and T cells were purified and stimulated with anti-TCRβ or ovalbumin as previously described (12).
Intracellular staining for flow cytometry
Jurkat T cells were fixed with 1.5% paraformaldehyde and permeabilized with BD Phosflow Perm Buffer II chilled to −20°C. Cells were blocked for 1 hour with 1.25% normal mouse serum, then incubated overnight with PE-anti-IκBα. Primary T cells were fixed with 2% paraformaldehyde and stained with anti-CD8 and anti-CD4, followed by two washes, permeabilization, and overnight staining with antibodies specific for phospho-IκBα or phospho-RelA. Secondary detection was with Alexa 647- or Alexa 488-anti-rabbit IgG. Flow cytometry was performed on a BD LSRII, and data analysis was performed using WinList 5.0 and FlowJo.
Microscopy
Stimulated D10 cells were fixed, stained, and imaged as described (10–12), using rabbit anti-RelA followed by Alexa-555 anti-rabbit and DRAQ5 (to label nuclei). The ratio of nuclear/cytoplasmic RelA was calculated as described (12).
Results and Discussion
Digital NF-κB activation in response to graded TCR stimulation
To assess NF-κB activation on a per cell basis, we employed a flow cytometry assay of IκBα degradation, as recently described (13, 14). Stimulation of Jurkat T cells with 5 μg/ml anti-CD3 resulted in a decrease in IκBα protein compared to unstimulated controls, indicating NF-κB activation (Fig. 1A). Notably, IκBα degradation occurred in most or all cells, and the amount of degradation appeared quite uniform. As expected, NEMO and Carma1 deficient Jurkat lines showed no IκBα degradation in response to anti-CD3 (8, 15), further validating the specificity of this assay.
Figure 1. TCR stimulation triggers digital IκBα degradation.

A, Jurkat T cells and the indicated mutants of Jurkat were stimulated for 20 min with 5 μg/mL anti-CD3 + 1μg/mL anti-CD28. Flow cytometry was used to detect levels of intracellular IκBα. Histograms show unstimulated cells (solid line) and stimulated cells (gray fill). B, Jurkat stimulation was as in A, but with the indicated concentrations of anti-CD3. Dotted line marks peak intensity of IκBα staining in unstimulated cells, and dashed line marks the peak intensity of IκBα staining in stimulated cells (Left). Graph shows the percentage of cells in the stimulated cell peak at each anti-CD3 concentration (Right). C, The experiment of B was repeated using the indicated concentrations of PMA plus 1 μm ionomycin as the stimulus.
We next performed an experiment to compare IκBα degradation in response to a broad range of anti-CD3 concentrations. As shown in Figure 1B, across at least a 10,000-fold concentration range, two populations of cells are always apparent: a stimulated population with lower IκBα levels (dashed line) and an unstimulated population with higher IκBα levels (dotted line). Only the proportion of responding cells (but not the intensity of the degradation peak) changed as the anti-CD3 stimulus was increased. These data suggest that the strength of the anti-CD3 stimulus does not affect the magnitude of signaling, but rather the number of responding cells, consistent with an on/off (digital) pattern of activation.
We also performed an experiment stimulating the Jurkat cells with varying concentrations of PMA plus 1 μM ionomycin. In contrast to the results with anti-CD3, all concentrations of PMA yielded a single peak of IκBα fluorescence, which gradually decreased in intensity as the PMA concentration was increased (Fig. 1C). Intermediate values of IκBα fluorescence were most apparent in the 400 – 800 pg/mL concentration range. Thus, analogous to previously reported data regarding PMA-mediated activation of ERK (5), the PMA-stimulated degradation of IκBα is graded (analog). Taken together, the data in Figure 1 suggest that IκBα degradation in response to CD3 ligation is digital, while PMA-stimulated IκBα degradation is analog.
Digital nuclear translocation of NF-κB
The immediate downstream consequence of IκBα degradation is the nuclear translocation of NF-κB. To investigate the kinetics of nuclear translocation of RelA-containing NF-κB complexes, D10 T cells were stimulated with concentrations of anti-CD3 empirically determined to yield high, moderate, and low percentages of cells with NF-κB nuclear translocation. As shown in Figure 2A, the kinetics of RelA nuclear translocation were similar across all stimulation conditions. The percentage of cells showing nuclear RelA sharply increased by 0.5 h post-stimulation, and remained relatively unchanged through at least 3 h post-stimulation. Between 3–4 h post-stimulation, the percentage of cells with nuclear RelA markedly declined, approaching basal levels by 6 h post-stimulation. Thus, higher concentrations of anti-CD3 recruited a greater proportion of responding cells, but the kinetics of the response were essentially identical across concentrations.
Figure 2. POLKADOTS formation and PKCθ translocation are highly correlated with RelA nuclear translocation.
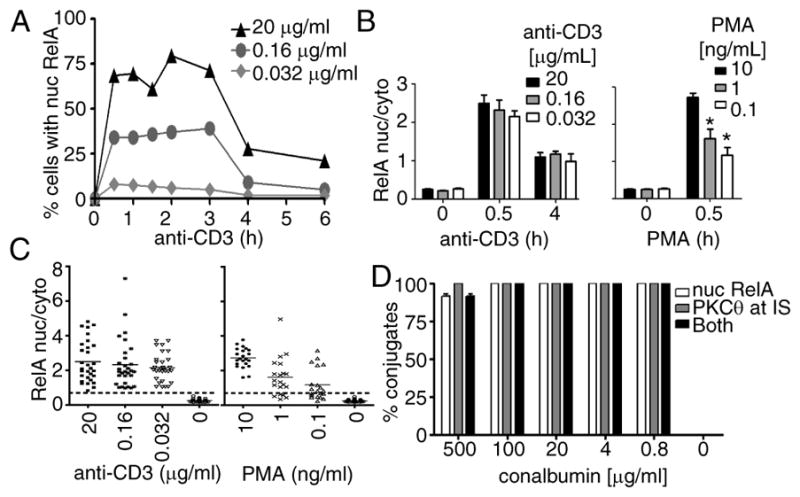
D10 T cells were stimulated with the indicated concentrations of anti-CD3. A, Percentage of cells with RelA enrichment in the nucleus was evaluated at the indicated time points for three different anti-CD3 concentrations. Data are representative of two experiments. B, In cells that formed POLKADOTS, the ratio of nuclear to cytoplasmic RelA was calculated at 0, 0.5, and 4 h for the indicated anti-CD3 concentrations (Left), and at 0 and 0.5 h using the indicated concentrations of PMA plus 1 μM ionomycin (Right). Unstimulated cells formed no POLKADOTS and were randomly selected for analysis. Asterisk indicates p<0.001 vs. 10 ng/mL PMA (one-way ANOVA, Tukey’s multiple comparison test). C, The 0 and 0.5 h anti-CD3 and PMA data from B are shown as scatter plots, with 0.7, the empirically determined maximum for nuclear/cytoplasmic RelA in unstimulated (or unactivated) cells, indicated by a dashed line. D, The percentage of T cells in T cell-APC conjugates having either RelA nuclear translocation (white bars), PKCθ translocation to the IS (gray bars), or both nuclear RelA and PKCθ translocation (black bars), 25 min after conjugate formation. The D10 T cell lines used in these experiments expressed either Bcl10-CFP and Malt1-YFP (A-C) or PKCθ-GFP (D). Error bars are SEM.
Next, the average anti-RelA fluorescence intensity in the cytosol and nucleus was quantified for cells at 0, 0.5, and 4 h post-stimulation, and the per cell ratio of nuclear to cytoplasmic RelA was used as a measure of the degree of NF-κB translocation. At both 0.5 and 4 h post-anti-CD3 stimulation (Figs. 2B and S2A), the proportion of RelA nuclear translocation per cell was constant across all stimulation concentrations. In contrast, nuclear translocation of RelA increased as the concentration of PMA was increased (Figs. 2B and S2B). Thus, consistent with the results in Jurkat T cells, stimulation of D10 T cells with increasing concentrations of anti-CD3 did not affect the magnitude of the output signal (RelA nuclear translocation), whereas increasing PMA concentrations clearly increased the output intensity. Taken together, these data indicate that NF-κB nuclear translocation occurs in a digital fashion in response to signals through the TCR, but in an analog manner in response to PMA.
Digitization of NF-κB signaling occurs at the level of or upstream of PKCθ
IκBα degradation and NF-κB nuclear translocation are terminal steps in NF-κB activation, which occur downstream of IKK activation. To determine whether digitization of the NF-κB cascade occurs at the level of or upstream of the IKK complex, we examined signaling events known to occur upstream of IKK activation. Punctate and Oligomeric Killing or Activating Domains Transducing Signals (POLKADOTS) are cytoplasmic foci containing Bcl10, Malt1, and a number of additional NF-κB signaling molecules. These structures form post-TCR stimulation in a manner highly correlated with successful signal transmission by Bcl10 and Malt1 (10, 11, 16). The concentration of stimulatory anti-CD3 antibody affected the percentage of responding cells, as higher anti-CD3 antibody concentrations resulted in an increased percentage of cells displaying POLKADOTS and nuclear RelA (Fig. S3A-B). Indeed, at all tested concentrations of anti-CD3, 100% of the cells that formed POLKADOTS also had RelA nuclear translocation, and the distribution of RelA nuclear/cytoplasmic intensities was remarkably similar at all three concentrations (Figs. 2C and S3C).
In contrast, in response to PMA stimulation, the distribution of nuclear/cytoplasmic RelA intensities increased in proportion to the PMA dose. Moreover, at the 1 ng/ml and 0.1 ng/ml PMA concentrations, substantial numbers of cells with POLKADOTS had background levels of RelA translocation (Fig. 2C). Thus, in these cells, PMA stimulation triggered POLKADOTS formation, but failed to trigger RelA nuclear translocation. These observations are consistent with termination of the NF-κB signaling cascade downstream of POLKADOTS formation and upstream of RelA activation. Thus, unlike stimulation with anti-CD3, stimulation with sub-optimal levels of PMA yields an intensity of downstream signaling that is proportional in magnitude to PMA concentration and is abortive in a subset of cells. Together, these data suggest that signal digitization in response to anti-CD3 stimulation occurs at the level of or upstream of Bcl10/Malt1 activation.
To examine whether NF-κB activation events upstream of Bcl10 are digital or analog, we quantified the percentage of D10 T cells showing translocation of PKCθ to the IS. Our previous data showed a high degree of correlation between cells with POLKADOTS and cells with PKCθ translocation to the IS (10). Thus, given the data in Figures 2C and S3, it was not surprising that cells with RelA nuclear translocation invariably showed PKCθ translocation to the IS (Fig. 2D). Although the percentage of T cell/B cell conjugates declined with antigen dose, no apparent difference in the efficiency of PKCθ translocation to the IS was observed (Fig. S4). Combined with our previous observation that the percentage of cells with PKCθ translocation and POLKADOTS formation also declines with antigen dose (10), we conclude that the strength of antigen signaling through the TCR influences the probability that the TCR will be activated, but not the strength of signaling in the PKCθ-to-NF-κB cascade.
Taken together, the above data suggest that digitization of NF-κB activation occurs well upstream of IKK activation, at the level of or upstream of PKCθ activation (Fig. S1). Thus, digitization of the NF-κB signal is a receptor proximal event, occurring at a step early in signal transmission.
Primary T cells exhibit digital IκBα and NF-κB RelA phosphorylation
To determine if the results from Jurkat and D10 T cell lines could be generalized to the activation of primary T cells, C57BL/6 T cells were stimulated with increasing concentrations of anti-TCRβ antibody. We monitored phosphorylation of IκBα by flow cytometry, as previously described (12). Stimulation with 4 μg/mL – 100 μg/mL anti-TCRβ resulted in the appearance of a phosphorylation peak in both CD4+ and CD8+ T cells. Consistent with the behavior of Jurkat T cells (Fig. 1B), as the stimulatory antibody concentration increased, both CD4+ and CD8+ T cells showed an increase in the number of cells with IκBα phosphorylation. However, there was no change in the per cell intensity of IκBα phosphorylation (in the responding peak) across anti-TCRβ concentrations (Fig. 3A). Analogous results were obtained when we examined the activation-associated phosphorylation of RelA at S536 (17). Again, the number of cells with RelA phosphorylation increased as the concentration of anti-TCRβ antibody increased, but the per cell intensity of phospho-RelA in the responding population was constant. Taken together, the data from Figure 3A-B indicate that once the threshold for TCR signal transmission has been met, IκBα and RelA phosphorylation occurs in a digital manner in primary CD4+ and CD8+ T cells.
Figure 3. Antigen stimulation triggers digital phosphorylation of IκBα and RelA.

A, C57BL/6 lymphocytes were stimulated for 48 h with the indicated concentrations of anti-TCRβ. Phospho-IκBα was measured in CD4+ and CD8+ T cells by flow cytometry (histograms). Dashed line indicates peak intensity of phospho-IκBα after stimulation. Graphs show mean fluorescence intensity (MFI) of responding CD4+ (black bars) and CD8+ (shaded bars) T cells, and the percentage of responding CD4+ (black bars) and CD8+ (shaded bars) T cells. B, Same experiment as in A, except phospho-RelA was quantified. C, OTII CD4+ T cells were stimulated with the indicated concentrations of OVA325–339, and phospho-IκBα was quantified as in A. Adjusted MFI = (MFI of the pIκBα peak) – (MFI of the 2°-only control). Each panel is representative of 4 similar experiments.
Digital IκBα phosphorylation in response to antigen stimulation
Antibody-mediated crosslinking of the TCR is a potent method of stimulating T cells, which may result in artificially high levels of signaling and confound the analysis of signaling pathways. Therefore, we used CD4+ T cells from OTII transgenic mice to examine the phosphorylation of IκBα in response to antigen. OTII CD4+ T cells stimulated with null peptide or 0.04 μg/mL OVA peptide showed no detectable IκBα phosphorylation, while 0.2 – 5 μg/mL OVA peptide yielded a population of cells with phosphorylation of IκBα (Fig. 3C). Consistent with data from Jurkat cells (Fig. 1), D10 cells (Fig. 2), and anti-TCR stimulated primary T cells (Fig. 3A-B), the percentage of responding cells increased with increasing peptide concentration, but the per cell level of IκBα phosphorylation was constant across antigen doses. Together, the data in Fig. 3 suggest that TCR mediated NF-κB activation in primary CD4+ and CD8+ T cells is digital in nature. Furthermore, digital activation occurs whether the activating stimulus is an anti-TCR antibody or an antigen-loaded APC.
Overall, our data indicate that TCR signaling results in digital activation of NF-κB in T cell lines and primary T cells in response to either antibody cross-linking of the TCR or antigenic stimulation. Differences in antigen availability control the number of cells successfully activated, rather than the magnitude of activation in individual cells. Signal digitization apparently occurs at the level of or upstream of PKCθ. Thus, as in ERK signaling from the TCR (3–6), signal digitization to NF-κB occurs at a very early step in the signaling cascade.
This work, showing digital TCR activation of NF-κB, in combination with previous work documenting digital TCR-to-ERK signaling, provides strong evidence that the TCR has evolved to function as a digital sensor of peptide antigen. The particular “tuning” of this digital machine guarantees that strongly activating foreign antigens, but not weakly activating self antigens, generate productive signals to downstream transcription factors (3). Furthermore, once the threshold for signal transmission has been met, digital signaling through the TCR is likely to ensure that the responding cell activates the precise levels of gene transcription required to successfully complete complex proliferation and effector differentiation programs. Although current models of TCR triggering of the Ras-ERK pathway (3, 5) do not explicitly include a mechanism for initiation of NF-κB signaling, it seems logical that the mechanisms of digital activation of ERK and NF-κB signaling would be identical or mechanistically linked, in order to prevent the circumstances under which ERK, but not NF-κB (or vice-versa), is activated. The elucidation of early steps that specify digital TCR signaling is thus clearly an important area for further investigation.
Importantly, while this manuscript was in revision, another group reported digital NF-κB activation (with certain analog components) downstream of TNF stimulation (18). It is thus likely that digital activation of NF-κB can be generalized to many distinct receptor-triggered NF-κB signaling cascades.
Supplementary Material
Acknowledgments
The authors thank Xin Lin and Shao-Cong Sun for cell lines.
Footnotes
Funding was provided by grants to BCS from the NIH (AI057481), the Sidney Kimmel Foundation for Cancer Research, and the Dana Foundation
References
- 1.Kingeter LM, Schaefer BC. Malt1 and cIAP2-Malt1 as effectors of NF-kappaB activation: kissing cousins or distant relatives? Cell Signal. 2010;22:9–22. doi: 10.1016/j.cellsig.2009.09.033. [DOI] [PMC free article] [PubMed] [Google Scholar]
- 2.Tian T, Harding A, Inder K, Plowman S, Parton RG, Hancock JF. Plasma membrane nanoswitches generate high-fidelity Ras signal transduction. Nat Cell Biol. 2007;9:905–914. doi: 10.1038/ncb1615. [DOI] [PubMed] [Google Scholar]
- 3.Altan-Bonnet G, Germain RN. Modeling T cell antigen discrimination based on feedback control of digital ERK responses. PLoS Biol. 2005;3:e356. doi: 10.1371/journal.pbio.0030356. [DOI] [PMC free article] [PubMed] [Google Scholar]
- 4.Stefanova I, Hemmer B, Vergelli M, Martin R, Biddison WE, Germain RN. TCR ligand discrimination is enforced by competing ERK positive and SHP-1 negative feedback pathways. Nat Immunol. 2003;4:248–254. doi: 10.1038/ni895. [DOI] [PubMed] [Google Scholar]
- 5.Das J, Ho M, Zikherman J, Govern C, Yang M, Weiss A, Chakraborty AK, Roose JP. Digital signaling and hysteresis characterize ras activation in lymphoid cells. Cell. 2009;136:337–351. doi: 10.1016/j.cell.2008.11.051. [DOI] [PMC free article] [PubMed] [Google Scholar]
- 6.Lin J, Harding A, Giurisato E, Shaw AS. KSR1 modulates the sensitivity of mitogen-activated protein kinase pathway activation in T cells without altering fundamental system outputs. Mol Cell Biol. 2009;29:2082–2091. doi: 10.1128/MCB.01634-08. [DOI] [PMC free article] [PubMed] [Google Scholar]
- 7.Barnden MJ, Allison J, Heath WR, Carbone FR. Defective TCR expression in transgenic mice constructed using cDNA-based alpha-and beta-chain genes under the control of heterologous regulatory elements. Immunol Cell Biol. 1998;76:34–40. doi: 10.1046/j.1440-1711.1998.00709.x. [DOI] [PubMed] [Google Scholar]
- 8.Wang D, You Y, Case SM, McAllister-Lucas LM, Wang L, DiStefano PS, Nunez G, Bertin J, Lin X. A requirement for CARMA1 in TCR-induced NF-kappa B activation. Nat Immunol. 2002;3:830–835. doi: 10.1038/ni824. [DOI] [PubMed] [Google Scholar]
- 9.Harhaj EW, Good L, Xiao G, Uhlik M, Cvijic ME, Rivera-Walsh I, Sun SC. Somatic mutagenesis studies of NF-kappa B signaling in human T cells: evidence for an essential role of IKK gamma in NF-kappa B activation by T-cell costimulatory signals and HTLV-I Tax protein. Oncogene. 2000;19:1448–1456. doi: 10.1038/sj.onc.1203445. [DOI] [PubMed] [Google Scholar]
- 10.Rossman JS, Stoicheva NG, Langel FD, Patterson GH, Lippincott-Schwartz J, Schaefer BC. POLKADOTS are foci of functional interactions in T-Cell receptor-mediated signaling to NF-kappaB. Mol Biol Cell. 2006;17:2166–2176. doi: 10.1091/mbc.E05-10-0985. [DOI] [PMC free article] [PubMed] [Google Scholar]
- 11.Schaefer BC, Kappler JW, Kupfer A, Marrack P. Complex and dynamic redistribution of NF-{kappa}B signaling intermediates in response to T cell receptor stimulation. Proc Natl Acad Sci U S A. 2004;101:1004–1009. doi: 10.1073/pnas.0307858100. [DOI] [PMC free article] [PubMed] [Google Scholar]
- 12.Kingeter LM, Schaefer BC. Loss of protein kinase C theta, Bcl10, or Malt1selectively impairs proliferation and NF-kappa B activation in the CD4+ T cell subset. J Immunol. 2008;181:6244–6254. doi: 10.4049/jimmunol.181.9.6244. [DOI] [PMC free article] [PubMed] [Google Scholar]
- 13.Duwel M, Welteke V, Oeckinghaus A, Baens M, Kloo B, Ferch U, Darnay BG, Ruland J, Marynen P, Krappmann D. A20 negatively regulates T cell receptor signaling to NF-kappaB by cleaving Malt1 ubiquitin chains. J Immunol. 2009;182:7718–7728. doi: 10.4049/jimmunol.0803313. [DOI] [PubMed] [Google Scholar]
- 14.Oeckinghaus A, Wegener E, Welteke V, Ferch U, Arslan SC, Ruland J, Scheidereit C, Krappmann D. Malt1 ubiquitination triggers NF-kappaB signaling upon T-cell activation. Embo J. 2007;26:4634–4645. doi: 10.1038/sj.emboj.7601897. [DOI] [PMC free article] [PubMed] [Google Scholar]
- 15.Rudolph D, Yeh WC, Wakeham A, Rudolph B, Nallainathan D, Potter J, Elia AJ, Mak TW. Severe liver degeneration and lack of NF-kappaB activation in NEMO/IKKgamma-deficient mice. Genes Dev. 2000;14:854–862. [PMC free article] [PubMed] [Google Scholar]
- 16.Langel FD, Jain NA, Rossman JS, Kingeter LM, Kashyap AK, Schaefer BC. Multiple protein domains mediate interaction between Bcl10 and MALT1. J Biol Chem. 2008;283:32419–32431. doi: 10.1074/jbc.M800670200. [DOI] [PMC free article] [PubMed] [Google Scholar]
- 17.Vermeulen L, De Wilde G, Notebaert S, Vanden Berghe W, Haegeman G. Regulation of the transcriptional activity of the nuclear factor-kappaB p65 subunit. Biochem Pharmacol. 2002;64:963–970. doi: 10.1016/s0006-2952(02)01161-9. [DOI] [PubMed] [Google Scholar]
- 18.Tay S, Hughey JJ, Lee TK, Lipniacki T, Quake SR, Covert MW. Single-cell NF-kappaB dynamics reveal digital activation and analogue information processing. Nature. 2010;466:267–271. doi: 10.1038/nature09145. [DOI] [PMC free article] [PubMed] [Google Scholar]
Associated Data
This section collects any data citations, data availability statements, or supplementary materials included in this article.