

Abstract
BACKGROUND
Endometrial cancer (EC) is a common malignancy worldwide. It is often preceded by endometrial hyperplasia, whose management and risk of neoplastic progression vary. Previously, we have shown that the tetraspan protein Epithelial Membrane Protein-2 (EMP2) is a prognostic indicator for EC aggressiveness and survival. Here we validate the expression of EMP2 in EC, and further examine whether EMP2 expression within preneoplastic lesions is an early prognostic biomarker for EC development.
METHODS
A tissue microarray (TMA) was constructed with a wide representation of benign and malignant endometrial samples. The TMA contains a metachronous cohort of cases from individuals who either developed or did not develop EC. Intensity and frequency of EMP2 expression were assessed using immunohistochemistry.
RESULTS
There was a stepwise, statistically-significant increase in the average EMP2 expression from benign to hyperplasia to atypia to EC. Furthermore, detailed analysis of EMP2 expression in potentially premalignant cases demonstrated that EMP2 positivity was a strong predictor for EC development.
CONCLUSION
EMP2 is an early predictor of EC development in preneoplastic lesions. In addition, combined with our previous findings, these results validate that EMP2 as a novel biomarker for EC development.
Keywords: epithelial membrane protein-2, endometrial cancer, metachronous, tissue microarray, tumor biomarker
INTRODUCTION
Endometrial cancer (EC) is the most common gynecologic malignancy diagnosed among women in developed countries 1–4. The incidence of developing EC has steadily increased over the last 20 years, with nearly one out of every thirty-five women developing the disease over a lifetime 3, 5. Often, women initially present with hyperplastic lesions which are classified by the World Health Organization according to the severity of glandular crowding (simple versus complex hyperplasia) along with the presence or absence of nuclear atypia 6, 7. Currently, there is no reliable method to determine which hyperplasia will progress to cancer, due in part to the lack of reliable and consistent pathological indicators of hyperplastic subvariants 8–10. As such, consistently distinguishing low-risk hyperplastic lesions from higher-risk lesions can be difficult.
Conservative management of hyperplastic endometrium includes progesterone therapy along with regular follow-up 6, 11. However, serious side effects are associated with progesterone therapy, such as increased risk of atherogenesis, severe weight gain, and mood changes 12. Moreover, treatments need to be long-term or else lesions reappear and progress 6, 7, 13. While hysterectomy is usually indicated for women with atypical hyperplasia, the management of simple or complex hyperplasia lacks consensus 6, 7. Moreover, the incidence of both endometrial hyperplasia and EC in women of childbearing age creates additional challenges in diagnostic and therapeutic strategies 14, 15. Therefore, effective algorithms that identify the risk of EC development within hyperplastic endometrium would not only facilitate early cancer detection, but also guide proper and effective treatment.
The tetraspan protein, Epithelial Membrane Protein-2 (EMP2), has recently been identified as a biomarker which can help predict the probability of EC progression as well as patient survival. Multivariate analysis revealed that higher EMP2 expression levels were a predictor for more aggressive tumor behavior including higher stage and greater vascular invasion 16. EC with higher levels of EMP2 were also more likely to recur post-surgery and thus be more deadly 16.
EMP2 is involved in regulating plasma membrane localization and signaling of several classes of membrane receptors involved in cell-cell interaction or recognition of the extracellular milieu 17–21. For example, EMP2 levels alter the localization and surface expression of specific integrin isoforms modulating such diverse processes as αvβ3 integrin-mediated blastocyst implantation or β1 integrins-FAK-mediated extracellular matrix adhesion, contraction, and invasiveness 17, 18, 20. Notably, the centrality of these integrin-mediated functions in the malignant traits of neoplastic cells suggests a potential biologic basis for the association of EMP2 expression with aggressive endometrial cancer 17, 22.
The nexus of EMP2 expression with endometrial cancer raised the possibility that EMP2 might identify a subset of hyperplasic lesions destined for EC development. Accordingly, the present study was designed to 1) validate in an independent patient population, our previous findings associating EMP2 expression within a subsets of EC; and 2) to determine if EMP2 was an early predictive marker in hyperplastic lesions for EC development. To study this, we constructed a tissue microarray (TMA) from metachronous endometrial samples of 207 female patients (ages 30–85 at initial diagnosis) who were seen at the UCLA Medical Center. Significantly, this study confirms the association of EMP2 expression with aggressive EC. Moreover, it reveals that increased expression of EMP2 in hyperplastic endometrium is a strong prognostic indicator of future EC development.
MATERIALS AND METHODS
Endometrial Tissue Microarray
The tissue microarray (TMA) was constructed as previously described 16. Archival formalin fixed, paraffin embedded endometrial tissue samples were obtained from the Department of Pathology and Laboratory Medicine at the David Geffen School of Medicine at UCLA with Institutional Review Boards (IRB) approval. The TMA was designed to have a wide representation of histopathologies of the endometrium as well as to represent tissue samples from biopsies or hysterectomies from individuals over time ("metachronous") who either developed or did not develop EC. The metachronous progression TMA consisted of 535 surgical cases from 207 patients (Figure 1). The following describes the breakdown of patient cases on the TMA. Note that for each case, there were approximately 3 TMA spots from each histopathology (discussed below).
Figure 1. Inclusion and Exclusion Criteria for Patients Used in Disease Progression Studies.

The flowchart shows a breakdown of relevant patient populations used in the studies of EMP2 expression in disease progression. At each step, the number of patients and cases is shown. The bottom box shows the total patients and cases that were ultimately used that were EMP2-informative and met progression criteria as outlined in the Methods and Materials 6.
TMA Cases
Cases were selected from patients who underwent endometrial sampling through biopsy, curettage, and/or resection procedures from 1982 to 2002. The case histologies were: i) benign endometrium (n=231) (which consisted of a composite of atrophic, weakly proliferative, menstrual, proliferative, secretory, progestational effect due to hormone therapy, disordered proliferative, and polypoid endometrium); ii) simple hyperplasia (n=105); iii) complex hyperplasia (n=36); iv) simple atypical hyperplasia (n=10); v) complex atypical hyperplasia (n=44); and vi) primary endometrial adenocarcinoma (n=109). Hyperplasias with simple, complex, simple atypical, or complex atypical morphology are collectively referred to in this paper as "potential preneoplastic lesions". The adenocarcinomas were limited to endometrioid types as this represents the majority of Type I endometrial cancers 23, as well as related variants, including ciliated, secretory, papillary (villoglandular), adenoacanthoma, and adenosquamous. Tumor typing follows the WHO classification 24. In total the TMA contained 535 surgical cases from 207 patients. Of these, 46 patients had metachronous samples and had disease progression with >1 yr follow-up (Figure 1). Table 1 summarizes clinical variables and patient groups as well as EMP2 positive and negative samples in each subgroup. Table 1 also summarizes for each of the clinical variables, whether there is a statistically significant difference in EMP2 expression.
Table 1.
Clinical Variables and Patient Groups
| All Patients | EMP2 negative (% of Total) |
EMP2 positive (% of Total) |
P- Value |
|
|---|---|---|---|---|
| Total | 199 | 43 | 52 | |
| BMI (kg/m2) | 0.64 1 | |||
| Median (range) | 27 (16–63) | 27 (16–43) | 28 (19–57) | |
| Mean | 29 | 28 | 31 | |
| BMI <30 | 107 (62%) | 26 (63%) | 24 (52%) | |
| BMI ≥ 30 | 67 (39%) | 15 (37%) | 22 (48%) | |
| Ethnicity | 0.622 2 | |||
| Others | 55 (28%) | 8 (19%) | 12 (23%) | |
| Caucasian | 144 (72%) | 35 (81%) | 40 (77%) | |
| Age of 1st Biopsy (yr.) | 0.04 1 | |||
| Median (range) | 49 (30–85) | 49 (39–79) | 47 (30–85) | |
| Mean | 49 | 49 | 47 | |
| Age of EC Diagnosis (yr.) | 0.08 1 | |||
| Median (range) | 53 (30–86) | 67 (57–77) | 51 (31–86) | |
| Mean | 54 | 67 | 55 | |
| Number of women | 77 | 4 | 13 | |
| Follow-up Time (wk.) | 0.84 1 | |||
| Mean | 161 | 231 | 244 | |
| Median (range) | 113 (0.3–766) | 177 (54–610) | 209 (53–766) | |
| Smoking History | 0.36 2 | |||
| Yes | 65 (36%) | 15 (37%) | 12 (31%) | |
| No | 116 (64%) | 26 (63%) | 33 (69%) | |
| Gravidity | n = 183 | N = 39 | N = 47 | 0.59 1 |
| Median (range) | 2 | 2 | 2 | |
| Mean | 0–8 | 0–7 | 0–6 | |
| Parity | 0.9 1 | |||
| Median (range) | 1 (0–6) | 1 (0–5) | 1 (0–4) | |
| Mean | 1.5 | 1.4 | 1.4 | |
| 0–1 | 93 (51%) | 22 (55%) | 24 (51%) | |
| ≥2 | 91 (49%) | 18 (45%) | 23 (49%) | |
| Menopause (years) | 0.03 1 | |||
| Median (range) | 50 (31–63) | 51 (31–57) | 50 (33–56) | |
| Mean | 49 | 50 | 48 | |
| <48 years | 54 (30%) | 7 (18%) | 11 (25%) | |
| 48–52 years | 89 (49%) | 20 (53%) | 29 (64%) | |
| > 52 years | 37 (21%) | 11 (29%) | 5 (11%) | |
| Diabetes Mellitus | 0.61 2 | |||
| No | 141 (77%) | 34 (81%) | 34 (76%) | |
| Yes | 41 (23%) | 8 (19%) | 11 (24%) | |
Mann-Whitney;
Fisher's Exact
TMA spot histologies
Each relevant histology in a given case was typically represented by 3 cores (or spots) on the TMA with a diameter of 1.0 mm.. Therefore, the total number of spots/cores in the TMA was 2,025. The spot histologies of the endometrial array were assigned based on a review of the H & E slides and pathology reports. The per spot breakdown by core histology includes: benign (927); simple hyperplasia (348); complex hyperplasia (126); simple atypical hyperplasia (70); complex atypical hyperplasia (216); and primary endometrial adenocarcinoma (338).
Disease progression cases
The TMA was also designed to include tissue samples for disease progression. In this regard, 75% percent of these patients (150) had multiple, metachronous samples, taken over time giving a total of 457 cases. Figure 1 summarizes the criteria for inclusion or exclusion for the studies of disease progression. Patients were excluded for the following reasons: i) if they ultimately developed a non-endometriod carcinoma in follow-up; ii) if they had no follow-up tissue after the initial sample collection; and iii) if their only follow-up time point was < 1 year after the initial sample acquisition. Cases were also excluded if during array construction the appropriate histopathology was not accurately covered (n=50). In addition, spots were excluded is they became physically dislodged, were completely depleted from the TMA block, or if after sectioning, they no longer contained relevant cell types (i.e., epithelium or tumor; 5 cases). In Figure 1 these categories are referred to as being excluded due to "lack of EMP2 informative information" from the TMA. Disease progression criteria has previously been defined 6, 25. In particular, Lacey et al. described the high risk of carcinoma development in women who have atypical hyperplasia (AH), in contrast to non-atypical hyperplasias 6, 25. Thus, disease progression was considered to be development of endometrial carcinoma or AH.
Immunohistochemistry
The TMA was stained with human EMP2 antisera or a preimmune control as previously described 16. Briefly, for antigen retrieval, sections were incubated at 95°C for 20 minutes in 0.1 M citrate, pH 6.0. EMP2 was detected using a primary polyclonal rabbit anti-human polyclonal EMP2 antiserum at a dilution of 1:400 16 followed by visualization using the Vector ABC kit (Vector Labs, Burlingame, CA) according to the manufacturer’s instructions. Negative controls included the corresponding amount of preimmune sera. Specificity of this reagent is well established as previously described and has been shown to be titratable, inhibitable by EMP2 protein or peptide, reactive against tissue or cells shown to express EMP2 by Western blot or RT-PCR, and not be reactive against tissues or cells shown not to expression EMP2 by Western blot or RT-PCR 16–19, 26. We conducted a semi-quantitative analysis of the EMP2-stained endometrial progression TMA by a pathologist (R.A.S.), who was blinded to clinical information. A second pathologist (O.H.) spot checked the data. The percentage of cells with staining intensities of 0 to 3 (0 = below the level of detection, 1 = weak, 2 = moderate, 3 = strong) was scored.
Western Blot Analysis
Frozen tissue samples of surgically removed specimens were obtained from the UCLA Department of Pathology and Laboratory Medicine under Institutional Review Board (IRB) approval. Endometrial samples had histologies of either normal (proliferative endometrium), hyperplasia (1 sample simple hyperplasia, 1 sample complex hyperplasia), or carcinoma. Tissue samples were homogeneized and resuspended in Laemmli buffer. Samples were treated for 2 h at 37°C with PNGase (New England Biolabs, Beverly, MA) to remove N-linked glycans 17. Proteins were separated by SDS–PAGE and transferred to a nitrocellulose membrane (Amersham Pharmacia, Piscataway, NJ). Membranes were blocked with 10% low-fat milk in PBS + 0.1% Tween-20 and probed with anti-human EMP2 antisera. Protein bands were visualized using an anti-rabbit horseradish-peroxidase-labeled secondary antibody (Southern Biotechnology Associates, Birmingham, AL) followed by enhanced chemiluminescence (ECL) detection reagents (Amersham-Pharmacia, Piscataway, NJ).
Statistical Analysis
Statistical analyses were performed as previously described using R (http://www.R-project.org) and StatView software (Adept Scientific, Acton, MA) 27–29 (S.H.). To examine the differences in EMP2 expression between different histologies, the Kruskal-Wallis test and Spearman correlation were used. The Mann-Whitney U test was utilized to examine differences in EMP2 expression related to tumor development for each histology, as well as to compare continuous, clinical variables to levels of EMP2 expression. In order to arrive at a single expression value across multiple, informative spots within each histology of each case, the mean pooled value for EMP2 was calculated. Pooling criteria for case-based analyses was previously described 27–29. The dependence between categorical variables was tested using the Fisher's exact test. Curves estimating the probability of remaining cancer-free were generated using the Kaplan-Meier method, and comparisons were made by using the log-rank test. Hazard ratios and prognostic significance were estimated using the Cox proportional hazards model. Positive EMP2 expression was defined as being larger than 0. For all results, P ≤ 0.05 was considered significant.
RESULTS
Using an independent TMA patient population, our goals for this present study were to confirm and extend our previously reported association of elevated EMP2 expression with EC 16 and to extend these finding to determine whether EMP2 was a early biomarker for EC development and/or progression. Accordingly, we constructed a disease progression (metachronous) TMA that contained surgical cases from 207 patients of which 199 patients fulfilled study criteria (see Materials and Methods and Figure 1).
The cellular and histological expression pattern for EMP2 was identical to those previously observed 16, with representative images shown in Figure 2. Consistent with earlier studies, EMP2 is typically expressed in the cytoplasm and/or at the plasma membrane of the epithelium. In addition, for benign tissue, we observed that EMP2 expression was slightly, yet significantly higher in secretory phase (0.31±0.04) versus proliferative phase (0.20±0.03) (P=0.010). We next semi-quantitated EMP2 expression for each spot on the TMA and compared these values for each histology. As shown in Figure 3A, on a per-spot basis there was a step-wise increase in relative EMP2 expression from benign to hyperplasia to atypical hyperplasia, to EC. This trend was maintained when the spot data were pooled to establish a case-level expression index (Figure 3B). As validation, similar results were observed when EMP2 protein was detected by Western blot analysis from freshly obtained surgically resected tissue samples obtained from the UCLA Department of Pathology and Laboratory Medicine. Representative samples are shown in Figure 3C and display an increased expression of EMP2 in EC compared to morphologically normal or hyperplastic tissue. Importantly, these results are consistent with our previous findings using an independent patient population at the Memorial Sloan-Kettering Cancer Center 16.
Figure 2. EMP2 Expression in Endometrial Tissue.
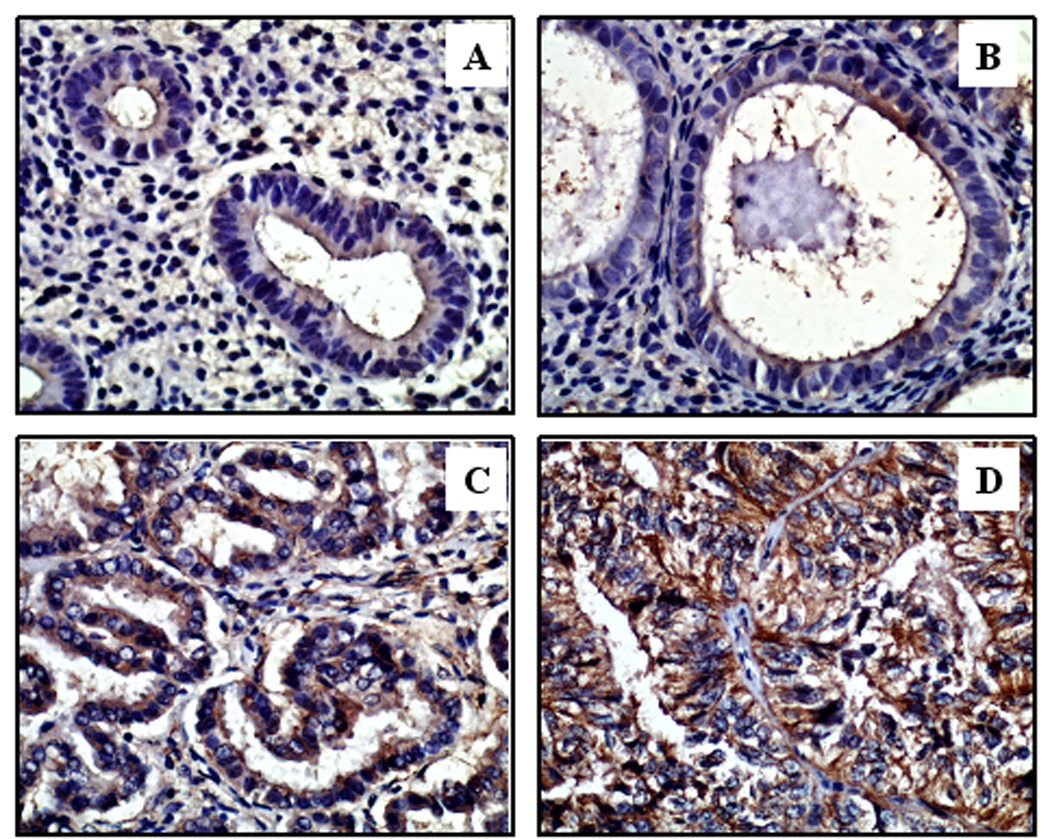
Representative immunohistochemical staining of endometrial tissue samples is shown in panels A through D. Samples were assigned a score between 0–3, with 3 being the highest EMP2 intensity and 0 being below the level of detection. EMP2 staining is predominantly in the cytoplasm or membrane. (A) EMP2 expression is below the level of detection (score of 0) in benign proliferative endometrium and (B) relatively weak in simple hyperplastic endometrium. (C) EMP2 expression was more intense in complex hyperplasia with atypia. (D) The highest expression was observed in adenocarcinoma. Epithelium in this image predominantly stained at a level 3. All images are 400×.
Figure 3. EMP2 expression stratified by histology.

(A) EMP2 expression distribution as classified by spot-level histologies (Kruskal-Wallis P<0.0001 across all histologies; Mann-Whitney P-values: benign versus complex hyperplasia, atypical hyperplasia or endometrial cancer, P < 0.0001; endometrial cancer versus all hyperplasias, P< 0.0001; simple hyperplasia versus atpical and complex hyperplasia, P < 0.0001 and P = 0.005, respectively). (B) EMP2 expression distribution as classified by case-level histologies. "Hyperplasia" refers to both simple and complex variants (Kruskal-Wallis P<0.0001 across all histologies; Spearman correlation = 0.480, P<0.0001; Mann-Whitney P-values: benign versus hyperplasia, atypical hyperplasia or endometrial cancer, P < 0.0001; endometrial cancer versus all hyperplasias, P<0.0001; hyperplasia versus atpical hyperplasia P = 0.014). (C) Western blot analysis of EMP2 expression in endometrial tissue. Human tissue samples obtained from the UCLA Department of Pathology and Laboratory Medicine were processed and electrophoresed as described in the Materials and Methods. Immunoblots were probed with a rabbit anti-human EMP2 antibody or with an anti-human β-actin antibody. (D) EMP2 expression distribution by case-level histologies in patients who do (+) or do not (−) develop endometrial cancer after at least one year follow-up. For all graphs, columns, means; bars, SEM; numbers in the bar, number of spots (A) or cases (B, D). Although the trend is consistent that EMP2 expression is higher in patients who ultimately do develop endometrial cancer versus those who do not, the Mann-Whitney P values do not reach statistical significance.
However, despite this general trend, there was some degree of heterogeneity of EMP2 expression in each histological group; some individuals displayed higher EMP2 levels while there was no detectable EMP2 in others. We therefore examined whether EMP2 expression in benign or potentially preneoplastic lesions provided information regarding future tumor development. To start addressing this issue, we considered EMP2 expression in TMA samples from metachronous individuals (i.e., those who had had multiple surgical visits to the UCLA Medical Center). Included were samples of benign endometrium (including secretory, proliferative, and menstrual), potential preneoplastic lesions (simple, complex, and atypical hyperplasia), and malignant endometrium. We considered patients who had an initial diagnosis of benign or potentially pre-neoplastic lesions, who then subsequently did or did not develop EC. As shown in Figure 3D, there was a striking, although not significant increase in EMP2 expression in potentially pre-neoplastic lesions in patients who ultimately developed EC after ≥ 1 year compared to those who did not develop malignancy. In contrast, the EMP2 level in benign tissue did not correlate with tumor development (Figure 3D).
Based on these results, we considered in more detail the EMP2 expression in potentially preneoplastic lesions in patients from whom there was available endometrial tissue with at least 1 year follow-up. We dichotomized the population into those who had EMP2-positive lesions versus those that had no detectable EMP2 ("EMP2-negative"). Significantly, if EMP2 was positive in the potentially preneoplastic lesion, there was a much greater probability of endometrial cancer development than if EMP2 was negative (Figure 4; P = 0.05). This trend also held when EMP2 was analyzed as a continuous variable (Hazard ratio = 3.64, 95% CI 1.16–11.4, P = 0.03). Therefore, based on these results, EMP2 expression appeared to be an early predictor of EC development. Interestingly, EMP2 positivity was significantly, albeit slightly, associated with the age of the patient at the time of first biopsy, and its expression associated with an early onset of menopause (Table 1). Additional studies will be needed to examine whether assessment of EMP2 expression levels will be most valuable in relatively younger individuals. No other clinical variables considered associated with EMP2 expression levels (Table 1).
Figure 4. EMP2 Expression Levels in Hyperplastic Lesions Predict Future Tumor Development.

Kaplan-Meier survival plot showing ○ positive EMP2 expression (n=26) versus expression which is ● negative or below the level of detection (n=20) in hyperplastic lesions. The breakdown of histologies for the positive EMP2 group was 16 simple hyperplasia, 6 complex hyperplasia, and 4 hyperplasia with atypia. The breakdown for the EMP2 negative group was 18 simple hyperplasia, 2 complex hyperplasia, and no hyperplasia with atypia. Note that women with positive EMP2 expression in potentially preneoplastic lesions have a greater probability of developing EC compared to similar lesions in which EMP2 cannot be detected (P = 0.05). Similar results were obtained when comparing EMP2 expression as a continuous variable to EC development (HR = 3.64, 95% CI 1.16–11.4, P = 0.03).
An interesting, yet potentially complicating variable in the study was the prevalent use of hormones (progestin alone and/or estrogen + progesterone) in approximately 84% of the individuals studied. However, the presence or absence of hormone supplements or therapy showed no apparent correlation with EMP2 levels or the predictive strength of EMP2 positivity for EC development. Specifically, 15 patients had received progesterone only, 23 had received progesterone plus estrogen, 2 had had estrogen alone, and 7 individuals had received no therapy or tamoxifen. Of the 38 women on progesterone alone or estrogen + progesterone, 21 women had positive expression of EMP2 (i.e., increased risk of tumor formation) and 17 were EMP2 negative (i.e., no increased risk of tumor formation). There was no statistical difference between these groups. Furthermore, the widespread use of hormone therapy within this patient population confounded the predictive ability of clinical variables (i.e., ER, PR) commonly associated with endometrial cancer (Table 1).
DISCUSSION
In this study, we have identified EMP2 as an early marker for EC development. The increased EMP2 expression in EC observed in an earlier TMA was validated using an independent patient cohort 16. Moreover, our results showed that EMP2 positivity within lesions that are potentially preneoplastic (i.e., simple, complex and atypical hyperplasias) strongly predicts the future development of EC.
The importance of identifying potential early detection markers for EC cannot be overemphasized. EC is the most common gynecologic malignancy in the United States and other developed countries 1–4. Although survival for this disease is increasingly more common, current treatment or surgical options can be severe, particularly for women of childbearing age. Moreover, the WHO classification of endometrial hyperplasia, complicated by the lack of inter-observer reproducibility, provides only a limited ability to discern which hyperplastic lesions will undergo malignant progression 7–9. Attempts have been made to devise algorithms based on histology and other clinical parameters to define which lesions will progress, but such strategies are only effective with atypical hyperplasia 6. Furthermore, although several studies have suggested that the PTEN/AKT pathway may play a role in endometrial cancer progression 25, 30, to date there are no molecular biomarkers which can consistently predict the tumor potential in hyperplastic endometrium 25, 31. Therefore, EMP2 holds promise as the first predictor of tumor development in preneoplastic endometrium. Presently, we are expanding these studies to encompass a larger-scale population trial to further assess the clinical utility of EMP2 expression.
Whether or not EMP2 plays a causal role in the transition of hyperplasia to malignancy, or in the pathogenesis of EC, remains to be determined. Nevertheless, what is known about the cell biology of EMP2 provides a conceptual framework in which to formulate a mechanistic role. EMP2 is thought to regulate the transport of specific proteins 17, 18, 21. The cohort of proteins with which EMP2 interacts or regulates in this fashion appears to be tissue-specific, but frequently involves one or more integrin family members 17, 18, 21. In the endometrium, EMP2 associates with both integrin αvβ3 and focal adhesion kinase (FAK), and can regulate αvβ3 integrin expression and localization. Given the importance of integrins and FAK in adhesion, proliferation, and migration 32, 33, dysregulation of EMP2 is predicted to have profound cellular consequences. For example, there is extensive evidence that integrin clustering and FAK activation can activate ERK/MAP kinase and AKT pathways, while downregulating p53 mediated apoptosis 32–34. In epithelial cells, β3 integrin activation directly leads to Src and FAK phosphorylation, resulting in stable focal adhesions 35, 36. Analysis of EMP2-β3 integrin-FAK association suggests that in the endometrium, EMP2 expression appears to promote FAK and Src phosphorylation (data not shown). We therefore hypothesize that EMP2 may help to stabilize or promote integrin-FAK-Src complexes. We are currently examining the consequences of αvβ3 integrin, FAK and EMP2 association in both cell culture and TMA platform systems. It is interesting to note that both FAK and Src phosphorylation have been implicated in endometrial cancer invasion 37, 38.
In conclusion, the results from this and prior studies point to the potential of EMP2 as not only an indicator of EC progression, but also as an early detection marker in preneoplastic lesions. Therefore, these results strongly suggest that EMP2 has a potential utility in the early diagnosis of EC. Whether EMP2 or associated genes such as FAK or Src might provide beneficial therapeutic targets remains an interesting possibility.
Acknowledgments
Sources of Support: This work was supported in part by: NIH grants T32 CA 009056-32 (OH), HD48540 (JB), CA009120 (MW), the Early Detection Research Network NCI CA-86366 (LG), Iris Cantor Seed Grant (MW), and the UCLA Jonsson Comprehensive Cancer Center (JB).
Abbreviations
- EMP2
epithelial membrane protein 2
- EC
endometrial cancer
- TMA
Tissue Microarray
Footnotes
There are no conflicts of interest or financial disclosures from any authors.
REFERENCES
- 1.Whitcomb BP. Gynecologic malignancies. Surg Clin North Am. 2008;88(2):301–317. vi. doi: 10.1016/j.suc.2008.01.004. Available from http://www.ncbi.nlm.nih.gov/entrez/query.fcgi?cmd=Retrieve&db=PubMed&dopt=Citation&list_uids=18381115. [DOI] [PubMed] [Google Scholar]
- 2.Jemal A, Siegel R, Ward E, Murray T, Xu J, Thun MJ. Cancer statistics, 2007. CA Cancer J Clin. 2007;57(1):43–66. doi: 10.3322/canjclin.57.1.43. Available from http://www.ncbi.nlm.nih.gov/entrez/query.fcgi?cmd=Retrieve&db=PubMed&dopt=Citation&list_uids=17237035. [DOI] [PubMed] [Google Scholar]
- 3.Creasman WT, Odicino F, Maisonneuve P, Beller U, Benedet JL, Heintz AP, et al. Carcinoma of the corpus uteri. J Epidemiol Biostat. 2001;6(1):47–86. Available from http://www.ncbi.nlm.nih.gov/entrez/query.fcgi?cmd=Retrieve&db=PubMed&dopt=Citation&list_uids=11385776. [PubMed] [Google Scholar]
- 4.Silverberg SG, Mutter GL, Kurman RJ, Kubik-Huch RA, Nogales F, Tavassoli FA. Tumors of the uterine corpus: epithelial tumors and related lesions. In: Tavassoli FA, MR S, editors. WHO Classification of Tumors: Pathology and Genetics of Tumors of the Breast and Female Genital Organs. Lyon: IARC Press; 2003. pp. 221–232. [Google Scholar]
- 5.Denschlag D, Tan L, Patel S, Kerim-Dikeni A, Souhami L, Gilbert L. Stage III endometrial cancer: preoperative predictability, prognostic factors, and treatment outcome. Am J Obstet Gynecol. 2007;196(6):546 e1–546 e7. doi: 10.1016/j.ajog.2007.01.018. Available from http://www.ncbi.nlm.nih.gov/entrez/query.fcgi?cmd=Retrieve&db=PubMed&dopt=Citation&list_uids=17547889. [DOI] [PubMed] [Google Scholar]
- 6.Lacey JV, Jr, Ioffe OB, Ronnett BM, Rush BB, Richesson DA, Chatterjee N, et al. Endometrial carcinoma risk among women diagnosed with endometrial hyperplasia: the 34-year experience in a large health plan. Br J Cancer. 2008;98(1):45–53. doi: 10.1038/sj.bjc.6604102. Available from http://www.ncbi.nlm.nih.gov/entrez/query.fcgi?cmd=Retrieve&db=PubMed&dopt=Citation&list_uids=18026193. [DOI] [PMC free article] [PubMed] [Google Scholar]
- 7.Espindola D, Kennedy KA, Fischer EG. Management of abnormal uterine bleeding and the pathology of endometrial hyperplasia. Obstet Gynecol Clin North Am. 2007;34(4):717–737. ix. doi: 10.1016/j.ogc.2007.09.001. Available from http://www.ncbi.nlm.nih.gov/entrez/query.fcgi?cmd=Retrieve&db=PubMed&dopt=Citation&list_uids=18061866. [DOI] [PubMed] [Google Scholar]
- 8.Sherman ME, Ronnett BM, Ioffe OB, Richesson DA, Rush BB, Glass AG, et al. Reproducibility of biopsy diagnoses of endometrial hyperplasia: evidence supporting a simplified classification. Int J Gynecol Pathol. 2008;27(3):318–325. doi: 10.1097/PGP.0b013e3181659167. Available from http://www.ncbi.nlm.nih.gov/entrez/query.fcgi?cmd=Retrieve&db=PubMed&dopt=Citation&list_uids=18580308. [DOI] [PubMed] [Google Scholar]
- 9.Zaino RJ, Kauderer J, Trimble CL, Silverberg SG, Curtin JP, Lim PC, et al. Reproducibility of the diagnosis of atypical endometrial hyperplasia: a Gynecologic Oncology Group study. Cancer. 2006;106(4):804–811. doi: 10.1002/cncr.21649. [DOI] [PubMed] [Google Scholar]
- 10.Allison KH, Reed SD, Voigt LF, Jordan CD, Newton KM, Garcia RL. Diagnosing endometrial hyperplasia: why is it so difficult to agree? Am J Surg Pathol. 2008;32(5):691–698. doi: 10.1097/PAS.0b013e318159a2a0. Available from http://www.ncbi.nlm.nih.gov/entrez/query.fcgi?cmd=Retrieve&db=PubMed&dopt=Citation&list_uids=18347507. [DOI] [PMC free article] [PubMed] [Google Scholar]
- 11.Marsden DE, Hacker NF. Optimal management of endometrial hyperplasia. Best Pract Res Clin Obstet Gynaecol. 2001;15(3):393–405. doi: 10.1053/beog.2000.0184. Available from http://www.ncbi.nlm.nih.gov/entrez/query.fcgi?cmd=Retrieve&db=PubMed&dopt=Citation&list_uids=11476561. [DOI] [PubMed] [Google Scholar]
- 12.Jadoul P, Donnez J. Conservative treatment may be beneficial for young women with atypical endometrial hyperplasia or endometrial adenocarcinoma. Fertil Steril. 2003;80(6):1315–1324. doi: 10.1016/s0015-0282(03)01183-x. [DOI] [PubMed] [Google Scholar]
- 13.Fiorelli JL, Herzog TJ, Wright JD. Current treatment strategies for endometrial cancer. Expert Rev Anticancer Ther. 2008;8(7):1149–1157. doi: 10.1586/14737140.8.7.1149. Available from http://www.ncbi.nlm.nih.gov/entrez/query.fcgi?cmd=Retrieve&db=PubMed&dopt=Citation&list_uids=18588459. [DOI] [PubMed] [Google Scholar]
- 14.Ushijima K, Yahata H, Yoshikawa H, Konishi I, Yasugi T, Saito T, et al. Multicenter phase II study of fertility-sparing treatment with medroxyprogesterone acetate for endometrial carcinoma and atypical hyperplasia in young women. J Clin Oncol. 2007;25(19):2798–2803. doi: 10.1200/JCO.2006.08.8344. [DOI] [PubMed] [Google Scholar]
- 15.Niwa K, Tagami K, Lian Z, Onogi K, Mori H, Tamaya T. Outcome of fertility-preserving treatment in young women with endometrial carcinomas. BJOG. 2005;112(3):317–320. doi: 10.1111/j.1471-0528.2004.00398.x. [DOI] [PubMed] [Google Scholar]
- 16.Wadehra M, Natarajan S, Seligson DB, Williams CJ, Hummer AJ, Hedvat C, et al. Expression of epithelial membrane protein-2 is associated with endometrial adenocarcinoma of unfavorable outcome. Cancer. 2006;107(1):90–98. doi: 10.1002/cncr.21957. Available from http://www.ncbi.nlm.nih.gov/entrez/query.fcgi?cmd=Retrieve&db=PubMed&dopt=Citation&list_uids=16736513. [DOI] [PubMed] [Google Scholar]
- 17.Wadehra M, Iyer R, Goodglick L, Braun J. The tetraspan protein epithelial membrane protein-2 interacts with beta1 integrins and regulates adhesion. J Biol Chem. 2002;277(43):41094–41100. doi: 10.1074/jbc.M206868200. Available from http://www.ncbi.nlm.nih.gov/entrez/query.fcgi?cmd=Retrieve&db=PubMed&dopt=Citation&list_uids=12189152. [DOI] [PubMed] [Google Scholar]
- 18.Wadehra M, Forbes A, Pushkarna N, Goodglick L, Gordon LK, Williams CJ, et al. Epithelial membrane protein-2 regulates surface expression of alphavbeta3 integrin in the endometrium. Dev Biol. 2005;287(2):336–345. doi: 10.1016/j.ydbio.2005.09.003. Available from http://www.ncbi.nlm.nih.gov/entrez/query.fcgi?cmd=Retrieve&db=PubMed&dopt=Citation&list_uids=16216233. [DOI] [PubMed] [Google Scholar]
- 19.Wadehra M, Goodglick L, Braun J. The tetraspan protein EMP2 modulates the surface expression of caveolins and glycosylphosphatidyl inositol-linked proteins. Mol Biol Cell. 2004;15(5):2073–2083. doi: 10.1091/mbc.E03-07-0488. Available from http://www.ncbi.nlm.nih.gov/entrez/query.fcgi?cmd=Retrieve&db=PubMed&dopt=Citation&list_uids=14978215. [DOI] [PMC free article] [PubMed] [Google Scholar]
- 20.Wadehra M, Dayal M, Mainigi M, Ord T, Iyer R, Braun J, et al. Knockdown of the tetraspan protein epithelial membrane protein-2 inhibits implantation in the mouse. Dev Biol. 2006;292(2):430–441. doi: 10.1016/j.ydbio.2006.01.015. Available from http://www.ncbi.nlm.nih.gov/entrez/query.fcgi?cmd=Retrieve&db=PubMed&dopt=Citation&list_uids=16487956. [DOI] [PubMed] [Google Scholar]
- 21.Morales SA, Mareninov S, Wadehra M, Zhang L, Goodglick L, Braun J, et al. Epithelial Membrane Protein 2 (EMP2) Controls Collagen Gel Contraction in ARPE-19 Cells by Modulating FAK Activation. Invest Ophthalmol Vis Sci. 2008 doi: 10.1167/iovs.07-1598. Available from http://www.ncbi.nlm.nih.gov/entrez/query.fcgi?cmd=Retrieve&db=PubMed&dopt=Citation&list_uids=18469192. [DOI] [PMC free article] [PubMed] [Google Scholar]
- 22.Hynes RO. Integrins: bidirectional, allosteric signaling machines. Cell. 2002;110(6):673–687. doi: 10.1016/s0092-8674(02)00971-6. Available from http://www.ncbi.nlm.nih.gov/entrez/query.fcgi?cmd=Retrieve&db=PubMed&dopt=Citation&list_uids=12297042. [DOI] [PubMed] [Google Scholar]
- 23.Zivanovic O, Carter J, Kauff ND, Barakat RR. A review of the challenges faced in the conservative treatment of young women with endometrial carcinoma and risk of ovarian cancer. Gynecol Oncol. 2009;115(3):504–509. doi: 10.1016/j.ygyno.2009.08.011. [DOI] [PubMed] [Google Scholar]
- 24.Greene FL, Page DL, Fleming ID, Fritz A, Balch CM, Haller DG, et al. AJCC Cancer Staging Manual. ed. 6th. New York: Springer; 2002. [Google Scholar]
- 25.Lacey JV, Jr, Mutter GL, Ronnett BM, Ioffe OB, Duggan MA, Rush BB, et al. PTEN expression in endometrial biopsies as a marker of progression to endometrial carcinoma. Cancer Res. 2008;68(14):6014–6020. doi: 10.1158/0008-5472.CAN-08-1154. Available from http://www.ncbi.nlm.nih.gov/entrez/query.fcgi?cmd=Retrieve&db=PubMed&dopt=Citation&list_uids=18632658. [DOI] [PMC free article] [PubMed] [Google Scholar]
- 26.Wadehra M, Sulur GG, Braun J, Gordon LK, Goodglick L. Epithelial membrane protein-2 is expressed in discrete anatomical regions of the eye. Exp Mol Pathol. 2003;74(2):106–112. doi: 10.1016/s0014-4800(03)00009-1. Available from http://www.ncbi.nlm.nih.gov/entrez/query.fcgi?cmd=Retrieve&db=PubMed&dopt=Citation&list_uids=12710941. [DOI] [PubMed] [Google Scholar]
- 27.Mah V, Seligson DB, Li A, Marquez DC, Wistuba II, Elshimali Y, et al. Aromatase expression predicts survival in women with early-stage non small cell lung cancer. Cancer Res. 2007;67(21):10484–10490. doi: 10.1158/0008-5472.CAN-07-2607. Available from http://www.ncbi.nlm.nih.gov/entrez/query.fcgi?cmd=Retrieve&db=PubMed&dopt=Citation&list_uids=17974992. [DOI] [PMC free article] [PubMed] [Google Scholar]
- 28.Seligson DB, Horvath S, Shi T, Yu H, Tze S, Grunstein M, et al. Global histone modification patterns predict risk of prostate cancer recurrence. Nature. 2005;435(7046):1262–1266. doi: 10.1038/nature03672. Available from http://www.ncbi.nlm.nih.gov/entrez/query.fcgi?cmd=Retrieve&db=PubMed&dopt=Citation&list_uids=15988529. [DOI] [PubMed] [Google Scholar]
- 29.Freedland SJ, Seligson DB, Liu AY, Pantuck AJ, Paik SH, Horvath S, et al. Loss of CD10 (neutral endopeptidase) is a frequent and early event in human prostate cancer. Prostate. 2003;55(1):71–80. doi: 10.1002/pros.10202. Available from http://www.ncbi.nlm.nih.gov/entrez/query.fcgi?cmd=Retrieve&db=PubMed&dopt=Citation&list_uids=12640663. [DOI] [PubMed] [Google Scholar]
- 30.Bansal N, Yendluri V, Wenham RM. The molecular biology of endometrial cancers and the implications for pathogenesis, classification, and targeted therapies. Cancer Control. 2009;16(1):8–13. doi: 10.1177/107327480901600102. Available from http://www.ncbi.nlm.nih.gov/entrez/query.fcgi?cmd=Retrieve&db=PubMed&dopt=Citation&list_uids=19078924. [DOI] [PubMed] [Google Scholar]
- 31.Allison KH, Tenpenny E, Reed SD, Swisher EM, Garica RL. Immunohistochemical markers in endometrial hyperplasia: is there a panel with promise? A review. Appl Immunohistochem Mol Morphol. 2008;16(4):329–343. doi: 10.1097/PAI.0b013e318159b88e. Available from http://www.ncbi.nlm.nih.gov/entrez/query.fcgi?cmd=Retrieve&db=PubMed&dopt=Citation&list_uids=18528284. [DOI] [PubMed] [Google Scholar]
- 32.Hehlgans S, Haase M, Cordes N. Signalling via integrins: implications for cell survival and anticancer strategies. Biochim Biophys Acta. 2007;1775(1):163–180. doi: 10.1016/j.bbcan.2006.09.001. Available from http://www.ncbi.nlm.nih.gov/entrez/query.fcgi?cmd=Retrieve&db=PubMed&dopt=Citation&list_uids=17084981. [DOI] [PubMed] [Google Scholar]
- 33.Mitra SK, Schlaepfer DD. Integrin-regulated FAK-Src signaling in normal and cancer cells. Curr Opin Cell Biol. 2006;18(5):516–523. doi: 10.1016/j.ceb.2006.08.011. Available from http://www.ncbi.nlm.nih.gov/entrez/query.fcgi?cmd=Retrieve&db=PubMed&dopt=Citation&list_uids=16919435. [DOI] [PubMed] [Google Scholar]
- 34.Polte TR, Hanks SK. Complexes of focal adhesion kinase (FAK) and Crk-associated substrate (p130(Cas)) are elevated in cytoskeleton-associated fractions following adhesion and Src transformation. Requirements for Src kinase activity and FAK proline-rich motifs. J Biol Chem. 1997;272(9):5501–5509. doi: 10.1074/jbc.272.9.5501. Available from http://www.ncbi.nlm.nih.gov/entrez/query.fcgi?cmd=Retrieve&db=PubMed&dopt=Citation&list_uids=9038154. [DOI] [PubMed] [Google Scholar]
- 35.Berditchevski F, Odintsova E. Characterization of integrin-tetraspanin adhesion complexes: role of tetraspanins in integrin signaling. J Cell Biol. 1999;146(2):477–492. doi: 10.1083/jcb.146.2.477. Available from http://www.ncbi.nlm.nih.gov/entrez/query.fcgi?cmd=Retrieve&db=PubMed&dopt=Citation&list_uids=10427099. [DOI] [PMC free article] [PubMed] [Google Scholar]
- 36.Kawaguchi T, Yamashita Y, Kanamori M, Endersby R, Bankiewicz KS, Baker SJ, et al. The PTEN/Akt pathway dictates the direct alphaVbeta3-dependent growth-inhibitory action of an active fragment of tumstatin in glioma cells in vitro and in vivo. Cancer Res. 2006;66(23):11331–11340. doi: 10.1158/0008-5472.CAN-06-1540. Available from http://www.ncbi.nlm.nih.gov/entrez/query.fcgi?cmd=Retrieve&db=PubMed&dopt=Citation&list_uids=17145879. [DOI] [PubMed] [Google Scholar]
- 37.Acconcia F, Barnes CJ, Kumar R. Estrogen and tamoxifen induce cytoskeletal remodeling and migration in endometrial cancer cells. Endocrinology. 2006;147(3):1203–1212. doi: 10.1210/en.2005-1293. Available from http://www.ncbi.nlm.nih.gov/entrez/query.fcgi?cmd=Retrieve&db=PubMed&dopt=Citation&list_uids=16339197. [DOI] [PubMed] [Google Scholar]
- 38.Livasy CA, Moore D, Cance WG, Lininger RA. Focal adhesion kinase overexpression in endometrial neoplasia. Appl Immunohistochem Mol Morphol. 2004;12(4):342–345. doi: 10.1097/00129039-200412000-00009. Available from http://www.ncbi.nlm.nih.gov/entrez/query.fcgi?cmd=Retrieve&db=PubMed&dopt=Citation&list_uids=15536334. [DOI] [PubMed] [Google Scholar]