Abstract
The plasma profile of subjects with non-alcoholic fatty liver disease (NAFLD), steatosis and steatohepatitis (NASH), was examined using an untargeted global metabolomic analysis in order to identify specific disease-related pattern/s and to identify potential non-invasive biomarkers. Plasma samples were obtained after an overnight fast from histologically confirmed non-diabetic subjects with hepatic steatosis (N=11) or NASH (N=24), and compared with healthy, age and sex-matched controls (n=25). Subjects with NAFLD were obese, were insulin resistant and had higher plasma concentration of homocysteine and total cysteine and lower plasma concentrations of total glutathione. Metabolomic analysis showed markedly higher levels of glycocholate, taurocholate and glycochenodeoxycholate in subjects with NAFLD. Plasma concentrations of long chain fatty acids were lower and concentrations of free carnitine, butyrylcarnitine and methylbutyryl carnitine were higher in NASH. Several glutamyl dipeptides were higher, while cysteine-glutathione levels were lower in NASH and steatosis. Other changes included higher branched chain amino acids, phosphocholine, carbohydrates (glucose, mannose), lactate, pyruvate, and several unknown metabolites. Random forest analysis and recursive partitioning of the metabolomic data could separate healthy subjects from NAFLD with an error rate of ~8%, and NASH from healthy controls with an error rate of 4%. Hepatic steatosis and steatohepatitis could not be separated using the metabolomic profile.
Conclusion
Plasma metabolomic analysis revealed marked changes in bile salts and in biochemicals related to glutathione in subjects with non-alcoholic fatty liver disease. Statistical analysis identified a panel of biomarkers that could effectively separate healthy controls from NAFLD and healthy controls from NASH. These biomarkers can potentially be used to follow response to therapeutic interventions.
Keywords: Metabolomics, Non alcoholic steatohepatitis, Bile acids, Oxidative stress, Glutathione, Amino acids
Introduction
Non alcoholic fatty liver disease (NAFLD) is a spectrum metabolic abnormalities ranging from a simple accumulation of triglycerides in the hepatocytes (hepatic steatosis), to hepatic steatosis with inflammation (steatohepatitis), fibrosis and cirrhosis (1,2). Although hepatic steatosis is related to a number of clinical disorders and has been studied in several different animal models, NAFLD in humans is characterized by obesity, insulin resistance and associated metabolic perturbations (1,2). Data from studies in humans and animal models have suggested a paradigm for the pathogenesis of NASH involving alterations in hepatic lipid metabolism, increased generation of reactive oxygen species, and consequently oxidative stress, changes in mitochondrial function, DNA damage, and release of various cytokines resulting in progression of disease (3,4). Although such mechanisms have been inferred from data in animals and from indirect evidence in humans, no single biomarker or a cluster of metabolites in the plasma have been related to the progression of hepatic insult. Several diagnostic techniques have been developed to document impaired mitochondrial function, evidence of inflammation or indices of hepatic fibrosis (3).
Metabolomics, quantification of small molecules in plasma and tissue fluids, allows for a comprehensive view of the changes in several metabolic and signaling pathways and their interactions (5–8). Recent developments in high throughput analysis, curation and robust statistical analysis have allowed investigators to understand the changes in the cellular and tissue metabolism based upon the metabolomic data. In the present study, we have examined the plasma metabolome of a biopsy proven group of non-diabetic subjects with steatosis and steatohepatitis and compared it with a group of healthy controls. Studies were done following a defined period of fasting.
The goals of the present study were (1) to describe the changes in plasma metabolome in subjects with hepatic steatosis and in those with NASH as compared with the controls, (2) to identify biomarkers, if any, associated with steatosis and NASH, and (3) by using appropriate statistical methods, identify the metabolomic patterns that could discriminate steatosis and NASH from healthy controls.
Materials and Methods
Metabolomic analyses were performed on 35 non-diabetic subjects with histologically confirmed hepatic steatosis (n=11) and steatohepatitis (NASH; n=24), and on 25 non-diabetic healthy controls. Subjects with NAFLD were recruited from the metabolic clinics of the Cleveland Clinic and MetroHealth Medical Center in Cleveland, Ohio. Hepatic ultrasonography was performed on all control subjects by the same investigator (SD) in order to confirm absence of steatosis. Patient demographics and clinical characteristics are displayed in Table 1. Subjects with other forms of chronic liver disease were excluded by screening for autoimmune liver disease (autoimmune hepatitis, primary biliary cirrhosis, sclerosing cholangitis), for metabolic liver disease (hemochromatosis, Wilson’s Disease), for alpha-1 antitrypsin deficiency and for viral hepatitis (hepatitis B and hepatitis C). Subjects with history of daily alcohol intake (women = >20gm, men = >30g), intravenous drug use or history of bowel surgery were also excluded. None of the subjects were on any medications known to cause hepatic steatosis or taking vitamin supplements.
Table 1.
Demographic and Clinical Laboratory Analysis
| Control | Steatosis | NASH | P* | |
|---|---|---|---|---|
| N | 25 | 11 | 24 | |
| Age (years) | 42.6 (9.2) | 43.5 (10.7) | 43.6 (12.6) | NS |
| Gender | ||||
| Male | 7 (28) | 6 (54.5) | 8 (33.3) | |
| Female | 18 (72) | 5 (45.5) | 16 (66.7) | |
| Body Mass Index (kg/m2) | 24.5 (2.6) | 34.0 (4.0)a | 34.8 (4.7)a | 0.00 |
| Insulin (pmoles/L) | 52.5 (21.3) | 142.9 (62.3)a | 183.9 (103.6)a | 0.00 |
| Glucose (mmoles/L) | 4.7 (0.5) | 4.9 (0.6) | 5.3 (0.9)a | 0.035 |
| Insulin Resistance (HOMA) | 0.96 (0.4) | 2.6 (1.1)a | 3.26 (1.6)a | 0.00 |
| ALT (IU/L) | 17.6 (5.0) | 44.4 (30.0) | 84.6 (58.6)a | 0.00 |
| AST (IU/L) | 22.8 (5.7) | 31.4 (15.4) | 63.4 (46.7)a | 0.0001 |
| Triglycerides (mg/dL) | 78.5 (33.6) | 154.4 (70.4)a | 161.4 (82.8)a | 0.002 |
| HDL (mg/dL) | 60.9 (20.2) | 40.4 (9.9)a | 44.1 (10.1)a | 0.0005 |
| LDL (mg/dL) | 118.7 (21.2) | 156.0 (43.7)a | 127.9 (34.1) | 0.02 |
| Glutathione (μmol/L) | 7.9 (2.7) | 5.7 (2.7)a | 5.2 (1.9)a | 0.001 |
| Homocysteine (μmol/L) | 7.3 (2.0) | 8.8 (2.6) | 9.1 (1.9)a | 0.01 |
| Cysteine (μmol/L) | 361.4 (59.2) | 410.6 (58.0) | 432.4 (63.9)a | 0.001 |
One-way analysis of variance
Significantly different compared with controls.
p<0.05 Tukey pair-wise comparison. Data are mean (SD)
Liver biopsies were reviewed in a blinded manner by the same pathologist and given a NAFLD activity score (0–8) based upon the guidelines of the NASH Clinical Research Network (9). Subjects with a diagnosis of indeterminate NASH were excluded. Hepatic steatosis was defined as a NASH activity score ≤3 in the absence of ballooning degeneration. Steatohepatitis (NASH) was defined as a NASH activity score ≥4 and a histologic diagnosis of NASH by the pathologist.
Written informed consent was obtained from all participants after fully explaining the procedure to them. The study protocol was approved by the Institutional Review Boards at the Cleveland Clinic and MetroHealth Medical Center. Subjects reported to the General Clinical Research Center after an overnight fast of at least ten hours. After obtaining the height, weight and vital signs, an indwelling cannula was placed in a superficial vein of the forearm. Following a 30-minute rest period, three venous blood samples were obtained five minutes apart for the measurements of serum glucose and insulin concentrations. An additional blood sample (5 ml) was collected into an EDTA containing tube for metabolomic analysis. Blood samples were centrifuged at 4°C and the plasma was stored at −80°C.
Analytical Methods
The concentration of glucose in the serum was measured using the glucose oxidase method (Yellow Springs Instruments; Yellow Springs, OH); serum insulin concentrations were measured by double antibody radioimmunoassay (Linco Research; St. Charles, MO). The total concentration of homocysteine, cysteine and glutathione in plasma was determined by high performance liquid chromatography (Agilent 1100 series HPLC; Agilent Technologies; Wilmington, DE), as described by Garcia and colleagues (10). Plasma lipid profile and hepatic function panel were measured using standard laboratory methods in the clinical laboratory of the hospital.
Insulin resistance was estimated by the homeostasis model assessment (HOMA) calculator V2.2 (http://www.dtu.ox.ac.uk/home). The HOMA model is a structural computer model of the glucose-insulin feedback system in the homeostatic (overnight-fasted) state which allows deduction of insulin sensitivity from the concurrent measurements of glucose and insulin levels in the fasting state (11).
Metabolomic Analysis
The global, unbiased metabolic profiling platform was based on a combination of three independent platforms: ultrahigh performance liquid chromatography/tandem mass spectrometry (UHLC/MS/MS) optimized for basic species, UHLC/MS/MS optimized for acidic species, and gas chromatography/mass spectrometry (GC/MS). This platform was described in detail in a previous publication (8). The major components of the process are summarized as follows:
Sample extraction
100 μl of each plasma sample was thawed on ice and extracted using an automated MicroLab STAR® system (Hamilton Company, Salt Lake City, UT) in 400 μl of methanol, containing the recovery standards.
GC/MS and UHPLC/MS/MS analysis
UPLC/MS was carried out using a Waters Acquity UHPLC (Waters Corporation, Milford, MA) coupled to an LTQ mass spectrometer (Thermo Fisher Scientific Inc., Waltham, MA) equipped with an electrospray ionization source. Two separate UHPLC/MS injections were performed on each sample: one optimized for positive ions and one for negative ions. Derivatized samples for GC/MS were analyzed on a Thermo-Finnigan Trace DSQ fast-scanning single-quadrupole MS operated at unit mass resolving power. Chromatographic separation followed by full scan mass spectra was carried out to record retention time, molecular weight (m/z) and MS/MS of all detectable ions presented in the samples.
Metabolite identification
Metabolites were identified by automated comparison of the ion features in the experimental samples to a reference library of chemical standard entries that included retention time, molecular weight (m/z), preferred adducts, and in-source fragments as well as their associated MS/MS spectra. This library allowed the rapid identification of metabolites in the experimental samples with high-confidence.
Data Imputation and Statistical Analysis
The samples were analyzed over the course of two days. After the data were corrected for minor variations resulting from instrument inter-day tuning differences, the missing values for a given metabolite were imputed with the observed minimum detection value on the assumption that they were below the limits of detection. For the convenience of data visualization, the raw areas counts for each biochemical were re-scaled by dividing each samples value by the median value for the specific biochemical.
Statistical analysis of the data was performed using JMP (SAS, http://www.jmp.com), a commercial software package, and “R” (http://cran.r-project.org/), which is a freely available open-source, software package. A log transform was applied to the observed relative concentrations for each biochemical because, in general, the variance increased as a function of a biochemical’s average response. Welch’s t tests were performed to compare data obtained from experimental groups. Multiple comparisons were accounted for with the false discovery (FDR) rate method, and each FDR was estimated using q-values.
Random forest (RF) analysis was performed on untransformed data using R. Random Forest is a supervised classification technique based on an ensemble of decision trees. For a given decision tree, a subset of samples is selected to build the tree, and then the remaining samples are predicted from this tree. This process is repeated thousands of times to produce a forest. The final classification is determined by computing the frequencies (“votes”) of predictions for each group over the whole forest. This method is unbiased since the prediction for each sample is based on trees built from a subset of samples not including it; thus, the prediction accuracy is an unbiased estimate of predicting a new data set. To see which variables contribute the most to the separation, an “importance” measure is computed. We used the “Mean Decrease Accuracy” as this metric. This value is determined by randomly permuting a variable and then running the values through the trees and reassessing the prediction accuracy. If a variable is not important, then this procedure will have little change in the accuracy (permuting random noise will give random noise), while if a variable is important, the accuracy will drop after such a permutation.
Results
The demographics and clinical laboratory data are displayed in Table 1. The subjects were matched for age and sex. As anticipated, the subjects with NAFLD were obese, had significantly higher body mass index, plasma ALT, AST and insulin levels, and insulin resistance (HOMA). The plasma levels of triglycerides and LDL were higher, while the concentration of HDL was lower in subjects with NAFLD.
The plasma concentration of glutathione was significantly lower in subjects with steatosis and NASH when compared with controls. The concentrations of homocysteine and total cysteine in the plasma were significantly higher in subjects with NASH. A significant positive correlation between the plasma levels of homocysteine and cysteine was observed in healthy controls (r2 =0.63, p<0.0001) but not in NAFLD.
Metabolomic Analysis
Using LC/MS and GC/MS analysis, 437 distinct metabolites were identified in the plasma sample. Of these, 228 biochemicals matched a named structure in our reference library. The remaining 209 represent distinct chemical entities, but they do not match a named biochemical in the reference library. The changes in the metabolites between the experimental groups were calculated by the ratio of their group means. The statistical significance of the changes was analyzed by Welch’s t test, with p < 0.05 deemed to be significant. The list of known metabolites, along with their relative change amongst the steatosis and NASH subjects is displayed in the supplemental table. Unknown metabolites found to be significantly different between NAFLD and controls are also displayed.
Bile acids
As shown in Fig. 1, there was a four-fold increase in the plasma concentration of glycocholate and taurocholate, and a two-fold increase in glycochenodeoxycholate in subjects with NASH as compared with controls. These bile acids were also higher in steatosis group compared with controls, however only taurocholate met the statistical significance cutoff of p<0.05.
Figure 1.
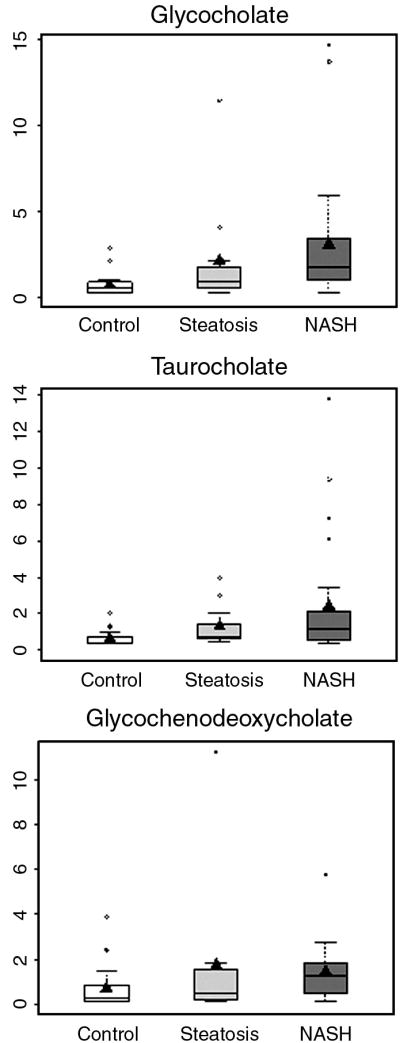
Box plots of plasma levels of bile salts in healthy controls and subjects with steatosis and NASH; median scaled values are presented on the y axis; only bile salts which were significantly different (p<0.05) between controls and NASH are shown. Others are presented in supplemental tables.
Glutathione metabolism
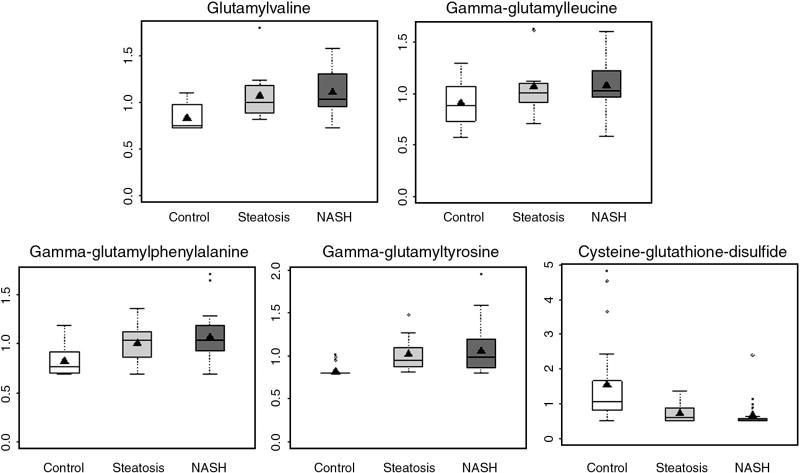
Consistent with decreased plasma glutathione in subjects with steatosis and NASH (Table 2), the concentration of cysteine-glutathione disulfide, a product of glutathione and cysteine conjugate, was significantly lower in subjects with steatosis and NASH (Figure 2E). In addition, several glutamyl dipeptides, glutamyl valine, glutamyl leucine, glutamyl phenylalanine and glutamyl tyrosine were higher in both NASH and steatosis. The increase was of similar magnitude in both groups.
Table 2.
Confusion Matrix of the Sample by Random Forest Analysis
| Healthy | NASH | Steatosis | class.error | |
|---|---|---|---|---|
| Healthy | 23 | 0 | 2 | 0.08 |
| NASH | 2 | 11 | 11 | 0.54 |
| Steatosis | 1 | 6 | 4 | 0.64 |
Rows represent the actual groups; columns list the predicted groupings by metabolomic analysis.
Figure 2.
Glutathione metabolism is upregulated in subjects with NAFLD. The plasma levels (box and whisker plots) of glutamyl amino acids. All are significantly different (p<0.05) in NASH and steatosis compared with controls except gamma-glutamylleucine, which is significantly higher in NASH only.
Lipids
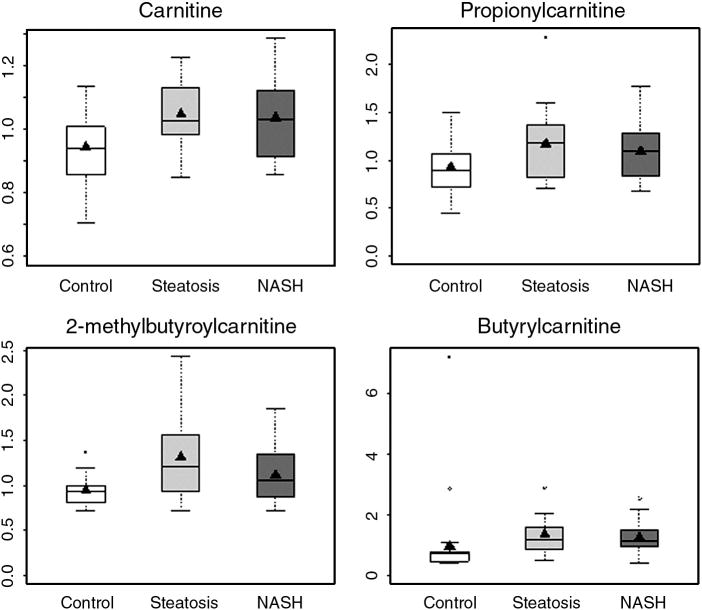
Subtle differences in lipid profiles were found between subjects with NAFLD and the healthy controls. Several free fatty acids eicosopentaenoate (C20:5n3), docosohexaenoate (C22:6n3), 10-undecenoate (C11:1n1) and arachidonate (C20:4n6), were significantly lower in individuals with NASH as compared with controls (supplemental data). In contrast, only caprate (C10:0) and 10-undecenoate (C11:1n1) were significantly lower in subjects with steatosis as compared with controls. Only linolenate (C18:3n3 or 6) and undecanoate (C11:0) were significantly higher in subjects with steatosis when compared with those with NASH. There were no other differences in the fatty acids profile amongst steatosis and NASH subjects. Metabolomic analysis could quantify 14 species of carnitine in the plasma. Free carnitine and butyrylcarnitine levels were significantly elevated in both steatosis and NASH compared with controls (Fig. 3A, 3E). In addition, propionylcarnitine and 2-methylbutyroylcarnitine levels were significantly higher in subjects with NASH only.
Figure 3.
Box and whisker plots of plasma concentration of carnitine and acylcarnitines in subjects with NAFLD and healthy controls. (Carnitine, butyrylcarnitine: p<0.05 NASH vs. controls and steatosis vs. controls; propionylcarnitine and 2-methylbutyroylcarnitine: p<0.05 NASH vs. controls, NS: steatosis vs. controls.)
Significant differences in the levels of lysophosphocholines were observed between individuals with NASH and controls. Specifically, the concentration of glycerophosphocholine, 1-oleoylglycerophosphocholine, 1-linoleoylglycerophosphocholine and 1-arachidonoylglycerophosphocholine were significantly lower in NASH when compared with controls. Only 1-oleoylglycerophosphocholine was significantly lower in subjects with steatosis.
Carbohydrates
Glucose and pyruvate were significantly higher in subjects with NASH. Mannose and lactate levels were higher in both steatosis and NASH. In addition, erythronate levels were higher in NAFLD subjects.
Amino acids
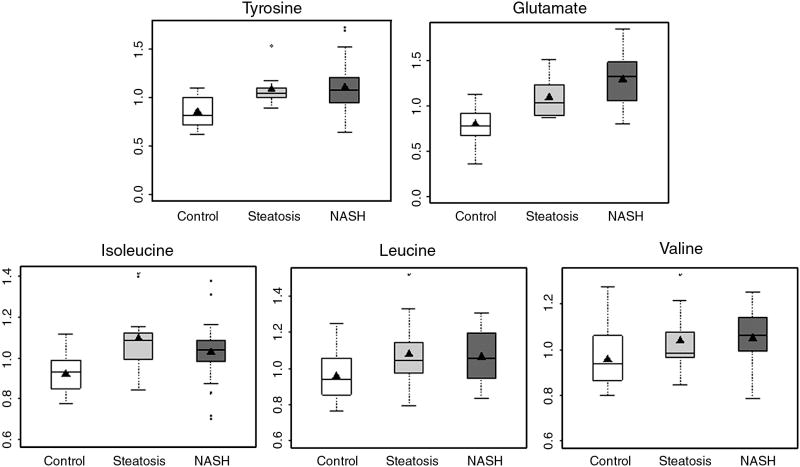
Among the essential amino acids, phenylalanine and branched chain amino acids, leucine, isoleucine, and valine were higher in subjects with NASH as compared with controls (Fig. 4). Glutamate, aspartate and tyrosine were also elevated in individuals with NASH. In contrast to subjects with NASH, only glutamate, lysine, tyrosine and isoleucine were significantly higher in subjects with steatosis compared with controls. There were no significant differences in amino acid levels amongst subjects with steatosis and NASH.
Figure 4.
Box and whisker plots of plasma concentration of branched chain amino acids, tyrosine and glutamate in healthy controls and subjects with steatosis and NASH. (NASH vs. controls, p<0.05 for all; steatosis vs. controls, p<0.05 for glutamate, tyrosine and isoleucine.)
Others
A number of unnamed biochemicals in the plasma were significantly higher in NAFLD subjects (supplemental data), in particular x-11546 and x-11529, which were almost 3-fold higher in NASH compared with controls.
NASH vs. Steatosis
As detailed in the supplemental table, plasma levels of very few metabolites were significantly different in subjects with steatosis and NASH. These include glutamate, creatine, pyruvate, unknown X-01911_200, which were significantly lower, and undecenoate (C11:0), linolenate (alpha or gamma), which were significantly higher in subjects with steatosis when compared with those with NASH.
Random forest Analysis
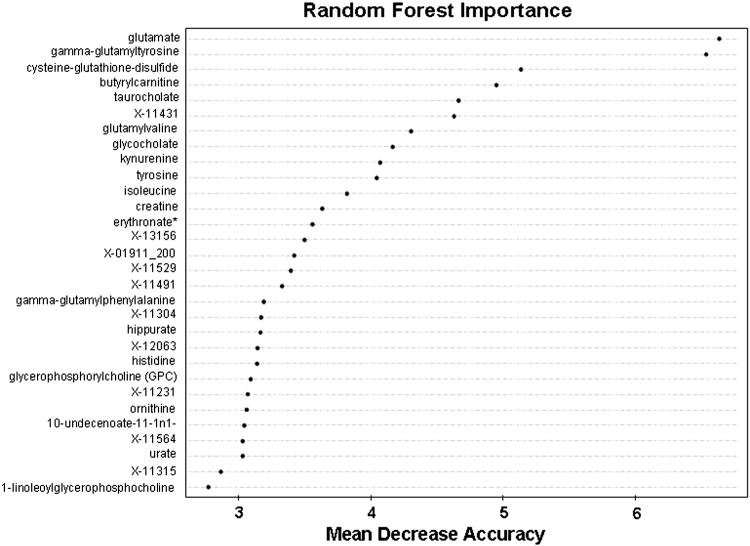
A random forest analysis of the plasma biochemical profile data was performed to test the ability of the metabolomic data to correctly classify the samples into their respective groups (Table 2). For the healthy group, 92% of the subjects (23 out of 25) could be correctly separated from the individuals with NAFLD (steatosis and steatohepatitis), with a class error of 0.08. Amongst the NAFLD subjects, the error rate was high for subjects in the NASH and steatosis groups, suggesting that the metabolic profile of the NASH and steatosis group was not distinguishable based on this dataset. The metabolites that most effectively separated the groups are shown in the importance plot (Fig. 5).
Figure 5.
Random forest importance plot for all subjects.
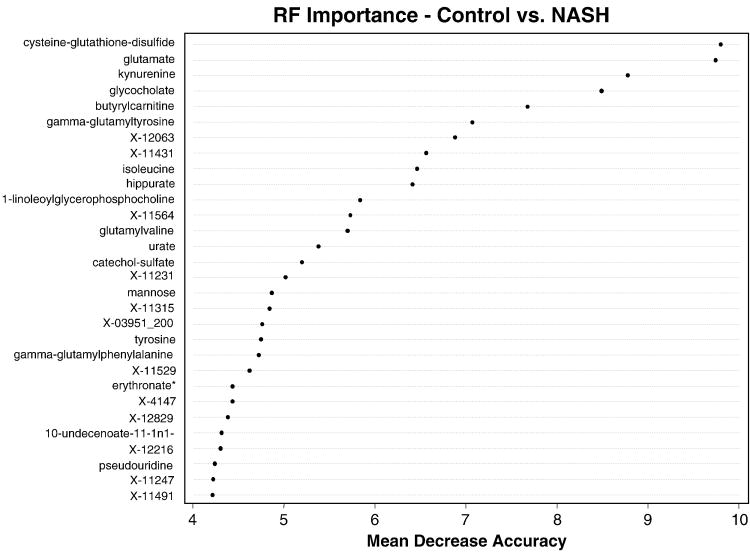
Since the steatosis group was small (not powered enough), we also performed a random forest analysis between subjects with NASH only and healthy controls. Twenty-three out of 24 subjects with NASH could be separated from healthy controls, with an error rate of 4.1%. The metabolites that most effectively separated the group are shown in the importance plot (Fig. 6).
Figure 6.
Random forest importance plot for controls vs. NASH.
Discussion
In the present study, we performed metabolomic analysis of the plasma in order to obtain a comprehensive view of changes in several metabolic pathways in patients with NAFLD, in order to identify disease related patterns and to identify biochemical perturbations. The data revealed significant changes in certain key pathways, specifically bile acids, glutathione metabolism, lipid and amino acid metabolism. The changes in the plasma metabolome were more evident in subjects with NASH than in individuals with hepatic steatosis. It should be underscored that the plasma metabolome, during the steady state, represents the sum of changes in several tissues and organs and may not reflect any specific organ system. This is particularly true in the case of NAFLD where, as a result of insulin resistance and changes in hormones and cytokines, a number of organ systems, i.e. adipose tissue and skeletal muscle, in addition to the liver, may be affected (1,2).
The subjects in the present study were carefully selected in order to minimize confounding variables, and the plasma samples were obtained at rest following an overnight fast. Only biopsy-proven subjects with steatosis and steatohepatitis were included. We excluded subjects with “indeterminate” diagnosis. All subjects had normal plasma levels of B12 and folate. Other causes of liver disease were excluded by appropriate laboratory investigations.
Bile acids
The concentrations of glycocholate, taurocholate and glycochenodeoxycholate were markedly higher in subjects with NASH. Taurocholate and glycochenodeoxycholate were also significantly higher in subjects with steatosis when compared with controls. Direct measurement of bile acids confirmed these findings (unpublished data). To our knowledge, the higher concentration of bile salts in NASH and steatosis subjects has not been reported previously, and the precise mechanism that is responsible for this increase in concentration remains speculative. It could be the consequence of either a higher bile acid pool due to a higher rate of bile acid synthesis, result from increased peroxisomal and microsomal metabolism, could be caused by hepatocellular injury, or possibly be an adaptive response to the accumulation of triglycerides in the liver. A higher concentration of bile acids has been previously reported in subjects with hyperlipidemia (12). The healthy liver is very efficient at capturing and removing bile acids from hepatic-portal circulation. When liver function is compromised, more bile acids appear in the circulation because the liver is not adequately removing them. Thus, the concentration of bile acids in the serum has been suggested as an indicator of early liver dysfunction, and is considered more sensitive than most traditional assays (13,14). It is plausible that the accumulation of triglycerides in the liver or increased fatty acid oxidation compromises liver function, resulting in its inefficiency in bile acid uptake from the circulation.
The higher plasma levels of bile acids could also be related to the higher insulin resistance in subjects with NAFLD. The interaction between insulin, hepatic insulin receptors and bile acids is complex (14–19). Experimentally induced diabetes in animal models has been shown to result in higher plasma bile acids which decreased following insulin therapy (15,16). Insulin is a suppressor of sterol 12α hydroxylase (CYP8B) in the liver, the key enzyme for the synthesis of cholic acid (17). Liver specific disruption of insulin receptors, and therefore hepatic insulin resistance, in mice, however, resulted in lower synthesis of bile acid and decreased expression of the bile acid synthetic enzyme CYP7b1 (18). The data in the transgenic mice cannot be easily reconciled with the other studies cited above (15–17, 19).
Irrespective of the mechanism of the increase, a higher concentration of bile acids in individuals with NAFLD could modulate lipid homeostasis through activation of the farnesoid X receptor (21–23), resulting in changes in VLDL metabolism and hepatic beta oxidation. Only future studies will delineate the role of bile acids in the alteration in hepatic metabolism observed in subjects with NAFLD.
Oxidative stress
Metabolomic analysis revealed significantly higher concentrations of γ-glutamyl peptides in subjects with both steatosis and steatohepatitis (Fig. 2), and lower concentrations of cysteine-glutathione disulfide. Targeted analysis showed that the plasma concentration of total glutathione was significantly lower in individuals with NAFLD (Table 1). Glutathione is the major antioxidant in the liver, which is also the primary source of plasma glutathione. A linear correlation between plasma and hepatic glutathione concentration has been reported in liver disease (24), and a lower hepatic glutathione concentration has been reported in non-alcoholic steatosis (25). Following its extrusion from hepatocytes, glutathione is degraded by glutamyl transpeptidase to form cystenyl glycine and glutamyl-amino acid (26). The lower plasma concentration of glutathione and a higher concentration of glutamyl peptides suggest a high rate of hepatic glutathione turnover in subjects with NAFLD as a result of oxidant stress. The later may be the consequence of increased influx of fatty acid and higher rate of beta oxidation in the livers of individuals with NAFLD (27–29). The higher plasma glutamate and cysteine concentration in subjects with NAFLD as compared with controls may also be the consequence of higher rate of turnover of glutathione, similar to that seen in insulin deficient state (30). Studies using tracer isotopic measurements of glutathione kinetics will be required to confirm these observations.
Lipid metabolism
The plasma concentrations of total carnitines were significantly higher in subjects with both steatosis and NASH. Amongst the 14 species of carnitines measured, short chain acylcarnitines (C3, C4 and C5) were significantly higher in individuals with NASH. Only butyrylcarnitine (C5) was significantly elevated in steatosis. Interestingly, we did not find any significant change in most of the fatty acids measured except eicosapentanoate (EPA; 20:5n3), docosahexanoate (DHA; 22:6n3), and 10-undecenoate (11:1n1), which were lower in subjects with NASH. These changes in plasma long chain fatty acids are similar to those described by targeted lipidomic analysis of hepatic tissue in subjects with NAFLD (31). These observed changes may be caused by altered metabolism in the liver, the skeletal muscle and the contribution of gut microbes. In particular, changes in branched chain amino acid metabolism in the skeletal muscle may have resulted in higher levels of short chain acylcarnitines (32). Further studies will be required to determine if increase dietary intake of these specific poly-unsaturated fatty acids can improve the outcome for individuals with NASH.
Amino acids
Several essential amino acids, leucine, isoleucine, valine, and phenylalanine, were elevated in subjects with NASH and not steatosis. The increase in essential amino acids suggests a higher rate of whole body protein turnover. In addition, the lack of increase in essential amino acids in individuals with steatosis suggests that changes in protein turnover may be a late event in the progression of steatosis to NASH, and may be modulated by other factors such as cytokines and inflammation, in addition to insulin resistance (33–36).
Changes in non-essential amino acids, aspartate and glutamate, may be due to increased anaplerosis of amino acids into the TCA cycle, resulting in an increased cataplerosis to insure the required removal of the resulting carbon skeletons of these amino acids from the cycle.. The higher levels of glutamate in the plasma of subjects with NASH, in addition to higher glutathione turnover, could also be due to increased transamination of amino acids being degraded in the liver and skeletal muscle.
Steatosis vs. steatohepatitis
Plasma concentration of only a few biochemicals were significantly different between subjects with steatosis and steatohepatitis. The physiological significance of these changes is uncertain. If one considers steatosis and steatohepatitis as part of a continuum, the lack of any significant difference between the two groups in the metabolomic profile is not surprising.
Random Forest and Principal Component analysis
To assess the ability to classify subjects as healthy, with steatosis or with NASH, random forest analysis was performed using the entirety of the metabolomic data. An excellent separation of the healthy subjects and NAFLD subjects was achieved. However, the steatosis and NASH subjects were not readily distinguishable (Table 2). This is consistent with the result from Welch’s t test. Many metabolites were deemed to be statistical significance when either the steatosis group or the NASH group was compared to the healthy control group. Only a few metabolites were significantly different between the steatosis and the NASH groups. It is worth noting that the number of subjects in the steatosis group was rather limited (n = 11), and the statistical significance is impacted by the group size. In future studies, we are planning to increase the groups size to assess if significant differences in plasma metabolic profiles between steatosis and NASH can be detected. As shown in Figure 6, a panel of markers which provided the most contribution to the separation of the healthy group and NASH group was discovered. Not surprisingly, these markers matched with the metabolites identified by the Welch’s t tests and described in this manuscript: glutathione metabolites and bile acids, amino acids, etc. These markers can be potentially used as diagnostic markers for NAFLD and for the assessment of therapeutic intervention in patients with NASH.
Supplementary Material
Acknowledgments
Financial Support: supported by start-up funds from Cleveland Clinic Foundation and by NIH grants DK079937 to SCK and CTSA 1UL1 RR024989 to case Western Reserve University. Metabolomic analysis were done at Metabolon Inc.
Abbreviations
- NAFLD
non-alcoholic fatty liver disease
- NASH
non-alcoholic steatohepatitis
- HOMA
Homeostasis model assessment
- ALT
alanine aminotransferase
- AST
aspartate aminotransferase
- HDL
high density lipoprotein cholesterol
- LDL
low density lipoprotein cholesterol
Footnotes
Conflict of interest: SCK and RWH are members of the Biochemistry Advisory Board of Metabolon Inc., and have received honoraria and stock options from Metabolon Inc.
Publisher's Disclaimer: This is a PDF file of an unedited manuscript that has been accepted for publication. As a service to our customers we are providing this early version of the manuscript. The manuscript will undergo copyediting, typesetting, and review of the resulting proof before it is published in its final citable form. Please note that during the production process errors may be discovered which could affect the content, and all legal disclaimers that apply to the journal pertain.
References
- 1.Preiss D, Sattar N. Non-alcoholic fatty liver disease: an overview of prevalence, diagnosis, pathogenesis and treatment considerations. Clin Sci. 2008;115:141–50. doi: 10.1042/CS20070402. [DOI] [PubMed] [Google Scholar]
- 2.Angulo P. Nonalcoholic fatty liver disease. N Engl J Med. 2002;346:1221–31. doi: 10.1056/NEJMra011775. [DOI] [PubMed] [Google Scholar]
- 3.Byrne CD, Olufadi R, Bruce KD, Cagampang FR, Ahmed MH. Metabolic disturbances in non-alcoholic fatty liver disease. Clin Sci. 2009;116:539–64. doi: 10.1042/CS20080253. [DOI] [PubMed] [Google Scholar]
- 4.Browning JD, Horton JD. Molecular mediators of hepatic steatosis and liver injury. J Clin Invest. 2004;114:147–52. doi: 10.1172/JCI22422. [DOI] [PMC free article] [PubMed] [Google Scholar]
- 5.Gibney MJ, Walsh M, Brennan L, Roche HM, German B, van Ommen B. Metabolomics in human nutrition: opportunities and challenges. Am J Clin Nutr. 2005;682:497–503. doi: 10.1093/ajcn.82.3.497. [DOI] [PubMed] [Google Scholar]
- 6.Wishart DS. Current progress in computational metabolomics. Brief Bioinform. 2007;8:279–93. doi: 10.1093/bib/bbm030. [DOI] [PubMed] [Google Scholar]
- 7.Hollywood K, Brison DR, Goodacre R. Metabolomics: current technologies and future trends. Proteomics. 2006;6:4716–23. doi: 10.1002/pmic.200600106. [DOI] [PubMed] [Google Scholar]
- 8.Evans AM, Dehaven CD, Barrett T, Mitchell M, Milgram E. Integrated, nontargeted ultrahigh performance liquid chromatography/electrospray ionization tandem mass spectrometry platform for the identification and relative quantification of the small-molecule complement of biological systems. Anal Chem. 2009;81:6656–67. doi: 10.1021/ac901536h. [DOI] [PubMed] [Google Scholar]
- 9.Kleiner DE, Brunt EM, Van Natta M, Behling C, Contos MJ, Cummings OW, et al. Design and validation of a histological scoring system for nonalcoholic fatty liver disease. Hepatology. 2005;41:1313–21. doi: 10.1002/hep.20701. [DOI] [PubMed] [Google Scholar]
- 10.Garcia AJ, Apitz-Castro R. Plasma total homocysteine quantification: an improvement of the classical high-performance liquid chromatographic method with fluorescence detection of the thiol-SBD derivatives. J Chromatogr B Analyt Technol Biomed Life Sci. 2002;779:359–63. doi: 10.1016/s1570-0232(02)00401-4. [DOI] [PubMed] [Google Scholar]
- 11.Matthews DR, Hosker JP, Rudenski AS, Naylor BA, Treacher DF, Turner RC. Homeostasis model assessment: insulin resistance and beta-cell function from fasting plasma glucose and insulin concentrations in man. Diabetologia. 1985;28:412–19. doi: 10.1007/BF00280883. [DOI] [PubMed] [Google Scholar]
- 12.Pennington CR, Ross PE, Bateson MC, Bouchier IAD. Serum bile acids in patient with hyperlipidaemia. J Clin Pathol. 1978;31:58–62. doi: 10.1136/jcp.31.1.58. [DOI] [PMC free article] [PubMed] [Google Scholar]
- 13.Bouchier IAD, Pennington CR. Serum bile acids in hepatobiliary disease. Gut. 1978;19:492–6. doi: 10.1136/gut.19.6.492. [DOI] [PMC free article] [PubMed] [Google Scholar]
- 14.Brody DH, Leichter L. Clearance tests of liver function. Med Clin N Am. 1979;63:621–30. doi: 10.1016/s0025-7125(16)31692-3. [DOI] [PubMed] [Google Scholar]
- 15.Wei J, Qiu DK, Ma X. Bile acids and insulin resistance: implications for treating nonalcoholic fatty liver disease. J Dig Dis. 2009;10:85–90. doi: 10.1111/j.1751-2980.2009.00369.x. [DOI] [PubMed] [Google Scholar]
- 16.Nerfi FO, Severin CH, Valdivieso VD. Bile acid pool changes and regulation of cholate synthesis in experimental diabetes. Biochim Biophy Acta. 1978;529:212–23. doi: 10.1016/0005-2760(78)90064-4. [DOI] [PubMed] [Google Scholar]
- 17.Uchida K, Takase H, Kadowaki M, Nomura Y, Matsubara T, Takeuchi N. Altered bile acid metabolism in alloxan diabetic rats. Jpn J Pharmacol. 1978;29:553–62. doi: 10.1254/jjp.29.553. [DOI] [PubMed] [Google Scholar]
- 18.Ishida H, Yamashita C, Kuruta Y, Yoshida Y, Noshiro M. Insulin is a dominant suppressor of sterol 12α-hydroxylase P450 (CYP8B) expression in rat liver: possible role of insulin in circadian rhythm of CYP8B. J Biochem. 2000;127:57–64. doi: 10.1093/oxfordjournals.jbchem.a022584. [DOI] [PubMed] [Google Scholar]
- 19.Biddinger SB, Haas JT, Yu BB, Bezy O, Jing E, Zhang W, et al. Hepatic insulin resistance directly promotes formation of cholesterol gallstones. Nat Med. 2008;14:778–82. doi: 10.1038/nm1785. [DOI] [PMC free article] [PubMed] [Google Scholar]
- 20.Aanlungo S, Miquel JF, Rigotti A, Nervi F. Insulin and cholesterol gallstones: new insights for a complex pathogenic relationship. Hepatology. 2008;48:2078–80. doi: 10.1002/hep.22618. [DOI] [PubMed] [Google Scholar]
- 21.Houten SM, Watanabe M, Auwerx J. Endocrine functions of bile acids. EMBO J. 2006;25:1419–25. doi: 10.1038/sj.emboj.7601049. [DOI] [PMC free article] [PubMed] [Google Scholar]
- 22.Keitel V, Kubitz R, Häussinger D. Endocrine and paracrine role of bile acids. World J Gastroenterol. 2008;14:5620–29. doi: 10.3748/wjg.14.5620. [DOI] [PMC free article] [PubMed] [Google Scholar]
- 23.Staels B, Fonseca VA. Bile acids and metabolic regulation. Mechanisms and clinical response to bile acid sequestration. Diabetes Care. 2009;32:S237–S245. doi: 10.2337/dc09-S355. [DOI] [PMC free article] [PubMed] [Google Scholar]
- 24.Shigesawa T, Sato C, Marumo F. Significance of plasma glutathione determination in patients with alcoholic and non-alcoholic liver disease. J Gastroenterol Hepatol. 1992;7:7–11. doi: 10.1111/j.1440-1746.1992.tb00926.x. [DOI] [PubMed] [Google Scholar]
- 25.Altomar E, Vendemiale G, Albano O. Hepatic glutathione content in patients with alcoholic and non alcoholic liver diseases. Life Sci. 1988;43:991–8. doi: 10.1016/0024-3205(88)90544-9. [DOI] [PubMed] [Google Scholar]
- 26.Franco R, Schoneveld OJ, Pappa A, Panayiotidis MI. The central role of glutathione in the pathophysiology of human disease. Arch Physiol Biochem. 2007;113:234–58. doi: 10.1080/13813450701661198. [DOI] [PubMed] [Google Scholar]
- 27.Dasarathy S, Kasumov T, Edmison JM, Gruca LL, Bennett C, Duenas C, et al. Glycine and urea kinetics in non-alcoholic steatohepatitis in human: effect of intralipid infusion. Am J Physiol Gastro Liver Physiol. 2009;297:G567–G575. doi: 10.1152/ajpgi.00042.2009. [DOI] [PMC free article] [PubMed] [Google Scholar]
- 28.Bugianesi E, Gastaldelli A, Vanni E, Gambino R, Cassader M, Baldi S, et al. Insulin resistance in non-diabetic patient with non-alcoholic fatty liver disease: sites and mechanisms. Diabetologia. 2005;48:634–42. doi: 10.1007/s00125-005-1682-x. [DOI] [PubMed] [Google Scholar]
- 29.Sanyal AJ, Campbell-Sargent C, Mirshahi F, Rizzo WB, Contos MJ, Sterling RK, et al. Nonalcoholic steatohepatitis: association of insulin resistance and mitochondrial abnormalities. Gastroenterology. 2001;120:1183–92. doi: 10.1053/gast.2001.23256. [DOI] [PubMed] [Google Scholar]
- 30.Darmaun D, Smith SD, Sweeten S, Sager BK, Welch S, Mauras N. Evidence for accelerated rates of glutathione utilization and glutathione depletion in adolescents with poorly controlled type 1 diabetes. Diabetes. 2005;54:190–6. doi: 10.2337/diabetes.54.1.190. [DOI] [PubMed] [Google Scholar]
- 31.Puri P, Baillee RA, Wiest MM, Mirshahi F, Choudhury J, Cheung O, et al. A lipidomic analysis of nonalcoholic fatty liver disease. Hepatology. 2007;46:1081–90. doi: 10.1002/hep.21763. [DOI] [PubMed] [Google Scholar]
- 32.Newgard CB, An J, Bain JR, Muehlbauer MJ, Stevens RD, Lien LF, et al. A branched-chain amino acid-related metabolic signature that differentiates obese and lean humans and contributes to insulin resistance. Cell Metab. 2009;9:311–26. doi: 10.1016/j.cmet.2009.02.002. [DOI] [PMC free article] [PubMed] [Google Scholar]
- 33.Marliss EB, Chevalier S, Gougeon R, Morais JA, Lamarche M, Adegoke OAJ, et al. Elevations of plasma methylarginines in obesity and ageing are related to insulin sensitivity and rates of protein turnover. Diabetologia. 2006;49:351–9. doi: 10.1007/s00125-005-0066-6. [DOI] [PubMed] [Google Scholar]
- 34.Pereira S, Marliss EB, Morais JA, Chevalier S, Gougeon R. Insulin resistance of protein metabolism in type 2 diabetes. Diabetes. 2008;57:56–63. doi: 10.2337/db07-0887. [DOI] [PubMed] [Google Scholar]
- 35.Gougeon R, Morais JA, Chevalier S, Pereira S, Lamarche M, Marliss EB. Determinants of whole-body protein metabolism in subjects with and without type 2 diabetes. Diabetes Care. 2008;31:128–33. doi: 10.2337/dc07-1268. [DOI] [PubMed] [Google Scholar]
- 36.Kalhan SC. Fatty acids, insulin resistance and protein metabolism. J Clin Endocr Metab. 2009;94:2725–7. doi: 10.1210/jc.2009-1235. [DOI] [PMC free article] [PubMed] [Google Scholar]
Associated Data
This section collects any data citations, data availability statements, or supplementary materials included in this article.


