

Abstract
AIMS
To characterize the population pharmacokinetics of mycophenolic acid (MPA) and evaluate dose regimens using a simulation approach and accepted therapeutic drug monitoring targets in children and young people undergoing blood or marrow, kidney and liver transplantation.
METHODS
MPA concentration–time data were collected using an age specific sampling protocol over 12 h. Some patients provided randomly timed but accurately recorded blood samples. Total and unbound MPA were measured by HPLC. NONMEM was employed to analyze MPA pharmacokinetic data. Simulations (n = 1000) were conducted to assess the suitability of the MPA dose regimens to maintain total MPA AUC(0,12 h) within the range 30 and 60 mg l−1 h associated with optimal outcome.
RESULTS
A two-compartment pharmacokinetic model with first-order elimination best described MPA concentration–time data. Population mean estimates of MPA clearance, inter-compartmental clearance, volumes of distribution in the central and peripheral compartments, absorption rate constant and bioavailability were 6.42 l h−1, 3.74 l h−1, 7.24 l, 16.8 l, 0.39 h−1 and 0.48, respectively. Inclusion of bodyweight and concomitant ciclosporin reduced the inter-individual variability in CL from 54.3% to 31.6%. Children with a bodyweight of 10 kg receiving standard MPA dose regimens achieve an MPA AUC below the target range suggesting they may be at a greater risk of acute rejection.
CONCLUSIONS
The population pharmacokinetic model for MPA can be used to explore dosing guidelines for safe and effective immunotherapy in children and young people undergoing transplantation.
Keywords: children, mycophenolate mofetil, mycophenolic acid, NONMEM, population pharmacokinetics, transplantation
WHAT IS ALREADY KNOWN ABOUT THIS PROJECT?
Mycophenolate mofetil (MMF) is an immunosuppressant drug used for the treatment and prevention of graft vs. host disease in blood or marrow transplantation and acute graft rejection in solid organ transplantation.
Mycophenolic acid (MPA) pharmacokinetics have not been thoroughly studied in paediatric blood or marrow transplant recipients and guidance for optimal dosing of mycophenolic acid in children is lacking.
Mycophenolic acid exhibits considerable inter- and intra-patient pharmacokinetic variability in adults and paediatric transplant recipients.
The AUC of mycophenolic acid over a 12 h dose interval at steady-state is generally agreed to be the most reliable metric associated with the risk of acute rejection.
Population pharmacokinetic analysis can utilize concentration information from both intensive sampling and sparse sampling to provide pharmacokinetic parameter estimates, estimates of inter- individual and intra-individual variability in these parameters and allows patient characteristics explaining inter-individual variability to be quantified.
THIS STUDY ADDS
This study is one of the first investigations in which a population pharmacokinetic modelling approach was applied to assess the pharmacokinetics of both intravenous and oral MMF in children and young people undergoing blood or marrow and solid organ transplantation.
Bodyweight and concomitant ciclosporin were found to influence MPA pharmacokinetics.
This study evaluated current dosing strategies and found that they may be suboptimal for children weighing less than 10 kg.
Introduction
Mycophenolate mofetil (MMF) is an immunosuppressant drug used for the treatment and prevention of graft vs. host disease (GvHD) in blood or marrow transplantation [1] and acute graft rejection in solid organ transplantation [2]. MMF is the 2, 4-morpholinoethyl ester pro-drug of mycophenolic acid (MPA) which is a potent, selective and reversible inhibitor of inosine monophosphate dehydrogenase (IMPDH). MPA targets the de novo purine biosynthesis pathway by inhibiting of IMPDH, thus acting against the proliferation of T and B lymphocytes. It also blocks the synthesis of guanosine nucleotide, which is required as a building block for DNA and RNA synthesis [3].
MMF undergoes rapid and complete in vivo metabolism to MPA following intravenous infusion or oral administration [4]. The absolute bioavailability of MPA after oral administration of MMF was estimated to be 94% in healthy subjects [4]. MPA is highly bound (97–99%) to serum albumin in patients with normal renal and liver function [5, 6]. Only unbound MPA is capable of inhibiting IMPDH in vitro[7]. MPA is metabolized in the gastrointestinal tract, liver and kidney by uridine diphosphate glucuronosyltransferases (UGTs) [8] to form 7-O-MPA-glucuronide (MPAG) which is the major metabolite of MPA. MPAG also displays significant binding to serum albumin (approximately 82% in stable patients) [9] and is usually present in the plasma at 20- to 100-fold higher concentrations than MPA. However, this metabolite is not pharmacologically active [7]. MPAG is mainly excreted into the urine via active tubular secretion [9] and into the bile by the multi-drug resistance protein 2 (MRP-2) [10]. MPAG excreted into the bile may be de-conjugated back to MPA by bacteria found in the gastrointestinal tract and then reabsorbed into the systemic circulation in the lower bowel [4]. This enterohepatic recirculation process contributes approximately 40% (range 10–60%) to MPA exposure [5, 11].
There have been several studies on the pharmacokinetics of MPA in children with solid organ transplantation [12–14]. However, MPA pharmacokinetics have not been thoroughly studied in paediatric blood or marrow transplant recipients and guidance for optimal dosing of MPA in children is lacking [15].
MPA exhibits considerable inter- and intra-patient pharmacokinetic variability in adult and paediatric transplant recipients [9, 16–18]. The pharmacokinetics of MPA are complex with evidence that pharmacokinetic parameters for MPA change over time following transplantation and appear to be influenced by renal function, albumin concentrations and drug interactions [19]. A greater than 10-fold range in MPA area under the concentration–time curve (AUC) has been reported following a standard dose [5, 9]. The AUC of MPA over a 12 h dose interval at steady-state is generally agreed to be the most reliable metric associated with the risk of acute rejection [20, 21].
However, measuring 12 h MPA AUC in paediatric patients is impractical due to the ethical and logistical difficulties in obtaining adequate samples in children. Population pharmacokinetic analysis can utilize concentration information from both intensive sampling and sparse sampling to provide pharmacokinetic parameter estimates, estimates of inter- individual and intra-individual variability in these parameters and allows patient characteristics explaining inter-individual variability to be quantified [22].
The aims of this study were to characterize the population pharmacokinetics of MPA following intravenous infusion of MMF and oral administration of MMF in children and young people undergoing blood or marrow or solid organ transplantation, and evaluate currently recommended dose regimens using pharmacokinetic model-based simulations and the accepted therapeutic drug monitoring targets in children and young people.
Methods
Patients
Children and young people receiving mycophenolic acid after blood or marrow or solid organ transplantations were included in this prospective, single-centre observational investigation of the pharmacokinetics of MPA. This study was approved by the Human Research Ethics Committee at the Children's Hospital at Westmead and written informed consent was obtained from parents of all children.
Drug administration and blood sampling
MMF (CellCept® Powder for Infusion, Roche Products Pty. Ltd, Australia) was diluted in 5% glucose and administered as a 2 h intravenous infusion at a dose of between 10 to 15 mg kg−1, twice or three times daily. MMF (CellCept® Tablet, Roche Products Pty. Ltd, Australia) was administered as an oral dose of between 10 to 15 mg kg−1, twice or three times daily.
Children and young people who weighed more than 20 kg had a series of 13–14 blood samples (3 ml each) drawn over an 8 h or 12 h time period (depending on the dosing interval) following the intravenous or oral MMF dose. The blood samples were collected from the patient's central venous cannula prior to the dose, and at the end of the infusion, then 15, 30 and 45 min, 1, 1.5, 2, 3, 5, 6, 8, 10 and 12 h after intravenous administration of MMF, or at 0.5, 1, 1.5, 2, 2.5, 3, 3.5, 4, 6, 8, 10 and 12 h after oral administration of MMF. The last two samples were taken only in those patients who received MMF twice daily. Fewer samples were collected from children who weighed less than 20 kg. These typically included a sample prior to the dose, then at the end of the infusion, 0.5, 1, 2 and 4 h after the dose or at 0.5, 1, 3, 5 and 7 h after oral administration of MMF. The remaining children and young people had randomly timed but accurately recorded blood samples collected. All the blood samples were taken when steady-state had been achieved based on the dosing history for each patient. Plasma was separated by centrifugation at 1200 g for 10 min at 4°C (Beckman CS-15R; Beckman Instruments, Fullerton, CA, USA) and was stored at −40°C until analysis. All samples were analyzed within 3 months of collection.
MPA assay
MPA concentrations were measured in plasma samples using a previously established and validated high-performance liquid chromatography assay [23]. The extraction recovery was over 93% and the assay response was linear over the MPA concentration range of 0.07–50 mg l−1 for total MPA. Intra- and inter-day assay reproducibility was less than 10% over this range. The limit of detection and limit of quantitation were 0.04 mg l−1 and 0.07 mg l−1, respectively. A comparison of numerous plasma samples from patients receiving a range of medicines revealed no interfering peaks in the MPA assay.
Population pharmacokinetic analysis
Data were analyzed using the nonlinear mixed-effects modelling program NONMEM version V, level 1.1 (Globomax, Hanover, USA). The program Wings for NONMEM version 405 (http://wfn.sourceforge.net/) was used as a front-end processor. The Compaq Visual Fortran version 6.1A (Compaq Computer Corporation, Texas, USA) was used to perform the Fortran compilation. Graphical outputs of NONMEM were undertaken using CrossGraphs version 2.3 (PPD Development, Cambridge MA, USA). The first-order conditional estimation with interaction method was used throughout the model building and evaluation procedure.
Model selection was based on goodness-of-fit in addition to criteria of statistical significance, model plausibility and stability. Models were compared statistically using a likelihood ratio test on the differences in the NONMEM derived objective function value (OFV). Statistical significance for base model building and individual covariate analysis was set at P < 0.05 (ΔOFV = 3.84), while statistical significance for forward addition and backward elimination was set at a higher criteria (P < 0.01, ΔOFV = 6.63). Plots of residuals and weighted residuals, standard errors of parameter estimates and changes in estimates of inter-individual, inter-occasion and residual variability were also examined.
Base model building
Preliminary analyses focused on the selection of the structural and statistical models without taking into account the effects of covariates. The plots of observed concentration–time data of MPA were initially examined. One- and two-compartment pharmacokinetic models with first-order elimination were compared to investigate the best fit of the concentration–time data. The NONMEM subroutines ADVAN2 TRANS2 and ADVAN4 TRANS4 were employed in the analyses. The use of a lag time for drug absorption and the absorption rate constant (ka) were examined. An exponential error model was employed to model inter-individual variability (IIV) for the pharmacokinetic parameters, defined as follows:  , where θi represents the pharmacokinetic parameter of the ith individual,
  is the typical value of pharmacokinetic parameter θ in the population (e.g. population mean), ηi quantifies the deviation of θi from
  with a normal distribution of (0, ω2). The difference between the jth observed concentration (Y) in the ith individual and its respective prediction (
 ) was modelled with an exponential error model such that
  , where ε1 is random effect quantifying the errors between Y and
  with a normal distribution of (0, σ2). Inter-occasion variability (IOV) for the parameter θ was evaluated as an additional level of random effect and was expressed as follows:
  , where OCCn has the value of 1 for the nth occasion and 0 otherwise; k1 …nare random variables assumed to be normally distributed with a mean of 0, and variance is denoted by π2. In the modelling analysis, each ‘occasion’ was defined as 7 days in patients who were administered MMF daily. The effect of IOV was tested on MPA clearance (CL) using NONMEM's BLOCK (1) SAME option, assuming IOV was the same for all occasions.
Covariate analysis
Covariates screened for their possible influence on MPA pharmacokinetic parameters included sex, bodyweight, weight with an allometric scaling function (with the exponent fixed to 0.75), height, age, body surface area (BSA), body mass index (BMI), time after transplantation, days of therapy, transplantation type (blood or marrow, kidney or liver), concomitant ciclosporin (note: tacrolimus was co-administered to patients who did not receive ciclosporin), concomitant acyclovir, MPA unbound fraction, glomerular filtration rate (GFR), serum albumin concentration and estimated creatinine clearance (CLCR). The covariates were implemented in the model using two different approaches: TVCL = θCL× (1 +θCOV× covariate) and TVCL = θCL× covariate. Serum albumin concentrations were determined by a colorimetric method using bromocresol green dye (by the Department of Biochemistry, Children's Hospital at Westmead). Creatinine clearance for children and young people was estimated using the Counahan formula [24] as follows:
 |
The serum creatinine concentration used in the analysis was the median value observed during the sample collection period. The influence of individual covariates on pharmacokinetic parameters was examined by plotting the empirical Bayesian estimates of individual parameters (derived from the base model) against covariates. Covariates identified as potentially influential were then included in the population pharmacokinetic model for MPA.
Following initial screening of individual covariates, in a forward stepwise fashion covariates were added cumulatively to the model in the order of their contribution to the reduction in the OFV in the preliminary analysis until there was no further reduction in the OFV. Next, a backward elimination step was performed in which the influence of each covariate was removed from the model in descending order of their contribution to the change in the OFV and the remaining parameters in the model were re-estimated.
It is plausible that changes in MPA unbound fraction due to changes in albumin concentrations will influence the pharmacokinetic parameters (except for the drug absorption rate constant) estimated from the total MPA concentrations [25]. In addition to including serum albumin concentration as a covariate for individual pharmacokinetic parameters, the effect of its incorporation into the best base model with an albumin-dependent scaling of concentration was also examined using the following equation:
where Y represents the total MPA concentration and U is the unbound ligand; D is a factor in the relationship between serum albumin and plasma concentrations; ALB is serum albumin concentration in g l−1.
Model evaluation
A non-parametric bootstrap re-sampling method was performed to evaluate the accuracy and stability of the final population pharmacokinetic model. A total of 1000 minimization successful bootstrap samples were generated from the original data set and the final population model was fitted to the bootstrap data sets using the NONMEM program. Parameter estimates of each of the 1000 data sets were re-estimated. For each parameter, the resulting estimates were sorted, and the 2.5th and 97.5th percentiles were obtained as the lower and upper boundaries for the 95% confidence interval (95% CI) of the parameter. The mean parameter estimates obtained by bootstrapping were compared with those obtained by the population pharmacokinetic model to assess the reliability of the final model estimates.
Simulated dose regimens
The final population pharmacokinetic model was used to simulate MPA clearance data sets for 1000 hypothetical patients within the range of this group of children and young people using eight different dosing scenarios (intravenous infusion and oral MMF 10 mg kg−1 with ciclosporin or tacrolimus or intravenous infusion and oral MMF 15 mg kg−1 with ciclosporin or tacrolimus). The proportions of the hypothetical patients with different weights and concomitant ciclosporin (or tacrolimus) who achieved a total MPA AUC(0,24 h) of 60–120 mg l−1 h were determined. The proportions of patients whose total MPA AUC(0,24 h) was below or above the target range were also calculated. This target range was derived from a total MPA AUC(0,12 h) of 30–60 mg l−1 h below which a previously published report suggested that there may be a significant risk of developing acute rejection [26]. A total MPA AUC(0,12 h) of approximately 30–60 mg l−1 h is also a reasonable target for kidney transplantation in both adults [20] and children [18]. A similar therapeutic range for mycophenolic acid was also used in liver transplantation for acute rejection [21, 26] and blood or marrow transplantation for GvHD [27].
Results
Pharmacokinetics
Thirty-eight children and young people aged between 4.8 months and 19.9 years who were receiving MPA after blood or marrow (n = 23), kidney (n = 5) and liver (n = 10) transplantations were recruited into this study. The characteristics of the children and young people who participated in this study are summarized in Table 1. All patients were given MMF via intravenous infusion or oral administration (Table 1). A total of 859 concentration–time measurements were collected from 38 children and young people (Table 1). The number of MPA concentrations per patient ranged from 2 to 49 samples, with a median of 23 samples per patient; 13 patients had intensive sampling (median 34, range 12 to 49) and 25 had sparse or random sampling (median 12, range 2 to 43). A frequency histogram of blood samples collected at specific times during the dose interval is shown in Figure 1. MPA concentrations ranged from 0.07 mg l−1 to 11.1 mg l−1 with a mean of 1.3 ± 1.8 mg l−1 after intravenous dosing and 0.07 mg l−1 to 10.6 mg l−1 with a mean of 1.6 ± 1.9 mg l−1 after oral dosing of MMF.
Table 1.
Characteristics of children and young people receiving MMF by intravenous infusion or oral administration
| Characteristics | Median | Range |
|---|---|---|
| Number of children and young people (MPA concentrations) | 38 (859) | |
| 0 < Age (years) < 2 | 7 (155) | |
| 2 < Age (years) ≤ 5 | 4 (75) | |
| 5 < Age (years) ≤ 12 | 17 (376) | |
| 12 < Age (years) < 20 | 10 (253) | |
| Number who had intravenous dosing | 13 | |
| Number who had oral dosing | 18 | |
| Number who had both intravenous and oral dosing | 7 | |
| Number who had intensive sampling | 13 | |
| Number who had sparse sampling | 7 | |
| Number who had random sampling | 18 | |
| Number who had enterohepatic recirculation | 9 | |
| Transplantation type | ||
| Blood or marrow transplant | 23 | |
| Kidney transplant | 5 | |
| Liver transplant | 10 | |
| Concomitant immunosuppressant | ||
| With ciclosporin | 23 | |
| With tacrolimus | 15 | |
| Concomitant antiviral | ||
| With acyclovir | 9 | |
| Without acyclovir | 29 | |
| Unbound fraction | 0.0116 | 0.0049–0.06 |
| Sex (male/female) | 20/18 | |
| Age (years) | 8.4 | 0.4–19.9 |
| Weight (kg) | 27.9 | 3.4–87.7 |
| Body surface area (m2) | 1.0 | 0.22–2.0 |
| Body mass index (kg m−2) | 17.2 | 11.9–31.8 |
| Height (cm) | 128.6 | 53.5–169.0 |
| Creatinine clearance (l h−1 kg−1)* | 0.12 | 0.01–0.31 |
| Albumin (g l−1)† | 31.0 | 22.0–44.0 |

Figure 1.

Frequency histogram of blood samples collected at specific times during the dose interval
Base model building
A two-compartment pharmacokinetic model with first-order elimination (estimating parameters clearance (CL), inter-compartmental clearance (Q), volume of distribution in the central (V1) and peripheral (V2) compartments, absorption rate constant (ka) and bioavailability (F), with IIV on CL, ka and F, and IOV on CL) was found to provide the best description of the MPA concentration–time data. This model included an exponential error model to estimate residual error. The model with inclusion of IIV on the pharmacokinetic parameters (including V1, V2 and Q) and IOV on V1 was not supported by the data yielding large standard errors for these parameters. The evaluation of a lag time parameter was tested in the present model as the MPA concentration-time plot revealed evidence of a lag time in drug absorption in some population pharmacokinetic studies [28–31]. However, this could not be reliability estimated by the model possibly due to insufficient MPA concentration–time data collected between 0 to 0.5 h after an oral dose.
Covariate analysis
Individual posterior Bayesian estimates of pharmacokinetic parameters generated from the base model were plotted against each covariate. Four covariates were identified as being of interest (Figures 2 and 3). Estimates of mycophenolic acid CL values increased with increasing patient weight (r2 = 0.36), decreased with increasing CLCR (r2 = 0.1), and was greater in patients receiving concomitant ciclosporin when compared with those patients receiving tacrolimus (P < 0.001, Mann–Whitney Test). There was also a trend towards increased MPA CL with reducing serum albumin concentration (r2 = 0.10). Inclusion of these covariates individually significantly reduced OFV by the pre-defined cut-off value of 3.84 (P < 0.05) when tested against the base model. Covariates were not tested on V1, as IIV for V1 was not evaluated in the base model.
Figure 2.
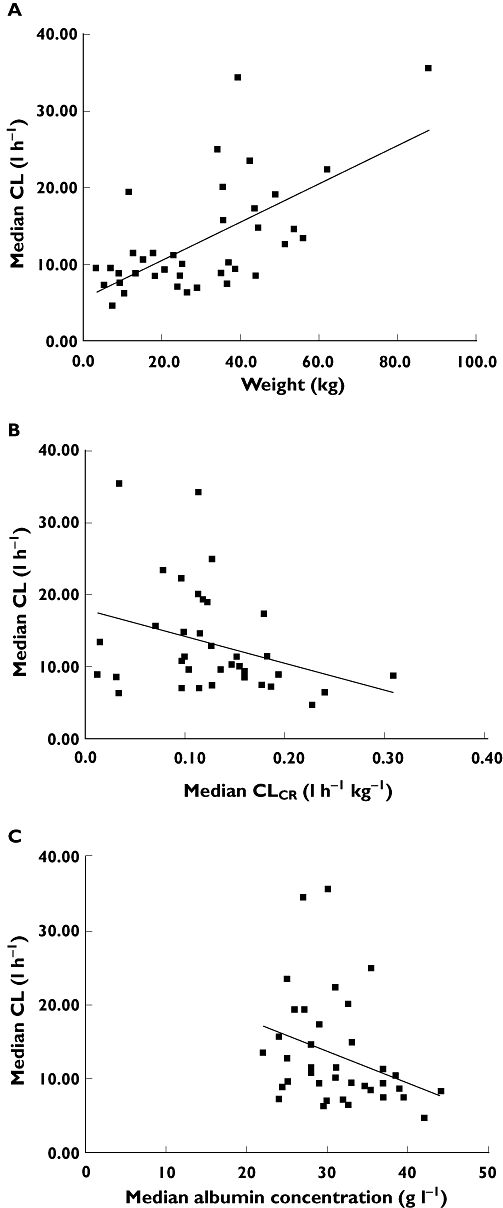
Scatterplots of empirical Bayesian estimates vs. covariates: (A) CL vs. bodyweight, (B) CL vs. CLCR, (C) CL vs. serum albumin concentration
Figure 3.

Empirical Bayesian CL estimates (median value for each individual) vs. concomitant immunosuppressive therapy (ciclosporin vs. tacrolimus)
The inclusion of total bodyweight as a covariate on CL was found to be statistically significant (ΔOFV = −17.40), with a reduction of IIV in CL from 54.3% to 36.9%. While the effect of bodyweight scaled using an allometric function in which the exponent was fixed to 0.75 was found to reduce the IIV in CL from 54.3% to 46.8% (ΔOFV = −4.92), this was less significant that the effect of total body weight. The inclusion of concomitant ciclosporin on mycophenolic acid CL was found to reduce the IIV in CL from 54.3% to 45.3% (ΔOFV = −18.24). The consideration of estimated CLCR and serum albumin concentration on CL were also found to be statistically significant, with a decrease in OFV by 5.17 and 7.86 points, respectively, and the IIV in CL was reduced to 44.7% and 50.5%, respectively.
In the forward stepwise modelling building approach, the cumulative inclusion of bodyweight and concomitant ciclosporin reduced the OFV by 39.78 and IIV in CL reduced from 54.3% to 31.6%, without increasing variability in other parameter estimates. Inclusion of CLCR and/or serum albumin concentration in this covariate model did not result in a further statistically significant reduction in OFV or IIV in CL. Finally, in the backward elimination step, removal of bodyweight and concomitant ciclosporin in order resulted in an increase in the OFV of 21.54 and 22.38, respectively. The model-building process is summarized in Table 2.
Table 2.
Successful base and covariate population pharmacokinetic models for MPA
| Model number | Covariate | Model | Compared against | OFV | ΔOFV | P |
|---|---|---|---|---|---|---|
| One compartment | ||||||
| 1 | Base model | CL = θ1× EXP(IIV + IOV) | −207.92 | |||
| V = θ2× EXP(IIV) | ||||||
| Two compartment | ||||||
| 2 | Base model | CL = θ1× EXP(IIV + IOV) | 1 | −457.85 | −249.93 | <0.001 |
| V1 = θ2× EXP(IIV) | ||||||
| Q = θ3× EXP(IIV) | ||||||
| V2 = θ4× EXP(IIV) | ||||||
| 3 | Bodyweight on CL | CL = θ1× (1 +θ7× WT/27.9) × EXP(IIV + IOV) | 2 | −475.25 | −17.40 | <0.001 |
| V1 = θ2× EXP(IIV) | ||||||
| Q = θ3× EXP(IIV) | ||||||
| V2 = θ4× EXP(IIV) | ||||||
| 4 | Concomitant ciclosporin on CL | CL = θ1× (1 +θ7× WT/27.9) × (1 +θ8× CYTA) × EXP(IIV + IOV) | 3 | −497.63 | −22.38 | <0.001 |
| V1 = θ2× EXP(IIV) | ||||||
| Q = θ3× EXP(IIV) | ||||||
| V2 = θ4× EXP(IIV) |
OFV, NONMEM derived objective function value; WT, bodyweight; CYTA, concomitant ciclosporin (CYTA = 0 if the patient taking ciclosporin, CYTA = 1 if without ciclosporin while taking tacrolimus); CL, clearance; Q, inter-compartmental clearance; V1, volume of distribution in the central compartment; V2, volume of distribution in the peripheral compartment. The population CL term was standardized to 27.9 kg, which represents the median value of weight in this study group.
As an alternative to modelling the effect of serum albumin concentration as a covariate on CL, its incorporation as an albumin-dependent scaling of concentration was also examined. This resulted in an OFV reduction of 24.99 points. This model yielded a typical (SE%) population CL of 44.4 l h−1 (288%), Q of 14.7 l h−1 (259%), V1 of 30.6 l (228%), V2 of 69.3 l (251%), ka of 0.322 (18%), F of 0.618 (27%) and albumin factor of 0.129 (233%). These values were estimated with a much higher degree of uncertainty and the model had very wide 95% confidence intervals for CL, Q, V1 and V2 during bootstrapping. For this reason this model was not evaluated further.
The final covariate model for MPA CL was:
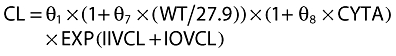 |
The population pharmacokinetic parameters estimated from the base and final models are presented in Table 3. The population mean estimates of CL, Q, V1, V2, ka, F, θ7 and θ8 from the final model were 6.42 l h−1 (14.7 l h−1 with ciclosporin, 5.5 l h−1 with tacrolimus), 3.74 l h−1, 7.24 l, 16.80 l, 0.39 h−1, 0.48, 1.09 and −0.60, respectively, and estimates of IIV were 31.6% for CL, 59.1% for ka, 34.6% for F, respectively. The IOV estimate was 5.8% for CL. Figure 4 displays the diagnostic plots for the base and final models. The residual variability in the final model was reduced compared with the base model. The population-predicted concentrations were symmetrically distributed around the line of identity, indicating that the model adequately describes the concentration–time profile of MPA at the doses studied. The representative observed and model-predicted concentration–time profiles for two typical patients treated with an intravenous infusion of MMF at a dose of 10 mg kg−1 or oral MMF dose of 15 mg kg−1, respectively, are shown in Figure 5 and show a satisfactory model fit.
Table 3.
Population pharmacokinetic parameter estimates derived from the base and the final models with their relative standard error (RSE%) and the parameter estimates from 1000 successful bootstrap replicates with 95% confidence interval (CI)
| Base model | Final model | 1000 bootstrap runs | ||||
|---|---|---|---|---|---|---|
| Parameter | Mean | RSE % | Mean | RSE % | Mean | 95% CI* |
| Fixed effects | ||||||
| CL (l h−1) | 11.3 | 33 | 6.42 (14.74†/5.51‡) | 34 | 6.93 | 3.64, 12.8 |
| Q (l h−1) | 3.93 | 47 | 3.74 | 46 | 3.89 | 1.66, 7.21 |
| V1 (l) | 7.86 | 55 | 7.24 | 55 | 8.20 | 2.90, 18.5 |
| V2 (l) | 18.10 | 54 | 16.80 | 52 | 17.8 | 5.79, 34.9 |
| ka (h−1) | 0.33 | 20 | 0.39 | 20 | 0.42 | 0.27, 0.71 |
| F | 0.64 | 36 | 0.48 | 32 | 0.50 | 0.27, 0.82 |
| Weight factor | – | – | 1.09 | 30 | 1.06 | 0.42, 1.80 |
| Concomitant ciclosporin factor | – | – | −0.60 | 10 | −0.61 | −0.73, −0.48 |
| Interindividual variability | ||||||
| ωCL (CV%) | 54.3 | 24 | 31.6 | 26 | 30.0 | 20.8, 38.3 |
| ωQ (CV%) | – | – | – | – | – | – |
| ωV1 (CV%) | – | – | – | – | – | – |
| ωV2 (CV%) | – | – | – | – | – | – |
| ωka (CV%) | 61.1 | 87 | 59.1 | 79 | 57.0 | 9.5, 116.6 |
| ωF (CV%) | 49.0 | 54 | 34.6 | 59 | 33.0 | 10.2, 58.7 |
| Interoccasion variability | ||||||
| πCL (CV%) | 5.9 | 112 | 5.8 | 105 | 5.0 | 0.1, 9.1 |
| πV1 (CV%) | – | – | – | – | – | – |
| Random residual variability | ||||||
| σ1 | 0.48 | 14 | 0.48 | 14 | 0.47 | 0.40, 0.53 |
RSE, relative standard error; CL, clearance; Q, inter-compartmental clearance; V1 volume of distribution in central compartment; V2 volume of distribution in peripheral compartment; ka absorption rate constant; F bioavailability; σ1 residual variability.
Percentile bootstrap 95% CI corresponding to parameter estimates at the 2.5th and 97.5th percentiles of bootstrap runs.
Concomitant ciclosporin
Concomitant tacrolimus.
Figure 4.

Observed MPA concentrations vs. population predicted concentrations using the base and final population pharmacokinetic models (the line is the regression line)
Figure 5.

Concentration–time profile of MPA predicted by the final model in two representative patients following intravenous and oral administration of MMF
Model evaluation
From the original data set, 1000 minimization successful data sets (72%) were generated using a bootstrapping approach. The mean values for all fixed effects parameters and the mean values for random effects parameters were within ±15% of those obtained by the NONMEM final model, indicating good reliability of this model. Table 3 presents the results of the bootstrap procedure with parameters, presented as the mean and 95% CI.
Simulation
The results of the simulated dose regimens are shown in Tables 4 and 5. In the ‘simulated’ children who received MMF with concomitant ciclosporin, orally administered MMF (10 mg kg−1 or 15 mg kg−1) three times daily was associated with the lowest proportion of children achieving the target total MPA AUC range 60–120 mg l−1 h (less than 24%). A large proportion (more than 93% of children when having an intravenous infusion MMF and more than 97% of children when having oral MMF) of light children who weighed 10 kg achieved total MPA AUC(0,24 h) at steady-state of less than 60 mg l−1 h suggesting that dose increases may be beneficial. The children who weigh 50 kg may also benefit from dose (based on mg kg−1) increases when receiving oral MMF three times daily, since more than 70% of children achieved total MPA AUC(0,24 h) at steady-state of less than 60 mg l−1 h.
Table 4.
The percentage of children who achieved total MPA AUC(0,24 h) values below, within and above the daily target range of a 60–120 mg l−1 h, calculated by 1000 simulations for children with different bodyweights and concomitant ciclosporin (tacrolimus) when given 10 mg kg−1 intravenous infusion or oral doses of MMF
| Intravenous infusion or oral MMF 10 mg kg−1 | ||||||
| Weight | Concomitant treatment with ciclosporin | |||||
| Intravenous infusion MMF three times daily | Oral MMF three times daily | |||||
| Total MPA AUC(0,24 h) (mg l−1 h) | Total MPA AUC(0,24 h) (mg l−1 h) | |||||
| <60 mg l−1 h | 60–120 mg l−1 h | >120 mg l−1 h | <60 mg l−1 h | 60–120 mg l−1 h | >120 mg l−1 h | |
| 10 kg | 99.7% | 0.3% | 0.0% | 99.4% | 0.5% | 0.1% |
| 25 kg | 84.0% | 15.8% | 0.2% | 94.8% | 4.7% | 0.5% |
| 50 kg | 52.1% | 46.3% | 1.6% | 87.3% | 11.4% | 1.3% |
| Concomitant treatment with tacrolimus | ||||||
| Intravenous infusion MMF twice daily | Oral MMF twice daily | |||||
| Total MPA AUC(0,24 h) (mg l−1 h) | Total MPA AUC(0,24 h) (mg l−1 h) | |||||
| <60 mg l−1 h | 60–120 mg l−1 h | >120 mg l−1 h | <60 mg l−1 h | 60–120 mg l−1 h | >120 mg l−1 h | |
| 10 kg | 87.4% | 12.5% | 0.1% | 95.4% | 4.2% | 0.4% |
| 25 kg | 24.6% | 69.9% | 6.5% | 77.9% | 19.1% | 3.0% |
| 50 kg | 6.0% | 66.7% | 27.3% | 62.7% | 30.2% | 7.1% |
Table 5.
The percentage of children who achieved total MPA AUC(0,24 h) values below, within and above the daily target range of a 60–120 mg l−1 h, calculated by 1000 simulations for children with different bodyweights and concomitant ciclosporin (tacrolimus) when given 15 mg kg−1 intravenous infusion or oral MMF
| Intravenous infusion or oral MMF 15 mg kg−1 | ||||||
| Weight | Concomitant treatment with cyclosporine | |||||
| Intravenous infusion MMF three times daily | Oral MMF three times daily | |||||
| Total MPA AUC(0,24 h) (mg l−1 h) | Total MPA AUC(0,24 h) (mg l−1 h) | |||||
| <60 mg l−1 h | 60–120 mg l−1 h | >120 mg l−1 h | <60 mg l−1 h | 60–120 mg l−1 h | >120 mg l−1 h | |
| 10 kg | 92.9% | 7.1% | 0.0% | 96.7% | 3.2% | 0.1% |
| 25 kg | 38.1% | 58.8% | 3.1% | 83.5% | 14.6% | 1.9% |
| 50 kg | 12.0% | 71.7% | 16.3% | 70.4% | 24.3% | 5.3% |
| Concomitant treatment with tacrolimus | ||||||
| Intravenous infusion MMF twice daily | Oral MMF twice daily | |||||
| Total MPA AUC(0,24 h) (mg l−1 h) | Total MPA AUC(0,24 h) (mg l−1 h) | |||||
| <60 mg l−1 h | 60–120 mg l−1 h | >120 mg l−1 h | <60 mg l−1 h | 60–120 mg l−1 h | >120 mg l−1 h | |
| 10 kg | 43.4% | 54.0% | 2.6% | 84.9% | 13.4% | 1.7% |
| 25 kg | 2.8% | 56.1% | 41.1% | 55.7% | 33.7% | 10.6% |
| 50 kg | 0.4% | 23.8% | 75.8% | 40.1% | 37.5% | 22.4% |
In the ‘simulated’ children who had MMF with concomitant tacrolimus, orally administered MMF (10 mg kg−1 or 15 mg kg−1) twice daily was associated with a greater proportion of the children achieving the target total MPA AUC range 60–120 mg l−1 h when compared with the oral dose regimen of MMF co-administered with ciclosporin, however, there was still a tendency for light children who weighed 10 kg to have lower MPA exposure (more than 85%), suggesting that dose increases may be required for these patients to achieve the target exposure. Total MPA AUC(0,24 h) values at steady-state of greater than 120 mg l−1 h were achieved by a large proportion (76%) of children in weighing more than 50 kg, receiving an intravenous infusion MMF (15 mg kg−1) twice daily with concomitant tacrolimus, which may increase the risk of MPA related toxicity [32].
Discussion
This study is one of the first investigations in which a population pharmacokinetic modelling approach was applied to assess the pharmacokinetics of both intravenous and oral MMF in children and young people undergoing blood or marrow and solid organ transplantation. Recruitment of patients was a challenging aspect of this study, so data from three groups of patients (blood or marrow/kidney/liver transplant recipients) were combined to increase the power to detect significant covariate effects and to better estimate the population pharmacokinetic parameters. The largest subgroup were the blood or marrow transplant recipients (n = 23), but this number was still insufficient to provide meaningful results when analyzed and reported separately. In this study considerable inter-individual variability in the pharmacokinetics of MPA was observed. After systematically evaluating a range of patient characteristics and clinical factors, it was found that bodyweight and concomitant ciclosporin had a significant influence on the MPA CL. Inclusion of these factors, which described IIV in these parameters, significantly improved the population pharmacokinetic model performance based on the likelihood ratio test.
In children, MPA CL has been correlated with weight and MMF dosage recommendations in children and young people are based on weight. In the present study children and young people had a broad weight range (3.4–87.7 kg), and there was a clear trend towards increased MPA CL with increasing bodyweight. The inclusion of weight into the population model resulted in a large reduction in IIV in CL from 54.3% to 36.9%.
Concomitant ciclosporin did prove to be a significant covariate in the final population pharmacokinetic model. Ciclosporin inhibits the transport of MPAG from hepatocytes into the bile resulting in decreased enterohepatic circulation [10, 33]. The study performed by van Gelder et al. [33] showed that MPA concentrations during MMF treatment alone were not significantly different from MPA concentrations during tacrolimus co-administered treatment. In this study, co-administered ciclosporin as opposed to tacrolimus resulted in a mean increase in MPA CL of 63%.
Renal excretion is reported to be one of the elimination pathways for MPA [9] and impaired renal function has been reported to influence MPA disposition [34]. Poor renal function can reduce the renal excretion of MPAG that is believed to compete with MPA for protein binding sites [6]. In the present study, a trend towards a lower normalized CLCR with an increased MPA CL was evident. The physiological plausibility of this observation was unclear but may relate to other clinical effects associated with renal impairment (and renal excretion) impacting on MPA pharmacokinetics. However, this covariate did not reach statistical significance and was not included in the final pharmacokinetic model. It is likely that the effect of renal impairment on MPA pharmacokinetics could not be reliably reported in this group of children and young people because of lack of patients with poor renal function.
MPA and MPAG are highly bound to human serum albumin [6] and may be altered in patients with severe renal impairment, liver disease and hypoalbuminaemia [32]. In the present study, a weak trend towards a decreased MPA CL for patients with higher serum albumin concentrations was identified. However, this relationship did not reach statistical significance in the final population pharmacokinetic model. MPA unbound fraction was also tested as a potential covariate, but it was not significant in the individual covariate screen. In theory, changes in MPA unbound fraction due to changes in albumin concentration have the potential to influence all pharmacokinetic parameters except those only involved with drug absorption [25]. The inclusion of albumin concentration as an albumin-dependent scaling of MPA concentration, rather than as a covariate on CL, resulted in parameter values with a high degree of uncertainty. Concentration–time data collected in this study may not be sufficient to characterize the influence of serum albumin concentration on all pharmacokinetic parameters simultaneously.
This study also evaluated the possible impact of concomitant administration of acyclovir on MPA CL but found no significant effects. It is consistent with previous reports that no statistically significant difference in the pharmacokinetic parameters of MPA was observed with co-administration of acyclovir [9, 35].
Transplantation type (blood or marrow, kidney and liver transplantation) was also evaluated as a possible covariate. However, the number of each transplant type was not high enough to demonstrate statistical significance.
The previous studies reported the high variability of MMF bioavailability in different populations including healthy volunteers, kidney transplant recipients, liver transplant recipients and non-myeloablative haematopoietic cell transplant recipients [4, 36–38]. The possible reasons for high variability include preparative regimen-induced gastrointestinal damage, underlying poor absorptive processes due to previous standard chemotherapy and chronic illness, and/or reduced enterohepatic recirculation (e.g. concomitant ciclosporin use) [37, 38]. Interestingly, MMF bioavailability was 48% in this study cohort when estimated using the final model. This suggests that higher oral MMF doses may be required to provide equivalent exposure as intravenous doses.
The occurrence of enterohepatic recirculation could only be studied in those 13 patients that underwent intensive sampling and was found in nine of these patients. The extent of enterohepatic recirculation of MMF may be dependent on each individual's post-surgical state and co-administered medication, but could not be modelled further in this study given the limited number of patients. This has the potential to lead to the inflation of the residual variability in the final model.
To date, seven population pharmacokinetic analyses (using NONMEM software) of MPA have been published. Five of these studies were performed in adult kidney transplant recipients [25, 29, 30, 39, 40], one in paediatric and adolescent renal transplant recipients [28] and another in healthy volunteers [31]. Previous population pharmacokinetic studies involved only oral administration of MMF. A two-compartment pharmacokinetic model was selected to describe MPA pharmacokinetics. Mean MPA CL/F estimates ranged from 14.1 to 34.9 l h−1 in adults receiving concomitant cyclosporine and from 11.9 to 25.4 l h−1 in adults receiving co-administration of tacrolimus. Bodyweight, serum albumin concentration and concomitant ciclosporine were the covariates mostly identified. Complex absorption and enterohepatic recirculation of MPA has made population modelling challenging. The only previously reported paediatric population pharmacokinetic analysis of MPA was performed in 41 children and adolescents (2–21 years) following oral administration of MMF [28]. In the study by Payen et al. bodyweight was found to have significant effects on the apparent volume of distribution of MPA in the central compartment [28]. The present study performed in 38 children and young people after intravenous infusion and oral doses of MMF showed comparable estimates of pharmacokinetic parameters to the study by Payen et al. [28]. Bodyweight and concomitant ciclosporin were identified as influential covariates. The bioavailability was also able to be evaluated in the present study.
As the pharmacokinetics of MPA exhibits wide inter-individual variability and concomitant ciclosporine has an influence on MPA pharmacokinetics, it is possible that the clinical outcomes of MPA could be improved with therapeutic drug monitoring (TDM) [26]. A total MPA AUC(0,12 h) of approximately 30–60 mg l−1 h was reported to be a reasonable target for the early renal post-transplant period in both adults [20] and children [18]. Although inter-individual variability of MPA exposure in patients undergoing liver transplantation is at least as pronounced as that seen after kidney transplantation [19], there are limited data to provide guidelines for TDM of MPA after liver transplantation [41, 42] and more investigation is needed. For now, it is recommended that similar targets are used to those in kidney transplantation [21, 26].
Target values for MPA TDM cannot be definitely recommended in blood or marrow transplant recipients until more data are published from clinical studies that provide definitive guidelines in this patient population. Haentzschel et al. [27] individualized MMF dose regimens for GvHD prophylaxis in 29 patients after allogeneic blood stem cell transplantation using similar MPA concentration targets as in kidney transplantation. It is suggested that targeting of individual MMF doses is feasible in the early phase after allogeneic blood stem cell transplantation. Given the lack of an established TDM concentration target range for this group of patients, we did not believe it appropriate to suggest dosing guidelines. Instead, we used a simulation approach to evaluate current dosing schedules according to agreed MPA AUC target ranges.
In this study, children and young people were given a 10–15 mg kg−1 intravenous infusion or an oral MMF dose. To investigate the suitability of MMF dosing regimens in children and young people a simulation study was employed using the final validated population pharmacokinetic model. The simulation results showed that the dosing regimens may not be optimal for achieving MPA TDM targets associated with the prevention of acute rejection or GvHD in all children and young people according to these criteria (bodyweight and concomitant ciclosporin). Children who weigh below 10 kg are relatively under-dosed and may be at a greater risk of acute rejection [43] while heavier children (who weigh over 50 kg) may be at greater risk of developing adverse reactions [32] after intravenous infusion of MMF co-administered with tacrolimus. Filler et al. [43] found a significant correlation between the dose-normalized exposure and age when studying 27 children and young people (age 1.8–20.7 years) receiving a combination therapy of MMF and tacrolimus. The data showed that young children under 2 years of age required twice the amount of MMF in combination with tacrolimus when compared with adolescents. Overall, rational dosing strategies for MMF need be considered for children and young people on the basis of bodyweight and concomitant therapy.
The data about the therapeutic drug monitoring of unbound MPA AUC are limited in solid organ transplant recipients and therapeutic unbound targets are undefined, although data suggest that an unbound AUC(0,12 h) greater than 400 ng ml−1 h is associated with greater haematologic toxicity in paediatric kidney transplant recipients [12]. A relationship between MPA unbound AUC and the clinical outcome after hematopoietic cell transplantation has been defined recently by Jacobson et al. [44] in a pharmacokinetic and pharmacodynamic study involving 87 adult patients undergoing non-myeloablative-related and non-myeloablative-unrelated hematopoietic cell transplantation who were receiving 1 g MMF orally or intravenously every 12 h with concomitant ciclosporin. The patients with an unbound MPA AUC(0,6 h) of less than 150 ng ml−1 h had a higher cumulative incidence of grade II-IV acute GvHD than the patients with a greater AUC (68% vs. 40%, P = 0.02). An unbound AUC(0,12 h) of less than 300 ng ml−1 h was also associated with more frequent acute GvHD (58% vs. 35%, P = 0.05). The unbound MPA population pharmacokinetics and the unbound therapeutic targets will be explored in this group of children and young people in future studies.
In conclusion, a two-compartment pharmacokinetic model describing the concentration–time profile of MPA after intravenous infusion and oral dosing of MMF has been developed and evaluated in children and young people undergoing blood or marrow and solid organ transplantation. Bodyweight and concomitant ciclosporin were found to influence MPA clearance. The current dose regimens may not be optimal for achieving MPA TDM targets associated with the prevention of acute rejection or GvHD in all children and young people. It is possible to use this population pharmacokinetic model in conjunction with MPA efficacy data to develop an optimal dosing strategy to ensure that children and young people achieve the maximal immunosuppressant efficacy of MPA.
Competing interests
There are no competing interests to declare.
Lihua Zeng is supported, in part, by a NHMRC Project Grant 396702. Dr Christa Nath is supported by the Leukaemia Research Support Fund of The Children's Hospital Westmead. The authors thank the nurses and allied clinical staff in the Children's Hospital at Westmead for taking blood samples and for patient care and the patients and their families for taking part in this study.
REFERENCES
- 1.Nash RA, Johnston L, Parker P, McCune JS, Storer B, Slattery JT, Furlong T, Anasetti C, Appelbaum FR, Lloid ME, Deeg HJ, Kiem HP, Martin PJ, Schubert MM, Witherspoon RP, Forman SJ, Blume KG, Storb R. A phase I/II study of mycophenolate mofetil in combination with cyclosporine for prophylaxis of acute graft-versus-host disease after myeloablative conditioning and allogeneic hematopoietic cell transplantation. Biol Blood Marrow Transplant. 2005;11:495–505. doi: 10.1016/j.bbmt.2005.03.006. [DOI] [PubMed] [Google Scholar]
- 2.Srinivas TR, Kaplan B, Meier-Kriesche HU. Mycophenolate mofetil in solid-organ transplantation. Expert Opin Pharmacother. 2003;4:2325–45. doi: 10.1517/14656566.4.12.2325. [DOI] [PubMed] [Google Scholar]
- 3.Young CJ, Sollinger HW. RS-61443: a new immunosuppressive agent. Transplant Proc. 1994;26:3144–6. [PubMed] [Google Scholar]
- 4.Bullingham RE, Monroe S, Nicholls A, Hale M. Pharmacokinetics and bioavailability of mycophenolate mofetil in healthy subjects after single-dose oral and intravenous administration. J Clin Pharmacol. 1996a;36:315–24. doi: 10.1002/j.1552-4604.1996.tb04207.x. [DOI] [PubMed] [Google Scholar]
- 5.Bullingham RE, Nicholls A, Hale M. Pharmacokinetics of mycophenolate mofetil (RS61443): a short review. Transplant Proc. 1996b;28:925–9. [PubMed] [Google Scholar]
- 6.Nowak I, Shaw LM. Mycophenolic acid binding to human serum albumin: characterization and relation to pharmacodynamics. Clin Chem. 1995;41:1011–7. [PubMed] [Google Scholar]
- 7.Nowak I, Shaw LM. Effect of mycophenolic acid glucuronide on inosine monophosphate dehydrogenase activity. Ther Drug Monit. 1997;19:358–60. doi: 10.1097/00007691-199706000-00018. [DOI] [PubMed] [Google Scholar]
- 8.Bowalgaha K, Miners JO. The glucuronidation of mycophenolic acid by human liver, kidney and jejunum microsomes. Br J Clin Pharmacol. 2001;52:605–9. doi: 10.1046/j.0306-5251.2001.01487.x. [DOI] [PMC free article] [PubMed] [Google Scholar]
- 9.Bullingham RE, Nicholls AJ, Kamm BR. Clinical pharmacokinetics of mycophenolate mofetil. Clin Pharmacokinet. 1998;34:429–55. doi: 10.2165/00003088-199834060-00002. [DOI] [PubMed] [Google Scholar]
- 10.Kobayashi M, Saitoh H, Kobayashi M, Tadano K, Takahashi Y, Hirano T. Cyclosporine A, but not tacrolimus, inhibits the biliary excretion of mycophenolic acid glucuronide possibly mediated by multidrug resistance-associated protein 2 in rats. J Pharmacol Exp Ther. 2004;309:1029–35. doi: 10.1124/jpet.103.063073. [DOI] [PubMed] [Google Scholar]
- 11.CellCept®. Approved Product Information. Australia: Roche Products Pty. Ltd; 2009. [Google Scholar]
- 12.Weber LT, Shipkova M, Armstrong VW, Wagner N, Schutz E, Mehls O, Zimmerhackl LB, Oellerich M, Tonshoff B. The pharmacokinetic-pharmacodynamic relationship for total and free mycophenolic acid in pediatric renal transplant recipients: a report of the German study group on mycophenolate mofetil therapy. J Am Soc Nephrol. 2002;13:759–68. doi: 10.1681/ASN.V133759. [DOI] [PubMed] [Google Scholar]
- 13.Weber LT, Hoecker B, Armstrong VW, Oellerich M, Tonshoff B. Long-term pharmacokinetics of mycophenolic acid in pediatric renal transplant recipients over 3 years posttransplant. Ther Drug Monit. 2008;30:570–5. doi: 10.1097/FTD.0b013e31818752d9. [DOI] [PubMed] [Google Scholar]
- 14.Lobritto SJ, Rosenthal P, Bouw R, Leung M, Snell P, Mamelok RD. Pharmacokinetics of mycophenolate mofetil in stable pediatric liver transplant recipients receiving mycophenolate mofetil and cyclosporine. Liver Transpl. 2007;13:1570–5. doi: 10.1002/lt.21274. [DOI] [PubMed] [Google Scholar]
- 15.Jacobson P, Huang J, Rydholm N, Tran M, Defor T, Tolar J, Orchard PJ. Higher mycophenolate dose requirements in children undergoing hematopoietic cell transplant (HCT) J Clin Pharmacol. 2008;48:485–94. doi: 10.1177/0091270007313326. [DOI] [PubMed] [Google Scholar]
- 16.Jain A, Venkataramanan R, Hamad IS, Zuckerman S, Zhang S, Lever J, Warty VS, Fung JJ. Pharmacokinetics of mycophenolic acid after mycophenolate mofetil administration in liver transplant patients treated with tacrolimus. J Clin Pharmacol. 2001;41:268–76. doi: 10.1177/00912700122010087. [DOI] [PubMed] [Google Scholar]
- 17.Jenke A, Renner U, Richte M, Freiberg-Richter J, Platzbecker U, Helwig A, Thiede HM, Schafer-Eckart K, Ehninger G, Bornhauser M. Pharmacokinetics of intravenous mycophenolate mofetil after allogeneic blood stem cell transplantation. Clin Transplant. 2001;15:176–84. doi: 10.1034/j.1399-0012.2001.150306.x. [DOI] [PubMed] [Google Scholar]
- 18.Oellerich M, Shipkova M, Schutz E, Wieland E, Weber L, Tonshoff B, Armstrong VW, German Study Group on Mycophenolate Mofetil Therapy in Pediatric Renal Transplant Recipients Pharmacokinetic and metabolic investigations of mycophenolic acid in pediatric patients after renal transplantation: implications for therapeutic drug monitoring. Ther Drug Monit. 2000;22:20–6. doi: 10.1097/00007691-200002000-00004. [DOI] [PubMed] [Google Scholar]
- 19.Shaw LM, Korecka M, Venkataramanan R, Goldberg L, Bloom R, Brayman KL. Mycophenolic acid pharmacodynamics and pharmacokinetics provide a basis for rational monitoring strategies. Am J Transplant. 2003;3:534–42. doi: 10.1034/j.1600-6143.2003.00079.x. [DOI] [PubMed] [Google Scholar]
- 20.Hale MD, Nicholls AJ, Bullingham RE, Hene R, Hoitsma A, Squifflet JP, Weimar W, Vanrenterghem Y, Van de Woude FJ, Verpooten GA. The pharmacokinetic-pharmacodynamic relationship for mycophenolate mofetil in renal transplantation. Clin Pharmacol Ther. 1998;64:672–83. doi: 10.1016/S0009-9236(98)90058-3. [DOI] [PubMed] [Google Scholar]
- 21.Shaw LM, Holt DW, Oellerich M, Meiser B, van Gelder T. Current issues in therapeutic drug monitoring of mycophenolic acid: report of a roundtable discussion. Ther Drug Monit. 2001;23:305–15. doi: 10.1097/00007691-200108000-00001. [DOI] [PubMed] [Google Scholar]
- 22.Thomson AH, Whiting B. Bayesian parameter estimation and population pharmacokinetics. Clin Pharmacokinet. 1992;22:447–67. doi: 10.2165/00003088-199222060-00004. [DOI] [PubMed] [Google Scholar]
- 23.Zeng L, Nath CE, Shaw PJ, Earl JW, McLachlan AJ. 2008. HPLC-UV assay for monitoring total and unbound mycophenolic acid concentrations in children. Biomed Chromatogr. 2009;23:92–100. doi: 10.1002/bmc.1088. [DOI] [PubMed] [Google Scholar]
- 24.Counahan R, Chantler C, Ghazali S, Kirkwood B, Rose F, Barratt TM. Estimation of glomerular filtration rate from plasma creatinine concentration in children. Arch Dis Child. 1976;51:875–8. doi: 10.1136/adc.51.11.875. [DOI] [PMC free article] [PubMed] [Google Scholar]
- 25.Staatz CE, Duffull SB, Kiberd B, Fraser AD, Tett SE. Population pharmacokinetics of mycophenolic acid during the first week after renal transplantation. Eur J Clin Pharmacol. 2005;61:507–16. doi: 10.1007/s00228-005-0927-4. [DOI] [PubMed] [Google Scholar]
- 26.van Gelder T, Le Meur Y, Shaw LM, Oellerich M, DeNofrio D, Holt C, Holt DW, Kaplan B, Kuypers D, Meiser B, Toenshoff B, Mamelok RD. Therapeutic drug monitoring of mycophenolate mofetil in transplantation. Ther Drug Monit. 2006;28:145–54. doi: 10.1097/01.ftd.0000199358.80013.bd. [DOI] [PubMed] [Google Scholar]
- 27.Haentzschel I, Freiberg-Richter J, Platzbecker U, Kiani A, Schetelig J, Illmer T, Ehninger G, Schleyer E, Bornhauser M. Targeting mycophenolate mofetil for graft-versus-host disease prophylaxis after allogeneic blood stem cell transplantation. Bone Marrow Transplant. 2008;42:113–20. doi: 10.1038/bmt.2008.85. [DOI] [PubMed] [Google Scholar]
- 28.Payen S, Zhang D, Maisin A, Popon M, Bensman A, Bouissou F, Loirat C, Gomeni R, Bressolle F, Jacqz-Aigrain E. Population pharmacokinetics of mycophenolic acid in kidney transplant pediatric and adolescent patients. Ther Drug Monit. 2005;27:378–88. doi: 10.1097/01.ftd.0000159784.25872.f6. [DOI] [PubMed] [Google Scholar]
- 29.Shum B, Duffull SB, Taylor PJ, Tett SE. Population pharmacokinetic analysis of mycophenolic acid in renal transplant recipients following oral administration of mycophenolate mofetil. Br J Clin Pharmacol. 2003;56:188–97. doi: 10.1046/j.1365-2125.2003.01863.x. [DOI] [PMC free article] [PubMed] [Google Scholar]
- 30.van Hest RM, van Gelder T, Vulto AG, Mathot RA. Population pharmacokinetics of mycophenolic acid in renal transplant recipients. Clin Pharmacokinet. 2005;44:1083–96. doi: 10.2165/00003088-200544100-00006. [DOI] [PubMed] [Google Scholar]
- 31.Zheng J, Ding JJ, Shen J, Liang HQ, Zhong LJ, Wang Y, Zhong MK, Lu WY. Population pharmacokinetic modelling for enterohepatic circulation of mycophenolic acid in healthy Chinese and the influence of polymorphisms in UGT1A9. Br J Clin Pharmacol. 2008;65:893–907. doi: 10.1111/j.1365-2125.2008.03109.x. [DOI] [PMC free article] [PubMed] [Google Scholar]
- 32.Staatz CE, Tett SE. Clinical pharmacokinetics and pharmacodynamics of mycophenolate in solid organ transplant recipients. Clin Pharmacokinet. 2007;46:13–58. doi: 10.2165/00003088-200746010-00002. [DOI] [PubMed] [Google Scholar]
- 33.van Gelder T, Klupp J, Barten MJ, Christians U, Morris RE. Comparison of the effects of tacrolimus and cyclosporine on the pharmacokinetics of mycophenolic acid. Ther Drug Monit. 2001;23:119–28. doi: 10.1097/00007691-200104000-00005. [DOI] [PubMed] [Google Scholar]
- 34.Meier-Kriesche HU, Shaw LM, Korecka M, Kaplan B. Pharmacokinetics of mycophenolic acid in renal insufficiency. Ther Drug Monit. 2000;22:27–30. doi: 10.1097/00007691-200002000-00005. [DOI] [PubMed] [Google Scholar]
- 35.Gimenez F, Foeillet E, Bourdon O, Weller S, Garret C, Bidault R, Singlas E. Evaluation of pharmacokinetic interactions after oral administration of mycophenolate mofetil and valacyclovir or acyclovir to healthy subjects. Clin Pharmacokinet. 2004;43:685–92. doi: 10.2165/00003088-200443100-00004. [DOI] [PubMed] [Google Scholar]
- 36.Pescovitz MD, Conti D, Dunn J, Gonwa T, Halloran P, Sollinger H, Tomlanovich S, Weinstein S, Inokuchi S, Kiberd B, Kittur D, Merion RM, Norman D, Shoker A, Wilburn R, Nicholls AJ, Arterburn S, Dumont E. Intravenous mycophenolate mofetil: safety, tolerability, and pharmacokinetics. Clin Transplant. 2000;14:179–88. doi: 10.1034/j.1399-0012.2000.140301.x. [DOI] [PubMed] [Google Scholar]
- 37.Jain A, Venkataramanan R, Kwong T, Mohanka R, Orloff M, Abt P, Kashyap R, Tsoulfas G, Mack C, Williamson M, Batzold P, Bozorgzadeh A. Pharmacokinetics of mycophenolic acid in liver transplant patients after intravenous and oral administration of mycophenolate mofetil. Liver Transpl. 2007;13:791–6. doi: 10.1002/lt.21146. [DOI] [PubMed] [Google Scholar]
- 38.Jacobson P, Green K, Rogosheske J, Brunstein C, Ebeling B, DeFor T, McGlave P, Weisdorf D. Highly variable mycophenolate mofetil bioavailability following nonmyeloablative hematopoietic cell transplantation. J Clin Pharmacol. 2007;47:6–12. doi: 10.1177/0091270006295064. [DOI] [PubMed] [Google Scholar]
- 39.Cremers S, Schoemaker R, Scholten E, den Hartigh J, Konig-Quartel J, van Kan E, Paul L, de Fijter J. Characterizing the role of enterohepatic recycling in the interactions between mycophenolate mofetil and calcineurin inhibitors in renal transplant patients by pharmacokinetic modelling. Br J Clin Pharmacol. 2005;60:249–56. doi: 10.1111/j.1365-2125.2005.02398.x. [DOI] [PMC free article] [PubMed] [Google Scholar]
- 40.Le Guellec C, Bourgoin H, Buchler M, Le Meur Y, Lebranchu Y, Marquet P, Paintaud G. Population pharmacokinetics and Bayesian estimation of mycophenolic acid concentrations in stable renal transplant patients. Clin Pharmacokinet. 2004;43:253–66. doi: 10.2165/00003088-200443040-00004. [DOI] [PubMed] [Google Scholar]
- 41.Tredger JM, Brown NW, Adams J, Gonde CE, Dhawan A, Rela M, Heaton N. Monitoring mycophenolate in liver transplant recipients: toward a therapeutic range. Liver Transpl. 2004;10:492–502. doi: 10.1002/lt.20124. [DOI] [PubMed] [Google Scholar]
- 42.Venkataramanan R, Shaw LM. Therapeutic monitoring of mycophenolic acid in liver transplant patients. Liver Transpl. 2004;10:503–5. doi: 10.1002/lt.20125. [DOI] [PubMed] [Google Scholar]
- 43.Filler G, Foster J, Berard R, Mai I, Lepage N. Age-dependency of mycophenolate mofetil dosing in combination with tacrolimus after pediatric renal transplantation. Transplant Proc. 2004;36:1327–31. doi: 10.1016/j.transproceed.2004.05.043. [DOI] [PubMed] [Google Scholar]
- 44.Jacobson P, Rogossheske J, Barker JN, Green K, Ng J, Weisdorf D, Tan Y, Long J, Remmel R, Sawchuk R, McGlave P. Relationship of mycophenolic acid exposure to clinical outcome after hematopoietic cell transplantation. Clin Pharmacol Ther. 2005;78:486–500. doi: 10.1016/j.clpt.2005.08.009. [DOI] [PubMed] [Google Scholar]
- 45.Mosteller RD. Simplified calculation of body-surface area. N Engl J Med. 1987;317:1098. doi: 10.1056/NEJM198710223171717. [DOI] [PubMed] [Google Scholar]