

Abstract
Magnetic resonance imaging (MRI) with tissue tagging enables the quantification of multiple strain indices that can be combined through normalization into a single multiparametric index of regional myocardial contractile function. The aim of this study was to test the ability of multiparametric strain analysis to quantify regional differences in contractile function in an ovine model of myocardial injury. Regional variance in myocardial contractile function was induced in eight sheep by the ligation of the blood supply to the anterior and apical left ventricular myocardial walls. Left ventricular systolic strain was obtained from tissue tagged MRI images. A normal strain database (n = 50) defines all parameters of systolic strain and allows normalization of regional function at 15,300 left ventricular points by calculation of a Z-score. Multiparametric systolic strain Z-scores were therefore determined for 15,300 points in each injured sheep left ventricle. Multiparametric Z-scores were found to vary significantly by region (p < 0.001). Z-scores in regions remote to the infarct were found to be significantly smaller than those in the regions most likely to include infarcted myocardium. In this pre-clinical evaluation of MRI-based multiparametric strain analysis, it accurately quantified and visually defined regional differences in myocardial contractile function.
Keywords: Cardiac function, Magnetic resonance imaging (MRI), Ischemic heart disease
INTRODUCTION
The ability of sequential MRI to track radiofrequency tissue tag gridline deformation during the systolic contraction of the heart allows for quantitative assessment of regional myocardial strain. The analysis of the multiple strain parameters holds considerable potential to improve our ability to accurately quantify regional and transmural systolic myocardial contractile function. Many different systolic strain parameters have been utilized to characterize LV contractile function [1–6]. Without “normalization,” the variant physiological ranges of these parameters preclude their combination into a composite strain index. Methods that serve to relate raw strain values to the expected norm, however, allow the combination of different strain parameters into a single composite multiparametric strain index.
In order to define “normal” human strain, we have compiled a complete characterization of all strain components on a uniform grid of 15,300 points across the normal human LV by performing MRI with tissue tagging and strain analysis in 50 normal human volunteers. Using this database information, each patient-specific strain value at each point can be related to the normal data range at that specific LV position by calculation of a Z-score. A Z-score is a simple numerical representation of where the raw strain value falls in relation to the normal distribution of strain values at that particular ventricular position.
This normalization of strain data allows the combination of multiple strain indices into a multiparametric systolic strain tool to optimize the quantification of regional and transmural contractile function. Our laboratory has combined three of these indices,circumferential strain, longitudinal strain, and the minimum principal strain angle [7], into a composite, MRI-based multiparametric systolic strain analysis. As a first step in the testing and development of this analysis, we hypothesize that it can accurately quantify regional differences in contractile function in an ovine model of myocardial injury.
MATERIALS AND METHODS
Normal Human Strain Database
The 50 normal volunteers who contributed strain information to the normal human strain database (average age 32.8 ± 10.6 yrs) were asymptomatic and had normal physical findings, normal electrocardiography, and no history of heart disease. The Human Research Protection Office at Washington University, St. Louis, MO, approved the studies under which this information was acquired. Informed consent was obtained from all subjects.
Animal Model
The ligation of the coronary arterial blood supply to the anterior and apical LV walls is a well-studied method for creating an ovine model of regionally varying myocardial contractile function. This model creates an area of myocardial injury involving the distal two thirds of the LV with particularly dense injury anteriorly. This model therefore creates a distinct demarcation between normally functioning myocardium and abnormally functioning myocardium in the same animal such that each animal can serve as its own control [8]. The animal study group includes a total of 11 sheep. The first three normal sheep were anesthetized with ketamine (15mg/kg intramuscularly), and were mechanically ventilated after endotracheal intubation. They did not undergo thoracotomy, ligation of coronary arterial blood supply, or any other major surgical procedures prior to cardiac MRI.
The raw strain data from these three normal sheep were compared to the normal human strain database. The sheep heart is a valuable large animal model for testing human physiology because the cardiac embryological development and ultimate anatomic relationships of sheep and human biventricular geometry are known to be very similar [8]. As expected, the comparison of multiple parameters of strain obtained from these three normal sheep did not reveal any consistent variation from normal human strain. The two uppermost images in Figure 1 demonstrate the anterior wall views of the multiparametric strain Z-score contour plots obtained in two of these normal sheep. The anterior and apical walls of these normal sheep demonstrate normal multiparametric Z-score values when compared to the human database and established the utility of the database in examining the sheep model of regionally varying myocardial contractile function.
Figure 1.
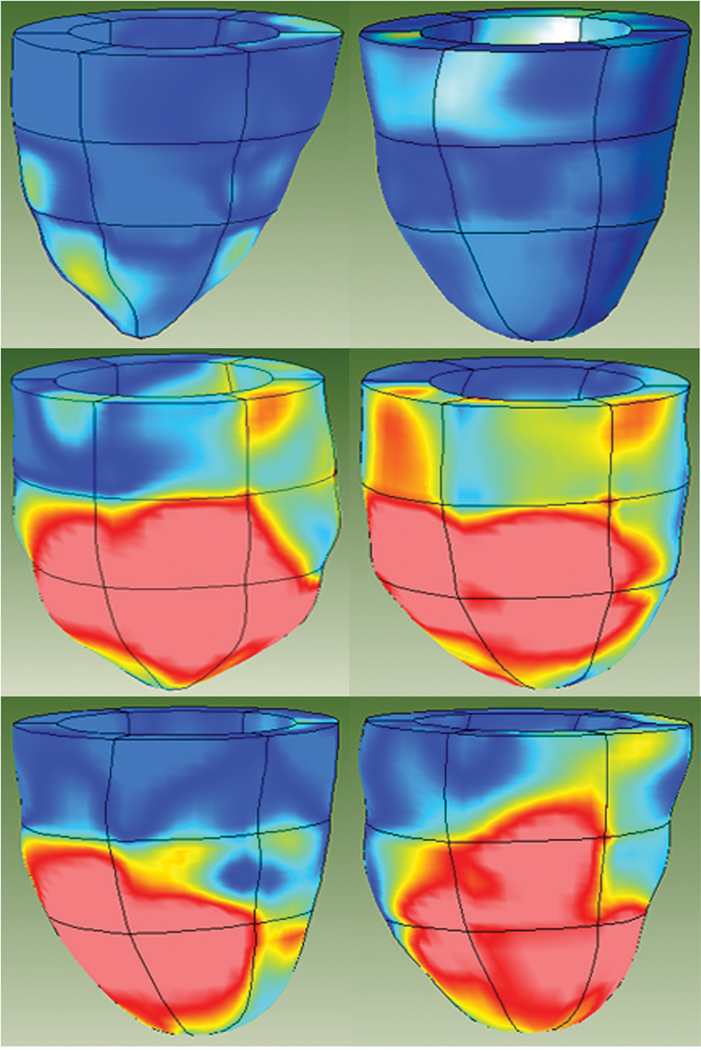
MRI-based multiparametric strain Z-score 3D color contour mapping. The top two images are of the anterior walls of two normal sheep. They demonstrate no consistent difference between sheep and human myocardial contractile patterns as delineated by multiparametric systolic strain. In contrast, the bottom four images are of the anterior walls of four different sheep that underwent creation of anterior wall and apical myocardial injury by ligation of the related coronary artery blood supply. The profound differences between the proximal third of the ventricle and the injured distal two thirds of the ventricle, especially in the anterior wall, are well demonstrated by these representative images. Dark blue regions are areas with Z-scores less than 0.75. Light blue regions have Z-scores between 0.75 and 1.50. Yellow areas have Z-scores between 1.50 and 2.25 and red regions have Z-scores greater than 2.25.
A total of eight sheep underwent left anterior thoracotomy after induction of anesthesia, endotracheal intubation, and establishment of mechanical ventilation as described above. The arterial blood supply to the anterior and apical regions of the LV was ligated as described in this well-studied model of regional LV wall injury [8]. The thoracotomy incisions were closed. The animals were allowed to recover for 10 weeks and then subjected to a second and final general anesthesia (described above) during which they underwent cardiac MRI. All animals receive humane care in compliance with the European Convention on animal care and the Animal Studies Committee at Washington University Medical School approved and monitored the protocol.
MRI Protocol
Imaging was performed with the subjects at rest in a 1.5 Tesla MR scanner (Siemens, Iselin, New Jersey). A series of short-axis image sets were obtained in parallel planes at 8mm intervals beginning at the level of the mitral valve and ending at an imaging plane that contained only apical myocardium. Additionally, four sets of radially oriented long-axis images, separated by 45° and intersecting at the centroid of the LV, were obtained. For each selected imaging plane, a single-slice MR tagged image set was collected with a sequence consisting of a spatial modulation of magnetization tagging preparation [9, 10] followed by a 2D balanced steady-state free precession cine image acquisition.
Strain Calculations
Strain calculations were obtained using a previously described and validated method [11]. Briefly, manually identified wall boundaries from the tagged images were used to construct a uniform finite element model of the LV. Using the attachment points of the right ventricular free wall with the septum as landmarks, a finite element mesh for the model was constructed consisting of eighteen elements (Figure 2). Circumferential strain, longitudinal strain and the minimum principal strain angle were computed from each of the healthy volunteers on an evenly spaced grid of 15,300 points in the element coordinate system. Normal average and standard deviations were computed for each strain parameter at each of these points.
Figure 2.

Finite element model of the left ventricle. Models are subdivided into six elements representing the anteroseptal, anterior, anterolateral, posterolateral, posterior and posteroseptal regions. The heart is further divided into proximal (basal), mid, and distal (apical) regions. A = anterior; AL = anterolateral; AS = anteroseptal; P = posterior; PL = posterolateral; PS = posteroseptal.
Z-Score Calculation
Strain values in each of the eight sheep were computed as described above. For each strain parameter, a Z-score was computed at each of the grid points according to the formula Z = (x − µ)/σ, where × is the measured strain, µ is the normal mean and σ is the normal standard deviation at a given point. A multiparametric Z-score was computed by averaging the Z-scores for each of the individual strain parameters. Average multiparametric Z-scores were computed for each of the eighteen model regions.
Statistical Analysis
Statistical analysis was carried out using SPSS software (SPSS Inc, Chicago, IL). Continuous data are presented as mean ± standard deviation. Regional average Z-scores were compared using a one-way analysis of variance (ANOVA). The ANOVA was performed on data transformed by the common log function because the raw Z-score data did not satisfy the assumption of equal variance. Since the aim of this study was to assess the ability of this method to discriminate between normal and dysfunctional myocardium, contrasts were specified comparing regions remote to the infarct (the posteroseptal and posterior regions at the base of the heart) with those regions directly impacted by the infarct (the anterior and anteroseptal walls at the mid-ventricle and the apex). In all cases, P values of less than 0.05 were considered to be statistically significant.
RESULTS
Regional average values of circumferential strain, longitudinal strain and the minimum principal strain angle were computed from the 50 normal volunteers that contributed to the normal strain database. These data are presented in Tables 1, 2, 3, respectively.
Table 1.
Regional Normal Circumferential Strain Values (n = 50)
| Region | |||||||
|---|---|---|---|---|---|---|---|
| Level | AS | A | AL | PL | P | PS | Entire Level |
| Base | −0.18 ± 0.03 | −0.19 ± 0.04 | −0.21 ± 0.03 | −0.21 ± 0.03 | −0.17 ± 0.03 | −0.17 ± 0.03 | −0.19 ± 0.04 |
| Mid-ventricle | −0.19 ± 0.03 | −0.22 ± 0.04 | −0.23 ± 0.04 | −0.24 ± 0.03 | −0.20 ± 0.03 | −0.19 ± 0.03 | −0.21 ± 0.04 |
| Apex | −0.17 ± 0.04 | −0.20 ± 0.04 | −0.22 ± 0.04 | −0.23 ± 0.05 | −0.20 ± 0.04 | −0.18 ± 0.04 | −0.20 ± 0.04 |
| Entire Region | −0.18 ± 0.03 | −0.20 ± 0.04 | −0.22 ± 0.04 | −0.23 ± 0.04 | −0.19 ± 0.04 | −0.18 ± 0.03 | −0.20 ± 0.04 |
AS = anteroseptal; A = anterior; AL = anterolateral; PL = posterolateral; P = posterior; PS = posteroseptal.
Table 2.
Regional Normal Longitudinal Strain Values (n = 50)
| Region | |||||||
|---|---|---|---|---|---|---|---|
| Level | AS | A | AL | PL | P | PS | Entire Level |
| Base | −0.13 ± 0.04 | −0.13 ± 0.04 | −0.14 ± 0.04 | −0.14 ± 0.04 | −0.13 ± 0.04 | −0.13 ± 0.04 | −0.13 ± 0.04 |
| Mid-ventricle | −0.16 ± 0.03 | −0.15 ± 0.03 | −0.14 ± 0.04 | −0.14 ± 0.04 | −0.14 ± 0.03 | −0.15 ± 0.03 | −0.15 ± 0.03 |
| Apex | −0.18 ± 0.04 | −0.17 ± 0.05 | −0.15 ± 0.04 | −0.17 ± 0.04 | −0.19 ± 0.04 | −0.18 ± 0.04 | −0.18 ± 0.05 |
| Entire Region | −0.16 ± 0.04 | −0.15 ± 0.04 | −0.14 ± 0.04 | −0.15 ± 0.04 | −0.15 ± 0.05 | −0.15 ± 0.04 | −0.15 ± 0.04 |
AS = anteroseptal; A = anterior; AL = anterolateral; PL = posterolateral; P = posterior; PS = posteroseptal.
Table 3.
Regional Normal Minimum Principal Strain Angle Values (n = 50)
| Region | |||||||
|---|---|---|---|---|---|---|---|
| Level | AS | A | AL | PL | P | PS | Entire Level |
| Base | 8 ± 3° | 9 ± 4° | 7 ± 4° | 8 ± 3° | 11 ± 6° | 10 ± 5° | 9 ± 4° |
| Mid-ventricle | 8 ± 4° | 8 ± 3° | 8 ± 2° | 9 ± 3° | 9 ± 4° | 8 ± 3° | 8 ± 3° |
| Apex | 17 ± 6° | 16 ± 6° | 14 ± 6° | 15 ± 6° | 17 ± 6° | 17 ± 7° | 16 ± 6° |
| Entire Region | 11 ± 6° | 11 ± 6° | 9 ± 5° | 11 ± 5° | 12 ± 7° | 11 ± 7° | 11 ± 6° |
AS = anteroseptal; A = anterior; AL = anterolateral; PL = posterolateral; P = posterior; PS = posteroseptal.
Regional average multiparametric Z-scores were computed for each of the eight infarcted sheep as described above. These data are presented in Figure 3. Contractile function was preserved in all basal regions with the smallest Z-scores observed in the posterior and posteroseptal walls (most remote from the apical injury induced by ligation of the anterior wall coronary arterial blood supply). In contrast, all regions at the mid-ventricular and apical levels exhibited markedly abnormal contractile function. The high Z-scores in the posterior regions of the mid-ventricle likely indicate the influence of infarction borderzone myocardium [12, 13]. In 2002, Jackson and colleagues [14] showed that borderzone myocardium can extend to involve additional contiguous myocardium that loses contractile function as the heart remodels.
Figure 3.

Regional average multiparametric Z-scores from the eight infarcted sheep. Error bars are mean ± standard deviation. Contractile function is preserved in all regions at the base, but abnormal in the mid-ventricle and apex. First letter abbreviations: A = apical ; B = basal; M= mid-ventricular. Remaining abbreviations: A = anterior; AL = anterolateral; AS = anteroseptal; P = posterior; PL = posterolateral; PS = posteroseptal.
Overall, multiparametric Z-scores were found to vary significantly by region (p < 0.001). Z-scores in the basal posterior and posteroseptal walls were found to be significantly less (better) compared to the anterior and anteroseptal walls at the mid-ventricle and apex (p < 0.001 for all).
DISCUSSION
MRI has excellent spatial and temporal resolution and has the unique ability to track the deformation of gridlines created by the radiofrequency tagging of myocardial tissue. These attributes, combined with excellent boundary resolution without the need for intravenous contrast agents and the absence of radiation exposure, make MRI highly attractive as a clinically applicable imaging modality to assess regional differences in myocardial contractile function.
The ability to quantify regionally varying differences in myocardial contractile function is important in the clinical management of patients with all cardiomyopathic processes, regardless of the etiology. This is even true in disease processes once felt to be regionally homogeneous, such as idiopathic dilated cardiomyopathy [15]. Even so, this capability would obviously be expected to have its most profound impact in pathological processes that are associated with a nonhomogeneous influence on regional myocardial contractile function, such as ischemic cardiomyopathy. A quantified regional characterization of contractile function would be in direct contrast to currently utilized clinical modalities, which either render global indices (such as LV ejection fraction) alone or render only non-quantitative descriptions of regional function.
The first step in the validation of any new methodology with the potential to accurately quantify regional cardiac contractility is to test it in an animal model of regionally varying myocardial contractile function. In the ideal experimental model, each individual animal would serve as its own control. This is best accomplished by utilizing a methodology—such as controlled ligation of regional coronary arterial blood supply—that is capable of creating an abnormal variance in myocardial contractile function in one LV region while maintaining relatively normal function in at least one other remote region in the same animal. Since the normally and abnormally contracting regions are compared simultaneously in the same animal, the influence of variables such as loading conditions can therefore be minimized. In all eight ischemically injured animals, multiparametric strain analysis easily differentiated between the injured distal (apical) two thirds and the preserved proximal (basal) third of the ventricle, thus convincingly demonstrating that MRI-based multiparametric strain analysis is sensitive to differences in regional contractile function.
Study Limitations
Obviously it would be ideal if we had access to a normal sheep myocardial strain database. Unfortunately, the laboratory resources that are necessary to compile a large normal sheep strain database are not available. The similarities in the embryologic development and adult structural anatomy and function between sheep and humans have made sheep the preferred large animal model for the investigation of myocardial mechanics. Our study confirmed these marked similarities, as the normal sheep that were studied demonstrated no significant strain variance from the normal human strain database averages.
Clinical implications
The ability to accurately quantify regional myocardial contractile function in the clinical setting would have profound consequences in the management of patients whose myocardial pathological processes demonstrate, and whose clinical course is dependent upon, regional and transmural variances in myocardial contractile function. This would be most applicable in the management of patients with ischemic cardiomyopathy secondary to atherosclerotic coronary artery disease. Many other disease processes, such as cardiomyopathy secondary to valvular or idiopathic myopathic processes, may also demonstrate significant regional inhomogeneity and be amenable to characterization by this methodology.
Perhaps more significantly, this investigation introduces a methodology that allows an individual patient’s regional contractile function to be presented in a visual format (see Figure 1) that numerically compares it to the expected norm in each region of the LV. In addition to this clinically relevant presentation of patient-specific contractile function information, this normalization of patient specific strain data allows the combination of multiple strain components and indices into composite multiparametric strain indices.
Acknowledgments
This work was supported by NIH Grants HL069967 and HL064869.
References
- 1.Garot J, Bluemke DA, Osman NF, Rochitte CE, McVeigh ER, Zerhouni EA, Prince JL, Lima JA. Fast determination of regional myocardial strain fields from tagged cardiac images using harmonic phase MRI. Circulation. 2000;101:981–988. doi: 10.1161/01.cir.101.9.981. [DOI] [PubMed] [Google Scholar]
- 2.Gotte MJ, Van Rossum AC, Twisk JWR, Kuijer JP, Marcus JT, Visser CA. Quantification of regional contractile function after infarction: strain analysis superior to wall thickening analysis in discriminating infarct from remote myocardium. J Am Col Cardiol. 2001;37:808–817. doi: 10.1016/s0735-1097(00)01186-4. [DOI] [PubMed] [Google Scholar]
- 3.Moore CC, Lugo-Olivieri CH, McVeigh ER, Zerhouni EA. Three-dimensional systolic strain patterns in the normal human left ventricle: characterization with tagged MR imaging. Radiology. 2000;214:453–466. doi: 10.1148/radiology.214.2.r00fe17453. [DOI] [PMC free article] [PubMed] [Google Scholar]
- 4.Young AA, Imai H, Chang CN, Axel L. Two-dimensional left ventricular deformation during systole using magnetic resonance imaging with spatial modulation of magnetization. Circulation. 1994;89:740–752. doi: 10.1161/01.cir.89.2.740. [published erratum appears in Circulation 1994 Sep;90(3):1584] [DOI] [PubMed] [Google Scholar]
- 5.Pomerantz BJ, Wollmuth JR, Krock MD, Cupps BP, Moustakidis P, Kouchoukos NT, Davila-Roman VG, Pasque MK. Myocardial systolic strain is decreased after aortic valve replacement in patients with aortic insufficiency. The Annals of thoracic surgery. 2005;80:2186–2192. doi: 10.1016/j.athoracsur.2005.05.095. [DOI] [PubMed] [Google Scholar]
- 6.Bree D, Wollmuth JR, Cupps BP, Krock MD, Howells A, Rogers J, Moazami N, Pasque MK. Low-dose dobutamine tissue-tagged magnetic resonance imaging with 3-dimensional strain analysis allows assessment of myocardial viability in patients with ischemic cardiomyopathy. Circulation. 2006;114:I33–I36. doi: 10.1161/CIRCULATIONAHA.105.000885. [DOI] [PMC free article] [PubMed] [Google Scholar]
- 7.Cupps BP, Pomerantz BJ, Krock MD, Villard J, Rogers J, Moazami N, Pasque MK. Principal strain orientation in the normal human left ventricle. The Annals of thoracic surgery. 2005;79:1338–1343. doi: 10.1016/j.athoracsur.2004.05.004. [DOI] [PubMed] [Google Scholar]
- 8.Markovitz LJ, Savage EB, Ratcliffe MB, Bavaria JE, Kreiner G, Iozzo RV, Hargrove WC, 3rd, Bogen DK, Edmunds LH., Jr Large animal model of left ventricular aneurysm. The Annals of thoracic surgery. 1989;48:838–845. doi: 10.1016/0003-4975(89)90682-6. [DOI] [PubMed] [Google Scholar]
- 9.Axel L, Dougherty L. MR imaging of motion with spatial modulation of magnetization. Radiology. 1989;171:841–845. doi: 10.1148/radiology.171.3.2717762. [DOI] [PubMed] [Google Scholar]
- 10.Axel L, Dougherty L. Heart wall motion: improved method of spatial modulation of magnetization for MR imaging. Radiology. 1989;172:349–350. doi: 10.1148/radiology.172.2.2748813. [DOI] [PubMed] [Google Scholar]
- 11.Moulton MJ, Creswell LL, Downing SW, Actis RL, Szabo BA, Vannier MW, Pasque MK. Spline surface interpolation for calculating 3-D ventricular strains from MRI tissue tagging. Am J Physiol. 1996;270:H281–H297. doi: 10.1152/ajpheart.1996.270.1.H281. [DOI] [PubMed] [Google Scholar]
- 12.Jackson BM, Gorman JH, 3rd, Salgo IS, Moainie SL, Plappert T, St John-Sutton M, Edmunds LH, Jr, Gorman RC. Border zone geometry increases wall stress after myocardial infarction: contrast echocardiographic assessment. American journal of physiology. 2003;284:H475–H479. doi: 10.1152/ajpheart.00360.2002. [DOI] [PubMed] [Google Scholar]
- 13.Jackson BM, Parish LM, Gorman JH, 3rd, Enomoto Y, Sakamoto H, Plappert T, St John Sutton MG, Salgo I, Gorman RC. Borderzone geometry after acute myocardial infarction: a three-dimensional contrast enhanced echocardiographic study. The Annals of thoracic surgery. 2005;80:2250–2255. doi: 10.1016/j.athoracsur.2005.05.103. [DOI] [PubMed] [Google Scholar]
- 14.Jackson BM, Gorman JH, Moainie SL, Guy TS, Narula N, Narula J, John-Sutton MG, Edmunds LH, Jr, Gorman RC. Extension of borderzone myocardium in postinfarction dilated cardiomyopathy. Journal of the American College of Cardiology. 2002;40:1160–1167. doi: 10.1016/s0735-1097(02)02121-6. discussion 1168–1171. [DOI] [PubMed] [Google Scholar]
- 15.Young AA, Dokos S, Powell KA, Sturm B, McCulloch AD, Starling RC, McCarthy PM, White RD. Regional heterogeneity of function in nonischemic dilated cardiomyopathy. Cardiovascular research. 2001;49:308–318. doi: 10.1016/s0008-6363(00)00248-0. [DOI] [PubMed] [Google Scholar]