

Abstract
Ca2+ signals in neurons use specific temporal and spatial patterns to encode unambiguous information about crucial cellular functions. To understand the molecular basis for initiation and propagation of inositol 1,4,5-trisphosphate (InsP3)-mediated intracellular Ca2+ signals, we correlated the subcellular distribution of components of the InsP3 pathway with measurements of agonist-induced intracellular Ca2+ transients in cultured rat hippocampal neurons and pheochromocytoma cells. We found specialized domains with high levels of phosphatidylinositol-4-phosphate kinase (PIPKIγ) and chromogranin B (CGB), proteins acting synergistically to increase InsP3 receptor (InsP3R) activity and sensitivity. In contrast, Ca2+ pumps in the plasma membrane (PMCA) and sarco-endoplasmic reticulum as well as buffers that antagonize the rise in intracellular Ca2+ were distributed uniformly. By pharmacologically blocking phosphatidylinositol-4-kinase and PIPKIγ or disrupting the CGB-InsP3R interaction by transfecting an interfering polypeptide fragment, we produced major changes in the initiation site and kinetics of the Ca2+ signal. This study shows that a limited number of proteins can reassemble to form unique, spatially restricted signaling domains to generate distinctive signals in different regions of the same neuron. The finding that the subcellular location of initiation sites and protein microdomains was cell type specific will help to establish differences in spatiotemporal Ca2+ signaling in different types of neurons.
Keywords: InsP3, PIPKIγ, chromogranin, signaling microdomain, calcium imaging, hippocampal neurons
Introduction
To control many diverse intracellular processes (Berridge, 1998), neuronal Ca2+ signals encode information via distinct spatiotemporal patterns. Transient rises in cytoplasmic Ca2+ concentration ([Ca2+]i) are generally restricted to specific cell compartments such as the presynaptic terminal or postsynaptic spine, regulating neurotransmission and synaptic modulation (Zucker, 1989; Yuste et al., 1999). It has recently been shown that release of Ca2+ from internal stores can also spread within a neuron as regenerative waves (Nakamura et al., 1999; Kapur et al., 2001). Little is known about the basic properties of internal Ca2+ release, including the site of origin. Stimulation of muscarinic acetylcholine receptors (mAChRs) in neuronally derived cells gives rise to Ca2+ signals initiating in the neurite (Johenning et al., 2002). Similarly, in pyramidal neurons of the hippocampus and neocortex, Ca2+ transients evoked by synaptic activation of metabotropic glutamate receptors (mGluRs) are initiated in the proximal apical dendrite (Pozzo-Miller et al., 1996; Yeckel et al., 1999; Kapur et al., 2001; Larkum et al., 2003). In many neurons, the second messenger inositol 1,4,5-trisphosphate (InsP3) is the main trigger for generating elevations in [Ca2+]i emanating from Ca2+ channels in the endoplasmic reticulum (ER) (Nakamura et al., 2000; Rizzuto, 2001; Johenning et al., 2002). A key to understanding the spatiotemporal characteristics of Ca2+ signals is thus likely to lie in the various components of the InsP3 pathway.
InsP3 is generated by phospholipase C (PLC)-mediated cleavage of a phosphoinositide lipid precursor into InsP3 and diacylglycerol (DAG) (Fig. 1). Phosphatidylinositol-4-kinase (PI4K) synthesizes phosphatidylinositol-4-phosphate (PIP) from phosphatidylinositol (PI). Two subtypes termed II and III, differing in their sensitivity to the PI3K inhibitor wortmannin (Downing et al., 1996), have been described previously (Barylko et al., 2001). PIP is metabolized by phosphatidylinositol-4-phosphate-5-kinase (PIPK) to produce phosphatidylinositol-4,5-bisphosphate (PIP2), the immediate InsP3 precursor. PIPKIγ is the main isoform in neurons (Wenk et al., 2001). PIP2 is concentrated in plasma membranes (Watt et al., 2002) and is in itself an important cellular effector (Czech, 2003).
Figure 1.

Diagram of the inositol phosphate and lipid cycles. Inositol is symbolized by hexagons, the inorganic phosphate groups are symbolized by small circles, and DAG is symbolized by a rectangle with two zigzagged lines. Enzymes are in italics, and inhibitors are underlined. CDP, Cytidine diphosphate; WT, wortmannin.
The superfamily of Ca2+ release channels comprises three isoforms of the InsP3 receptor (InsP3R) and the ryanodine receptor (RyR). Although the biophysical properties and distribution of the RyRs are similar, each InsP3R isoform is characterized by a different InsP3 affinity (Patel et al., 1999), Ca2+-dependent inactivation (Bezprozvanny et al., 1991; Hagar et al., 1998), tissue distribution (Furuichi and Mikoshiba, 1995; Sharp et al., 1999), and regulation by phosphorylation (Tang et al., 2003) and additional endogenous modulators. The ER-resident high-capacity, low-affinity Ca2+ storage proteins chromogranin A (CGA) and CGB were found in a variety of neuroendocrine cells and neurons of the peripheral and central nervous systems (Winkler and Fischer-Colbrie, 1992) and have recently gained importance as activators of the InsP3R (Thrower et al., 2002, 2003).
Despite our extensive knowledge about many components of the Ca2+ signaling tool kit, it remains unclear how cells use the different elements to achieve spatially and temporally distinct Ca2+ signals. Here, we use fluorescence immunocytochemistry to demonstrate differential targeting of proteins enhancing and inhibiting InsP3-mediated Ca2+ signaling in cultured hippocampal neurons and neuron-like pheochromocytoma cells (PC12 cells) (Koizumi et al., 1999). With Ca2+ imaging techniques, we show that manipulation of regionally specific protein domains modifies the kinetics and temporal aspects of neuronal Ca2+ signals.
Materials and Methods
Cell culture and hippocampal neuron preparation. Rat adrenal pheochromocytoma cells (PC12 cells) were purchased from American Type Culture Collection (Manassas, VA) and grown in high-glucose DMEM supplemented with 10% heat-inactivated horse serum, 5% heat-inactivated fetal calf serum, 25 U/ml penicillin, and 25 μg/ml streptomycin (all from Invitrogen, Grand Island, NY) in poly-l-lysine-coated flasks (BD Biosciences, Bedford, MA). Cells were cultured in a water-saturated atmosphere at 37°C and 5% CO2. To induce differentiation, cells were diluted to 3 × 10⁴ ml-1 and plated onto collagen-I-coated coverslips (BD Biosciences) treated with 0.1% (w/v) poly-l-lysine (Peptide Institute, Osaka, Japan) to promote adhesion. Cells were differentiated with 100 ng/ml nerve growth factor (NGF) (Alomone Laboratories, Jerusalem, Israel) for 7 d. Cultures were fed three times per week.
Low-density cultures of dissociated rat hippocampal neurons were prepared using a modification of a protocol described previously (Brewer et al., 1993). Hippocampi were dissected from Sprague Dawley rat embryos (embryonic days 18-19), incubated for 15 min with 0.03% trypsin, and dissociated using a fire-polished Pasteur pipette. Hippocampal cells with glia were then plated at a density of 3-6 × 103 cm-1 on coverslips (Warner Instruments, Hamden, CT) coated with 0.1% (w/v) poly-l-lysine (Peptide Institute) in Neurobasal medium supplemented with 5% fetal calf serum, 0.5 mm glutamine, 2% B-27, 50 U/ml penicillin, 50 μg/ml streptomycin (all from Invitrogen, Grand Island, NY), and 25 μm glutamate (Sigma, St. Louis, MO). Four hours after plating, the medium was replaced with serum-free Neurobasal supplemented with 0.5 mm glutamine, 2% B-27, 50 U/ml penicillin, and 50 μg/ml streptomycin. One-third of the medium was replaced weekly. Cultures were used 10-20 d after plating.
Transfection of PC12 cells. The pShooter-pCMV/myc/ER plasmid (Invitrogen, Carlsbad, CA) containing the cDNA for the near N-terminal CGB peptide or a scrambled peptide and the pcDNA3.1 DsRed2-N1 construct (Clontech, Palo Alto, CA) used to verify transfection have been described previously (Choe et al., 2004). Twenty to 30 hours after plating, cells were cotransfected with 0.5 μg of pcDNA3.1 DsRed2-N1 cDNA and 1.5 μg of pShooter-pCMV/myc/ER with either the CGB fragment or the scrambled peptide using 3.5 μl of Lipofectamine 2000 (Invitrogen, Carlsbad, CA) per 35 mm well. Cells were then differentiated with NGF and used 6-7 d after transfection.
To monitor intracellular PIP2, CFP-PLCδ1(PH) (the pleckstrin homology domain of PLCδ1 linked to cyan fluorescent protein) was generated and expressed into cells as described previously (Johenning et al., 2004).
Antibodies and immunocytochemistry. Each InsP3R was detected using isoform-specific antibodies. Rabbit polyclonal InsP3R1 and InsP3R2 antibodies (1:100) were purchased from A.G. Scientific (San Diego, CA). A mouse monoclonal antibody was used to label the N-terminal region of the human InsP3R3 (1:100; BD Transduction Laboratories, Lexington, KY). Similarly, each RyR isoform was identified using isoform-specific antibodies, all kindly provided by Dr. Vincenzo Sorrentino (Universita degli di Siena, Siena, Italy): mouse monoclonal RyR1 (1:100) and RyR2 (1:100) and rabbit polyclonal RyR3 (1:200). Rabbit polyclonal PIPKIγ antibody (1:500) was a kind gift from Dr. G. di Paolo (Yale University, New Haven, CT). The other antibodies used included rabbit polyclonal PI4Kβ (1:200; Upstate Biotechnology, Lake Placid, NY), rabbit polyclonal mGluR1 and mGluR5 (1:100; Chemicon, Temecula, CA), mouse monoclonal PLCβ1 (1:100; Santa Cruz Biotechnology, Santa Cruz, CA), goat polyclonal CGA (1:100; Santa Cruz Biotechnology), mouse monoclonal CGB (1:100; BD Transduction Laboratories), goat polyclonal PMCA1 (1:100; Santa Cruz Biotechnology), goat polyclonal SERCA2 (sarco-endoplasmic reticulum, 1:50; Santa Cruz Biotechnology), and mouse monoclonal parvalbumin (1:100; Chemicon). Primary antibodies were visualized with fluorochrome-coupled secondary antibodies. The secondary antibodies used were Alexa Fluor 488 and 568 coupled with goat anti-rabbit and goat anti-mouse IgG and Alexa Fluor 488 and 594 coupled with donkey anti-goat IgG (all from Molecular Probes, Eugene, OR). Nuclei were stained by incubating the cells with TOPRO-3 (monomeric cyanine nucleic acid stain) for 20 min (1:200 in PBS; Molecular Probes).
Cells were fixed with 4% (w/v) paraformaldehyde in PBS containing 4% (w/v) sucrose (PBSS), pH 7.4, for 20 min at room temperature and permeabilized with 0.1% (v/v) Triton X-100 for 5 min. Nonspecific binding sites were blocked by incubating the cells with PBSS containing 10% normal goat serum (NGS) and 1% bovine serum albumin for 45 min. For CGA, PMCA1, and SERCA2 detection, NGS was replaced by fetal calf serum. Cells were exposed to primary and secondary antibodies diluted in PBSS with 1% bovine serum albumin for at least 2 h and 1 h, respectively. Labeled cells were visualized on an LSM510 META inverted confocal microscope (Zeiss, Oberkochen, Germany) using 40×, 0.8 numerical aperture (NA) and 63×, 1.4 NA oil-immersion objectives. Averaging eight frames reduced noise. Fluorochromes were excited with an argon laser at 488 nm (Alexa 488) and a helium-neon laser at 543 nm (Alex 568 and 594) and 633 nm (TOPRO-3). The appropriate emission filters were used for fluorescence detection.
Live cell imaging of the ER and mitochondria. PC12 cells on coverslips were loaded with 5 μm ER-Tracker dye (Molecular Probes) in growth medium for 30 min at 37°C. The coverslip was transferred to a superfusion chamber and mounted onto the stage of an MRC-1024 confocal microscope (Bio-Rad, Hercules, CA), equipped with a Tsunami Ti:S laser and a Millenia X pump laser (SpectraPhysics, Mountain View, CA). ER-Tracker was excited at 790 nm by two-photon excitation. Fluorescence was observed at 500-540 nm with custom-built external detectors using a 63×, 1.4 NA objective.
Mitochondria were labeled with 200 μm MitoTracker Green FM dye (Molecular Probes) in growth medium for 30 min at 37°C. An argon laser at 488 nm was used for excitation. Fluorescence was detected with appropriate emission filters. Cells were observed on a Zeiss LSM510 upright confocal microscope using a 40×, 0.8 NA water-immersion objective.
Ca2+ fluorescence imaging. PC12 cells grown on glass coverslips were loaded with 9 μm fluo-4 AM in 20% Pluronic F-127 in DMSO (all from Molecular Probes) for 20 min at 37°C in extracellular solution containing (in mm) 124 NaCl, 2.5 KCl, 2 CaCl2, 2 MgCl2, 10 d-glucose, 25 NaHCO3 and 1.25 NaH2PO4. Before imaging, cells were allowed an additional 5 min in dye-free extracellular solution for deesterification of the dye. The coverslip was used as the bottom of an open superfusion chamber mounted onto the stage of a Zeiss LSM510 upright confocal microscope. Cells were perfused continuously with extracellular solution at 5 ml/min. Solution changes were accomplished rapidly by means of a valve attached to a fourchambered superfusion reservoir. Perfusion with the muscarinic receptor agonist carbachol started after the cells had reached a stable baseline. An argon laser at 488 nm was used for excitation, and the emission signal was detected with the appropriate emission filter. Cells were observed using a 40×, 0.8 NA waterimmersion objective, and whole-cell images were recorded every 200 ms for ∼4 min. Increases in [Ca2+]i were expressed as the ratio of fluorescence intensity F of fluo-4 over baseline F0, calculated as the average of at least 10 frames before fluorescence increase, and corrected for background fluorescence Fb ((F - Fb)/(F0 - Fb)). Experiments were performed at 21°C.
For fluorescence imaging in hippocampal neurons, whole-cell patch-recording pipettes (2-4 MΩ) were pulled from borosilicate glass and filled with (in mm) 106 K-gluconate, 10 HEPES, 6 NaCl, 6 MgCl2, 0.2 EGTA, 2 ATP (disodium salt), 0.4 GTP (monosodium salt), 20 phosphocreatine (dipotassium salt), and 50 U/ml phosphocreatine kinase. Cells were perfused continuously at 1 ml/min with artificial CSF (ACSF) containing (in mm) 130 NaCl, 3 KCl, 2 CaCl2, 1 MgCl2, 10 HEPES, and 5 d-glucose, pH adjusted to 7.5. Whole-cell patch-clamp recordings were made from the soma with an npi SEC-05LX amplifier (Adams and List Associates, Westbury, NY) in discontinuous voltage-clamp mode. The resting membrane potential was typically near -55 mV. Series resistance was between 10 and 20 MΩ. Neurons were stimulated with bath-applied (S)-3,5-dihyroxyphenylglycine (DHPG) (50 μm; Tocris, Bristol, UK) dissolved directly into ACSF. A concentration of 10 μm 6,7-dinitroquinoxaline-2,3-dione (DNQX) (Tocris) to block non-NMDA receptors was always present in the bathing solution. To measure changes in [Ca2+]i, bis-fura-2 (100 μm; Molecular Probes) was included in the pipette solution and allowed to diffuse into the neuron for at least 5 min before optical recordings began. Fluorescence images were recorded at 10 Hz with 380 nm excitation using a cooled charge-coupled device camera (Quantix 57; Photometrics, Tuscon, AZ) mounted onto a Zeiss upright fluorescence microscope equipped with a 40×, 0.8 NA water-immersion objective. Membrane voltage was held at -65 mV to prevent any contribution from Ca2+ influx via voltage-gated channels. Relative changes in [Ca2+]i were quantified by calculating ΔF/F0, where F0 is the fluorescence intensity before stimulation (after subtracting background fluorescence), and ΔF is the change in fluorescence during neuronal activity (corrected for bleaching). Pixels were binned in a 10 × 10 array. Experiments were performed at 32°C.
Chemicals. Wortmannin, 2-(4-morpholinyl)-8-phenyl-4H-1-benzopyran-4-one (LY294002), and 6-E2-E4-[(p-fluorophenyl)phenyl-methylene]-1-piperidinyl{ethyl}-7-methyl-5H-thiazolo(3,2-a)pyrimidine-5-one (R59022) were obtained from Calbiochem (La Jolla, CA).
Data analysis. Fluorescence intensity was measured over regions of interest (ROI) in the soma and the neurites. ROI were ∼5 × 5 μm. In PC12 cells, ROI over the cell body and the growth cones were 80-100 μm apart. In hippocampal neurons, ROI were placed every 5-15 μm from the soma to distal sections of large caliber dendrites. A 9-1 moving average filter was applied to PC12 cell traces. The onset of the signal was determined as the time point at which F/F0 began to rise above 10% of the interval between F0 and Fmax for the first time (see Fig. 4a, arrows). The flux rate was calculated as the slope of a line between the data point at which the onset of the signal was determined and the data point at which F/F0 reached 90% of the interval between F0 and Fmax. The self-ratio method was used because it is a measurement independent of factors such as dye concentration, excitation intensity, and detector efficiency. Statistical significance was tested using the unpaired Student's t test at p < 0.05.
Figure 4.

Growth cones of PC12 cells are more effective than the soma at generating fast, high-amplitude intracellular Ca2+ signals. PC12 cells were stimulated with 500 μm bath-applied carbachol for 60 s, and the consecutive rise in [Ca2+]i was detected and analyzed as explained in Materials and Methods. a, The time course of the Ca2+ transients recorded in the neurite and soma of a representative cell are shown on the left; an expanded time scale is shown below. The time point of signal initiation is marked by black arrows. The right panel shows a differential interference contrast image of typical cells. [Ca2+]i was monitored in the soma and in the growth cones. Scale bar, 20 μm. b, On average, the Ca2+ signal initiated in the growth cone followed by the soma after 0.78 ± 0.28 s. The transient in the neurite was of greater magnitude (1.97 ± 0.41 vs 1.03 ± 0.15) and rose faster (0.18 ± 0.03 vs 0.07 ± 0.01 s-1). Data in b are presented as the average of the number of cells in parentheses (±SEM). *p < 0.05; **p < 0.01.
Results
Asymmetric subcellular distribution of proteins of the InsP3 signaling cascade in neuronally differentiated PC12 cells
To test whether the initiation site and release kinetics of intracellular Ca2+ signals were determined by a nonuniform distribution of proteins involved in InsP3-mediated Ca2+ release, we examined the localization of major components of the InsP3 signaling pathway in NGF-differentiated PC12 cells. These elements were labeled using protein-specific primary antibodies and fluorescently tagged secondary antibodies and were visualized by confocal microscopy (Fig. 2a,b). PLCβ and the wortmannin-sensitive IIIβ isoform of PI4K (PI4Kβ) were balanced evenly between the soma and the neurite with no apparent concentration in either cell compartment (Fig. 2a). The same results were obtained for the other PI4K subtypes (data not shown). In contrast, the distribution of PIPKIγ, the next step in InsP3 synthesis, was specifically targeted to the growth cones and branching points of the neurites. Prominent protein clusters at the tip of and in the course of the processes of a cell were seen, whereas staining in the cell body was weak in comparison. The bottom panels in Figure 2 show a quantification of the fluorescence intensity along a typical neurite, plotted as a function of the distance from proximal to distal sections of the cell. When PIP2 levels were estimated by monitoring the location of a fusion protein containing the pleckstrin homology domain of PLCδ1 linked to cyan fluorescent protein CFP-PLCδ1(PH) (Johenning et al., 2004), the distribution was found to follow the localization of PIPKIγ (Fig. 2a). We next investigated the distribution of the chromogranin proteins, modulators of receptor activity from the luminal side of the Ca2+ channel (Thrower et al., 2002, 2003). Both CGA and CGB were highly concentrated in the neurites, especially at the growth cones, and staining in the cell body was weak (Fig. 2a). Quantification of the fluorescence intensity along a typical neurite is shown below the immunofluorescence panel. Together with the results for PIPKIγ, these findings suggested that protein domains are in the position to enhance Ca2+ signals via two distinct “ON mechanisms”: (1) increased PIP2 levels that would augment stimulus-induced InsP3 production and (2) increased sensitivity of the InsP3R by chromogranin binding to the luminal side of the receptor, which would allow faster activation of the InsP3R. To confirm that differences in the distribution of Ca2+ stores did not account for the greater efficiency of neurites in generating Ca2+ transients, we labeled live cells with ER-Tracker dye. The ER extended throughout the entire cell and was concentrated to the same extent in the soma and growth cones (Fig. 2a).
Figure 2.
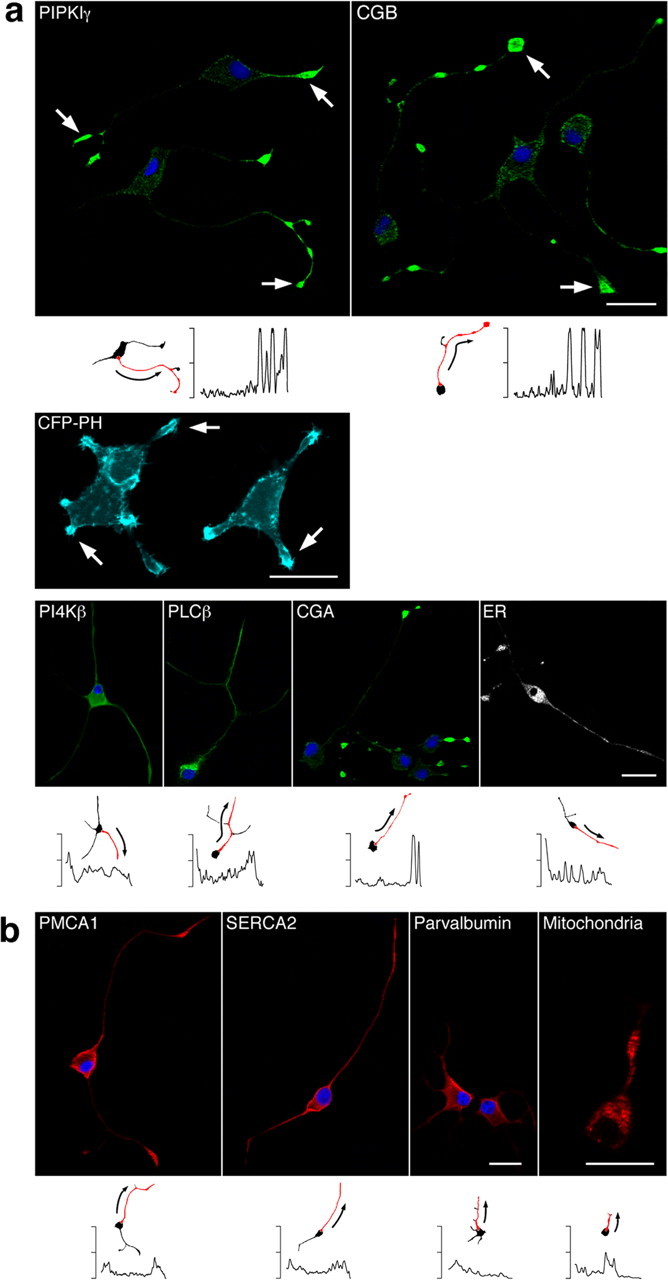
Proteins activating and inhibiting InsP3-mediated Ca2+ signaling are targeted to distinct compartments in NGF-differentiated PC12 cells. The subcellular localization was determined by indirect immunofluorescence as described in Materials and Methods. Proteins with an enhancing effect on Ca2+ signals are depicted in green (a), and proteins reducing Ca2+ levels are shown in red (b). Nuclei are shown in blue. In a and b, the bottom panels show the quantification of the fluorescence intensity along a typical neurite (shown as the red neurite in a miniature cell), plotted as a function of the distance from proximal (left) to distal (right) sections of the cell. a, PIPKIγ and CGB were highly concentrated in the growth cones and the branching points of the neurites (arrows), suggesting a potential mechanism for spatiotemporally distinct Ca2+ signaling patterns. The same result was obtained for CGA. PIP2, as monitored by visualizing CFP-PH, was located predominately in the plasma membrane of the growth cones (arrows) and is shown in cyan. A more uniform distribution was found for PI4Kβ and PLCβ. The ER extended throughout the cell, dominating in the soma and growth cones. b, In contrast, proteins decreasing [Ca2+]i were either not distributed asymmetrically or predominated in the soma: immunoreactivity for PMCA1 and SERCA2 was detected to the same extent in the cell body and the growth cones. Localization of parvalbumin was mainly somatic with weaker staining in the neurites. Mitochondria were distributed essentially evenly. Scale bar, 20 μm.
In support of our hypothesis that ON mechanisms enhance localized Ca2+ signaling, we found no such striking distribution for the various “OFF mechanisms.” Immunoreactivity for the Ca2+-ATPases in the plasma membrane (PMCA1) and sarco-endoplasmic reticulum (SERCA2) that extrude Ca2+ from the cytoplasm was detected in the entire cell with an evenly balanced ratio between the cell body and its processes (Fig. 2b, with quantification of the fluorescence intensity along a typical neurite shown below each panel). Similarly, mitochondria sequester Ca2+ from the cytosol, potentially terminating Ca2+ signals. Labeling with Mito-Tracker dye in live cells showed that mitochondria were distributed essentially uniformly (Fig. 2b). The Ca2+ buffer parvalbumin was more concentrated in the soma and only showed weak staining in the neurites (Fig. 2b), thus displaying a pattern opposite to the elements associated with activation of intracellular Ca2+ signals (Fig. 2a).
Distinct subcellular distribution of InsP3 signaling proteins in cultured hippocampal neurons
To determine whether asymmetric protein localization was a general principle used by other cell types, we examined the spatial distribution of components of the InsP3 pathway in cultured hippocampal neurons (Fig. 3a,b). Fluorescence intensity was quantified as described for Figure 2. In these cultures the majority of the neurons had the size and shape expected of pyramidal cells. The analysis of mGluRs focused on types 1 and 5, because these subtypes are known to be components of the InsP3R signaling pathway by their coupling with PLCβ via the G-protein Gq and they represent the predominant isoforms involved in Ca2+ signaling in neurons from the hippocampus and many other regions of the brain (Nakamura et al., 2000). mGluR1 immunoreactivity was detected in the entire neuron, extending from the cell body to distal dendrites. In contrast, mGluR5 was confined to the soma, and only faint staining was observed in proximal dendrites (Fig. 3a). This is similar to the localization of mAChRs in PC12 cells (Johenning et al., 2002). The distribution of PLCβ was essentially uniform. PI4Kβ was predominately localized in the cell body and dendrites coming off the cell body up to the bifurcation. More distal dendrites appeared weaker. We observed high concentrations of PIPKIγ in perinuclear regions of the soma. Lower levels were detected in distal parts of the neuron (Fig. 3a). InsP3R1 was most prominent in the cell body and in the shafts of large-caliber dendrites. The absence of InsP3R2 in hippocampal neurons (Sharp et al., 1999) was confirmed; however, substantial InsP3R2-specific immunoreactivity was associated with glial cells (data not shown). We found small quantities of InsP3R3 restricted to the soma. Distal dendrites were not labeled (Fig. 3a). RyR1 was mainly localized in the soma, although some protein extended into more distal parts of the cell, mostly large caliber dendrites. Weak staining for RyR2 was found in central compartments of the neuron. RyR3 was distributed throughout the neuron with particularly strong staining in the cell body and dendritic spines (Fig. 3a). Finally, CGB was exquisitely targeted to the soma and invaded only the proximal dendrites. No labeling in distal cell compartments was observed (Fig. 3a).
Figure 3.
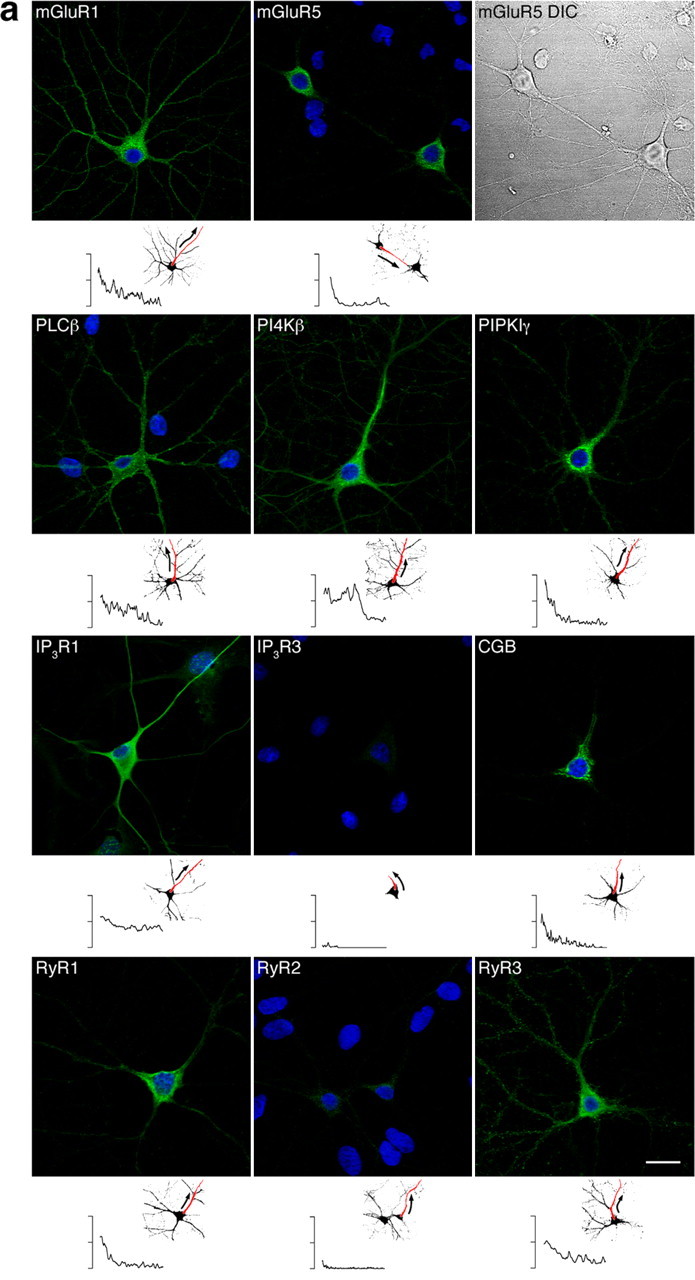

a, Components activating the InsP3 pathway are concentrated in the soma and proximal dendrites of cultured hippocampal neurons. Proteins were localized by indirect immunofluorescence, and fluorescence was quantified as outlined in Figure 2. Activators of Ca2+ signaling are depicted in green. Nuclei are in blue. Cells with purely nuclear staining are glia. mGluR1 was detected throughout the neuron, reaching from the soma to distal dendrites. mGluR5, in contrast, was localized predominately in the cell body; staining in the dendrites was weak and restricted to proximal sections. A differential interference contrast (DIC) image is shown on the right. PLCβ distribution was essentially uniform. Immunoreactivity for PI4Kβ was found to be ubiquitous with an emphasis on the soma and the apical dendrite up to the bifurcation. Staining for PIPKIγ was especially strong in perinuclear regions of the cell body and in the proximal primary dendrite. InsP3R1 was readily detected in the soma and the shaft of large-caliber dendrites. Although there was no evidence for InsP3R2 (data not shown), small levels of InsP3R3 were localized in the cell body. RyR1 staining was strong in the soma and extended into large dendrites. Little RyR2 was found in central compartments of the neuron. RyR3 was distributed throughout the cell; high levels were observed in the soma and dendritic spines. CGB was localized exquisitely in the soma and shafts of large proximal dendrites with no staining in distal parts of the cell. Scale bar, 20 μm. b, Components inhibiting the InsP3 pathway are more uniformly distributed. Proteins were visualized as in Figure 3a. Inhibitors are depicted in red. Even distribution lacking apparent concentration was found for PMCA1, SERCA2, and parvalbumin. Scale bar, 20 μm.
The distribution of proteins reducing intracellular Ca2+ levels was similar to that found in NGF-treated PC12 cells (compare Figs. 2b, 3b). The Ca2+ pumps PMCA1 and SERCA2 were readily detected throughout the entire neuron lacking obvious subcellular localizations (Fig. 3b). Parvalbumin, a Ca2+ buffer abundant in many neuronal cell types (Baimbridge et al., 1992), was localized to the same extent in the cell body and the dendrites (Fig. 3b). Together, the soma and proximal dendrites of hippocampal neurons in culture appear to concentrate many proteins able to trigger and sustain intracellular Ca2+ transients, whereas inhibiting elements such as pumps and buffers were evenly balanced.
Protein domain composition predicts initiation site for intracellular Ca2+ signals
To test the hypothesis that the spatiotemporal pattern of Ca2+ transients can be predicted by the subcellular localization of proteins involved in InsP3-mediated Ca2+ signaling, we monitored intracellular Ca2+ transients in PC12 cells and cultured hippocampal neurons. If the asymmetric location of chromogranins and PIPKIγ influenced the signal initiation site, the Ca2+ signal should first appear in the branching points and growth cones of the neurites of PC12 cells and in the soma or proximal dendrites of hippocampal neurons.
When NGF-differentiated PC12 cells were stimulated by application of the mAChR agonist carbachol, a rise in [Ca2+]i was observed in both the soma and the growth cones (Fig. 4a, top left). The Ca2+ signal clearly initiated in the neurite followed by the cell body after a delay (see expanded time scale in Fig. 4a, bottom left). Averaging over all cells revealed a latency of 0.78 ± 0.28 s between the onset of the Ca2+ transient in the growth cones and the soma (Fig. 4b, left). The signal was of greater amplitude and reached peak values faster in the neurite (Fig. 4b, right). This lower threshold for activation in the growth cones was observed in 83% of cells analyzed (n = 12).
Cultured hippocampal neurons were stimulated with the selective group I mGluR agonist DHPG (50 μm). In an effort to isolate Ca2+ signals attributable to internal release from influx of Ca2+ through voltage-gated Ca2+ channels, neurons with pyramidal-like morphology were held in voltage-clamp mode at resting or hyperpolarizing levels. To suppress network activity, we included the ionotropic glutamate antagonist DNQX (10 μm) in the perfusion media. Consistent with the distributions of CGB and PIPKIγ, we only observed the onset of internal Ca2+ release in the soma or primary dendrite just proximal to the soma. Overall, the apparent site of initiation could be associated either with the soma (38%) or the proximal primary dendrite (62%). Release that began in the soma propagated distally toward the dendrite (Fig. 5a), whereas release initiating in the proximal dendrites propagated bidirectionally (Fig. 5c).
Figure 5.
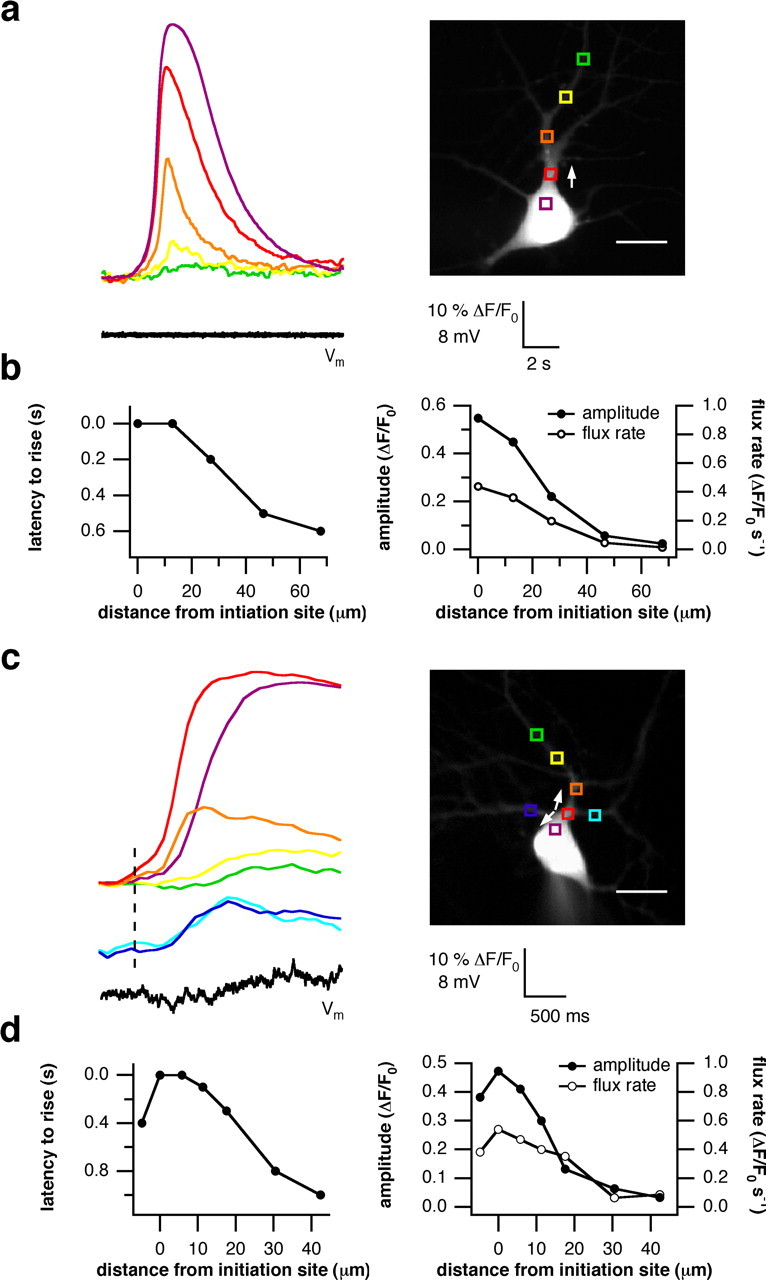
Ca2+ signals in hippocampal neurons initiate in the soma or proximal primary dendrite. Hippocampal neurons in whole-cell patch-clamp configuration were stimulated with 50 μm DHPG by bath application. An elevation in [Ca2+]i was measured as explained in Materials and Methods. a, A typical experiment showing the rise in [Ca2+]i occurred first in the soma adjacent to the proximal apical dendrite and propagated distally (white arrow). The colored boxes in the right panel designate the location on the neuron where the correspondingly colored traces were recorded. b, The latency to rise in [Ca2+]i and the magnitude and flux rate were measured along the main dendritic trunk. Wave propagation velocity, as approximated by the slope of the left graph, was not linear with distance. Ca2+ spread faster near the site of initiation and slowed with increasing distance (left). Similarly, the amplitude and flux rate of the Ca2+ signal were highest at the place of origin and decreased with growing distance (right). c, In another neuron, signal initiation was observed in the proximal primary dendrite. The Ca2+ wave propagated bidirectionally toward the cellbody and into the dendrites (white arrows). The onset of the rise in [Ca2+]i is marked by the dashed line. The main trunk always preceded the oblique dendrites as indicated by the blue traces. d, The latency to rise and the amplitude and flux rate were quantified as in b. The propagation velocity again was nonlinear, and the highest and fastest signals were found at the initiation site. Scale bars: a, c, 20 μm.
By plotting the latency between the onset of the signal in the soma and in the distal dendrites as a function of increasing distance (Fig. 5b,d, left), it could be seen that the propagation velocity was not uniform. The Ca2+ signal spread faster near the site of initiation and slowed as it traveled out. There also was a gradual decrease in amplitude and rate of rise as the wave spread along the main dendritic trunk into distal branches (Fig. 5b,d, right). Ca2+ transients near the soma were characterized by a greater magnitude and high flux rate; signals in the distal branches were low in amplitude and rate of rise. A comparison of the kinetics of the three analyzed parameters for a single neuron showed a high degree of congruency. In all cells, the signal recorded at the initiation site was always the greatest in amplitude and rate of rise compared with the transients measured further away.
Functional chromogranin-InsP3R coupling contributes to shaping Ca2+ transients
Chromogranin proteins are predicted to be an enhancing element of InsP3-mediated Ca2+ release (Thrower et al., 2002, 2003). To test this prediction, the chromogranin-InsP3R interaction was inhibited by expressing a CGB polypeptide fragment that has been shown to disrupt their functional coupling (Choe et al., 2004). PC12 cells were transfected either with the chromogranin fragment or with a scrambled peptide as control, or were not transfected. The distribution of the InsP3R was unchanged by this treatment. When stimulated, cells transfected with the scrambled peptide displayed increases in intracellular Ca2+ in the growth cone first with the signal appearing in the soma after a delay of 2.0 s (Fig. 6a). This order was reversed in cells expressing the CGB fragment: Ca2+ levels rose first in the soma followed by the neurite after 2.0 s (Fig. 6b). Overall, there was no difference in the signal delay between untransfected cells and cells transfected with the scrambled peptide (1.78 ± 0.54 vs 1.83 ± 0.33 s). The CGB fragment, however, significantly altered the site of initiation in favor of the soma (-0.83 ± 0.59 s) (Fig. 6c). These data provide a strong argument for the involvement of chromogranins in shaping intracellular Ca2+ transients. Unexpectedly, when the chromogranin-InsP3R coupling was inhibited, the magnitude and rate of rise of the Ca2+ signal were depressed to a greater extent in the cell body. Again, no difference was observed between controls and cells transfected with the scrambled peptide (Fig. 6d). The average values for the neurites were as follows (percentage of controls): 102 ± 11 and 106 ± 26 for amplitude and flux rate with the scrambled peptide, respectively; 63 ± 12 and 35 ± 13 for amplitude and flux rate with the CGB fragment, respectively. The average values for the soma were as follows (percentage of controls): 91 ± 14 and 91 ± 30 for amplitude and flux rate with the scrambled peptide, respectively; 31 ± 10 and 14 ± 7 for amplitude and flux rate with the CGB fragment, respectively.
Figure 6.
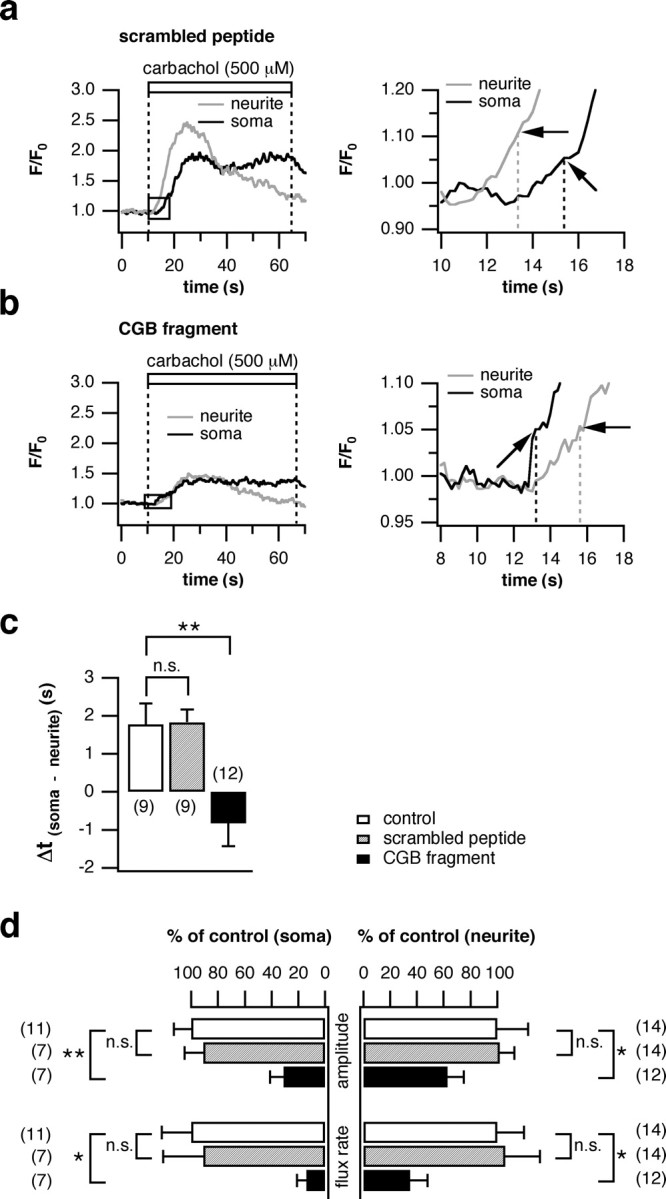
Blocking the stimulating effect of CGB on the InsP3R changes the initiation site. PC12 cells were transfected with a CGB polypeptide fragment to interfere with the CGB-InsP3R interaction. Experiments using a scrambled peptide with a random amino acid sequence served as controls. a, Traces were recorded, as outlined in Figure 4, from the soma and growth cones of a representative cell transfected with the scrambled peptide. An expanded time scale is shown on the right. There was no change in the initiation site of the Ca2+ signal (black arrows) compared with untransfected cells. b, In cells transfected with the CGB fragment, the rise in [Ca2+]i occurred in the soma first (black arrows). An expanded time scale is shown on the right. c, Quantification of all cells analyzed illustrates that the fragment significantly shifted the initiation site of the Ca2+ signal to the soma compared with untransfected cells or cells transfected with the scrambled peptide (latency to rise, -0.83 ± 0.59 vs 1.78 ± 0.54 vs 1.83 ± 0.33 s, respectively). d, The amplitude and flux rate were measured in all three settings and are shown for the soma and neurite. Although the parameters were not affected by transfection with the scrambled peptide, the CGB fragment markedly decreased them. Data in c and d are presented as the average of the number of cells in parentheses (±SEM). n.s., Not significant. *p < 0.05; **p < 0.01.
Reduction of PIP2 levels alters the site of signal initiation
The asymmetric distribution of PIPKIγ lead to the suggestion that higher PIP2 levels in “hot spots” could play a role in explaining the distinct spatiotemporal pattern of Ca2+ signals. We therefore inhibited PIPKIγ function by depriving the enzyme of its substrate PIP by treating NGF-differentiated PC12 cells with wortmannin, an inhibitor of type III PI4K (Downing et al., 1996; Meyers and Cantley, 1997). Cells were preincubated for 20 min in growth medium supplemented with 10 μm wortmannin, a dose sufficient to block all PI4KIII activity and decrease PIP levels (Sorensen et al., 1998). Treated cells were then stimulated with carbachol, and Ca2+ signals were recorded. In contrast to untreated cells, the rise in [Ca2+]i in a representative cell pretreated with wortmannin clearly initiated in the soma (Fig. 7a). Both the amplitude and flux rate were greatly depressed in the growth cone, whereas the soma seemed less affected. The average temporal delay for wortmannin was -1.87 ± 0.52 s, indicating that the rise in [Ca2+]i in the cell body preceded the growth cones by almost 2 s (Fig. 7e). The latency between the onset of the signal in the neurite and the soma was 1.31 ± 0.29 s for control cells. Thus, incubation with wortmannin reversed the order in which the signal initiated in the two cell compartments. This result strongly implicates PIPKIγ as an important component in determining the site of signal initiation.
Figure 7.

Wortmannin shifts the initiation site of the Ca2+ signal to the soma by reduction of PIP2. a, PC12 cells were treated with 10 μm wortmannin for 20 min and stimulated with 500 μm bath-applied carbachol for 60 s. An elevation in [Ca2+]i was monitored and analyzed as in Figure 4. The time course of the Ca2+ signals recorded in the neurite and soma of a representative cell are shown on the left; a magnification is shown on the right. The site of initiation shifted strikingly in favor of the soma (black arrows) compared with untreated cells (latency to rise, -1.87 ± 0.52 vs 1.31 ± 0.29 s; e). b, PC12 cells were incubated for 20 min with different concentrations of wortmannin, and Ca2+ signals were elicited as above. The temporal delay between the rise in [Ca2+]i in the growth cones and soma was plotted against increasing wortmannin concentrations. A sigmoid function was fitted to the dose-response curve. c, The magnitude of the signal was plotted and fitted with a sigmoid function as in b. The inset shows the ratio of values obtained under control conditions to values measured with 50 μm wortmannin and represents a measure for the efficacy of wortmannin inhibition in the two cell compartments. The amplitude declined 48-fold in the growth cones as opposed to six fold in the soma. d, The dose-response curve for the flux rate was obtained as described in b. As shown in the inset, the flux rate was decreased by a factor of 12 in the growth cones and merely by 5 in the cell body. Wortmannin concentrations <1 μm do not inhibit PI4KIII and consequently did not affect any of the analyzed parameters when compared with control values. Increasing wortmannin to 50 μm resulted in a considerable reduction of each of the parameters. All three graphs were congruent, and the IC50 value was between 5 and 7.5 μm. e, Incubation with 100 μm LY294002, a selective inhibitor of PI3K, did not affect the initiation site compared with controls (1.78 ± 0.54 vs 1.31 ± 0.29 s), whereas 40 μm R59022, a DAG kinase blocker, shifted it to the soma (-0.49 ± 0.40 s), further suggesting the observed effect was caused by PI4KIII inhibition. Data points in b-d are averages of at least eight cells ± SEM. Data in e a represented as the average of the number of cells in parentheses (± SEM). n.s., Not significant. **p < 0.01.
Wortmannin not only affects PI4K but also PI3K and myosin light chain kinase (Nakanishi et al., 1995). Therefore, we needed to show that the shift in the site of signal origin was achieved by inhibition of PI4K and not by another kinase. First, PC12 cells were incubated for 20 min with increasing doses of wortmannin (from 1 nm to 50 μm), and the carbachol-induced changes in [Ca2+]i were recorded (Fig. 7b-d). Wortmannin concentrations in the nanomolar range are sufficient to potently inhibit PI3K (Sorensen et al., 1998). However, no effect on any of the parameters analyzed was observed below 1 μm (Table 1). Between 1 and 50 μm, the ability of the growth cone to generate early Ca2+ responses was markedly reduced, indicated by the gradual decrease in measured latency. At 50 μm, the neurite trailed behind the soma by 2.6 s (Fig. 7b). Very similar kinetics were observed for the magnitude. The dose-response curve shows that under control conditions the growth cones released twofold more Ca2+ from their intracellular stores compared with the cell body and that this proportion changed with increasing wortmannin doses (Fig. 7c). The ratio of the magnitude obtained under control conditions and with 50 μm wortmannin shows that there was a decrease by a factor of 6 in the cell body, and the amplitude in the neurite declined by a factor of 48 (Fig. 7c, inset). Consistent with the reduction in latency to rise and magnitude, the flux rate of the Ca2+ signal decreased in the same wortmannin range (Fig. 7d). This parameter reflects InsP3R open probability during the main activation phase (Ogden and Capiod, 1997). Again, a decrease was observed only at wortmannin concentrations >1 μm. The ratio of reduction, as calculated for the amplitude, was 12 for the growth cones and 5 for the soma (Fig. 7d, inset).
Table 1.
Effects of kinase inhibitors and peptide fragments on the kinetics of Ca2+ transients
|
|
Amplitude (percentage of change vs control) |
Flux rate (percentage of change vs control) |
n |
|---|---|---|---|
| Wortmannin (1 μm, soma) | −10 ± 16a | −17 ± 13a | 20 |
| Wortmannin (1 μm, neurite) | −1 ± 16a | 2 ± 22a | 20 |
| Wortmannin (50 μm, soma) | −78 ± 4 (p < 0.001) | −83 ± 1 (p < 0.01) | 8 |
| Wortmannin (50 μm, neurite) | −98 ± 2 (p < 0.01) | −92 ± 1 (p < 0.05) | 8 |
| LY294002 (100 μm, soma) | 10 ± 26a | 10 ± 32a | 8 |
| LY294002 (100 μm, neurite) | −3 ± 19a | −5 ± 27a | 9 |
| R59022 (40 μm, soma) | −64 ± 10 (p < 0.01) | −71 ± 9 (p < 0.01) | 5 |
| R59022 (40 μm, neurite) | −73 ± 3 (p < 0.05) | −81 ± 2 (p < 0.001) | 7 |
| Scrambled peptide (soma) | −9 ± 14a | −9 ± 30a | 7 |
| Scrambled peptide (neurite) | 2 ± 11a | 6 ± 26a | 14 |
| CGB fragment (soma) | −69 ± 10 (p < 0.01) | −86 ± 7 (p < 0.05) | 7 |
| CGB fragment (neurite) |
−37 ± 12 (p < 0.05) |
−65 ± 13 (p < 0.05) |
12 |
In three sets of experiments, cells were incubated with the indicated concentrations of (1) wortmannin (20 min) and (2) LY294002 (20 min) or R59022 (10 min) or (3) were transfected with the scrambled peptide or CGB fragment. Untreated cells served as controls for the lipid kinase inhibitors and the scrambled peptide, the latter as the control for the fragment.
Not significant.
The IC50 value for the effect of wortmannin on the parameters analyzed was ∼7.5 μm. This is three orders of magnitude higher than the concentrations needed to inhibit PI3K (Sorensen et al., 1998). To further demonstrate that the effect achieved with wortmannin can be explained by PI4K inhibition, we preincubated PC12 cells for 20 min with 100 μm LY294002, a selective inhibitor of PI3K (Vlahos et al., 1994; Suh and Hille, 2002) and recorded the carbachol-induced Ca2+ signals. There was no effect on the latency, amplitude, or rate of rise of [Ca2+]i (Fig. 7e; Tables 1, 2). Furthermore, depleting the cell of PI, which is the substrate of PI4K, also would be expected to affect the spatiotemporal pattern of Ca2+ transients. PC12 cells were pretreated for 10 min with 40 μm R59022, a DAG kinase inhibitor. This interrupts the lipid cycle after DAG, and PI cannot be replenished from phosphatidic acid (Ford et al., 2003) (Fig. 1). As expected, all three parameters were altered as seen for wortmannin (Fig. 7e; Tables 1, 2). These results support the prediction that reduction of PIP2 levels by (indirect) PIPKIγ inhibition is the mechanism for the change in spatiotemporal Ca2+ signaling (Fig. 7a) and that asymmetric levels of PIP2 within a cell play a role in shaping the pattern of Ca2+ signals.
Table 2.
Effects of kinase inhibitors and peptide fragments on the initiation site of Ca2+ transients
|
|
Control (s) |
Treatment (s) |
n |
|---|---|---|---|
| Wortmannin (1 μm) | 0.78 ± 0.28 | 0.15 ± 0.33a | 20 |
| Wortmannin (50 μm) | 0.78 ± 0.28 | −2.60 ± 0.40 (p < 0.001) | 8 |
| LY294002 (100 μm) | 1.31 ± 0.29 | 1.78 ± 0.54a | 9 |
| R59022 (40 μm) | 1.31 ± 0.29 | −0.49 ± 0.40 (p < 0.01) | 7 |
| Scrambled peptide | 1.76 ± 0.52 | 1.83 ± 0.34a | 9 |
| CGB fragment |
1.83 ± 0.34 |
−0.83 ± 0.59 (p < 0.001) |
12 |
The delay between the onset of the signal in the neurite and the soma is displayed as ▵t(soma - neurite). In three sets of experiments, cells were incubated with the indicated concentrations of (1) wortmannin (20 min) and (2) LY294002 (20 min) or R59022 (10 min) or (3) were transfected with the scrambled peptide or CGB fragment. Untreated cells served as controls for the lipid kinase inhibitors and the scrambled peptide, the latter as the control for the fragment.
Not significant.
Discussion
The experiments described here demonstrate that neuronal cells can modulate the kinetics and initiation sites of Ca2+ transients by differentially distributing proteins involved in the InsP3 signaling cascade. Our observations suggest that proteins that increase InsP3R open probability by increasing PIP2 production (PIPKIγ) and receptor sensitization (chromogranin proteins) are purposefully targeted to specific sections of the neuron. These protein elements become the building blocks of specialized domains enabling the cell to generate early, high-amplitude, and fast Ca2+ signals in these compartments. In the neuron types investigated here, the location of the highest density of PIPKIγ and CGB predicted the site of Ca2+ signal initiation.
Previously, the localization of Ca2+ release channels in PC12 cells was examined (Johenning et al., 2002). The low-threshold InsP3 sensor InsP3R1 was found throughout the entire cell, whereas the high-threshold sensor InsP3R3 was targeted predominately to the soma. Therefore, the distribution of InsP3Rs alone cannot explain the differences in Ca2+ signaling in PC12 cells unless heterotetrameric InsP3R (combinations of type 1 and 3 InsP3R) are formed in the cell body with a significantly lower affinity for InsP3. PLCβ-coupled receptors in the plasma membrane for the muscarinic agonist carbachol, mAChRs, were found mainly in the soma and only in smaller clusters along the neurite (Johenning et al., 2002), again suggesting that the localization of this protein cannot account for the signaling differences observed. In contrast, the distribution of PIPKIγ and CGB in PC12 cells described in this study is an explanation.
In hippocampal neurons, many elements enhancing InsP3-mediated Ca2+ signaling were localized predominately in the soma or proximal apical dendrite, most notably PIPKIγ and CGB, whereas Ca2+ buffers and pumps were distributed uniformly (Fig. 3a,b). As predicted by our model and consistent with previous reports (Pozzo-Miller et al., 1996; Yeckel et al., 1999; Kapur et al., 2001; Larkum et al., 2003), the Ca2+ signal began in the proximal dendrites or soma (Fig. 5a,c), regions that also exhibited the highest amplitude and flux rate for the Ca2+ transients (Fig. 5b,d). Moreover, the Ca2+ wave spread faster in central compartments where high concentrations of proteins activating the InsP3 pathway were located and slowed in the periphery where levels of these proteins were diminished (Fig. 5b,d). Together, these results support the concept that protein domains enhance intracellular Ca2+ signaling and that conclusions generated from experiments with neuronally differentiated PC12 cells can be adapted to other types of neurons.
The striking effect on the initiation site and kinetics of the Ca2+ transient achieved by blocking PI4KIII and, indirectly, PIPKIγ with wortmannin (Fig. 7) clearly implies a role for PIP and PIP2 as immediate InsP3 precursors in shaping spatiotemporal Ca2+ signaling patterns. The expectation was that the decrease in phospholipid levels after incubation with wortmannin would affect the soma and growth cones to the same extent, because PI4K distribution was uniform (Fig. 2a). However, the relative decrease of the measured parameters for Ca2+ signals as represented by the ratio of the control values to the values obtained with full wortmannin inhibition was not the same for the soma and the growth cone (Fig. 7c,d, insets; Table 1). This meant that factors in addition to phospholipid levels alone needed to be considered. The chromogranin proteins were likely candidates because of their asymmetric distribution similar to PIPKIγ (Fig. 2a). By disrupting the interaction between CGB and the InsP3R with a CGB polypeptide fragment (Choe et al., 2004), the site of initiation was shifted to the soma (Fig. 6b,c). This result shows that the functional channel complex consisting of the InsP3R and CGB is crucial for shaping intracellular Ca2+ signals. The observation that the CGB fragment altered the site of initiation in favor of the cell body but reduced the amplitude and flux rate to a greater extent in this compartment was unexpected (Fig. 6d). The possibility that the CGB fragment was localized to the soma was ruled out because examination of myc-tagged CGB fragment confirmed that the polypeptide is expressed to the same degree in the cell body and the neurites (data not shown). Another possibility is that not all CGB-InsP3R interaction is disrupted in the growth cones because of the abundance of native CGB, further emphasizing the importance of CGB for local Ca2+ signaling in the neurites as the initiation site is shifted despite functional complexes remaining.
With the components of the Ca2+ signaling tool kit identified here, it is possible to propose a model to explain the diverse spatiotemporal patterns of InsP3-mediated neuronal Ca2+ signals. When PIP is abundant in the entire cell, the first rate-limiting step in InsP3 synthesis is PIPKIγ activity. PIP2 levels are considerably higher in the neurite as a consequence of the higher density of PIPKIγ in the growth cones as described here (Fig. 2a) and in other systems in which the synapses of primary neurons are rich in PIPKIγ and PIP2 (Micheva et al., 2001; Wenk et al., 2001). The large pool of PIP2 substrate for PLCβ is vital for compensating for the asymmetric localization of mAChRs, the second major factor determining InsP3 generation. Given the low density of receptors in the growth cones, only small amounts of PLCβ can be activated after stimulation with muscarinic agonists. Consequently, PIP2 cannot be efficiently metabolized in the neurite to yield high InsP3 levels. Previous experiments have already excluded the possibility of increased InsP3 production in the neurite as the mechanism underlying the observed temporal delay (Johenning et al., 2002). The InsP3 levels in the neurite still suffice to generate signals of higher magnitude and flux rate compared with the soma, because the InsP3Rs in the growth cones are more sensitive to their ligand and a better surface/volume ratio favors the neurite. Higher sensitivity is conferred by multiple factors, including the location of higher-affinity InsP3R1s and high chromogranin levels (Fig. 2a).
Inhibiting PI4KIII with wortmannin drastically reduces PIP levels uniformly throughout the cell (Sorensen et al., 1998), and the PIP concentration becomes rate limiting in InsP3 synthesis. The nonuniform distribution of PIPK is of no further consequence. The low density of mAChRs in the neurite is no longer sufficient to generate adequate InsP3 concentrations in the neurite, because the growth cone is dependent on an abundant supply of PIP2 to ensure that activation of PLCβ to cleave PIP2 is efficient. This can be seen as the disproportionate decline in amplitude and flux rate of [Ca2+]i in the neurite in relation to the soma (Fig. 7c,d; Table 1). Under these conditions, high CGB levels are insufficient to adequately sensitize the InsP3R, and the synergism between receptor activation by elevated InsP3 precursors and high chromogranin concentrations breaks down. Support for the notion that synergistic receptor activation in the neurite is crucial for efficient intracellular Ca2+ signaling comes from the observation that early interference in the InsP3 pathway with wortmannin affects the magnitude and rate of rise of the Ca2+ transient to a greater degree than late inhibition with the CGB fragment (Table 1).
Additional variables are certain to influence InsP3-mediated signaling. Phosphorylation of the InsP3R in the neurite increasing sensitivity for its ligand (Tang et al., 2003) may play a role as well as differing densities of InsP3R1 and InsP3R3 throughout the cell (Shuai and Jung, 2003). Although RyRs do not seem to influence signal initiation, the higher concentration of RyRs in the soma could compensate for the high-threshold InsP3R3, facilitating Ca2+ release (Johenning et al., 2002). Higher-ordered structures that link together receptors, G-proteins, PLCs, and InsP3Rs by scaffolding proteins such as Vesl/Homer guarantee specificity of signal transduction and prevent unwanted cross talk between different signaling pathways (Delmas et al., 2002). Overall, the interactions among the components of the Ca2+ signaling cascade in the cells described here indicate how a set of parameters can be manipulated to achieve cell-specific responses.
One purpose for Ca2+ signaling domains in growth cones is particularly intriguing. Ca2+, among other second messengers, is known to regulate neurite outgrowth and guidance of axons by extracellular factors (Hong et al., 2000; Nishiyama et al., 2003). The Ca2+ elevation in growth cones necessary to modulate attraction and repulsion is essentially attributed to influx from the extracellular space through plasma membrane channels and efflux from RyRs. Our data point to the possibility that, in addition, Ca2+ release from InsP3-sensitive internal stores may be specifically boosted by the protein domains found in the growth cones to contribute to axon guiding (Takei et al., 1998).
In conclusion, we provide here experimental data to elucidate the mechanism underlying distinct spatiotemporal Ca2+ signaling patterns in neuronal cells. We have identified the growth cones of neuron-like pheochromocytoma cells as special cell compartments equipped with unique protein machinery to efficiently generate Ca2+ transients. By favoring the Ca2+“source” over the “sink,” these cells establish protein domains to enhance InsP3-mediated Ca2+ signaling, ensuring speed and spatial localization of Ca2+ release. Furthermore, we demonstrated that this system is in use in hippocampal neurons, suggesting a general principle in the cell biology of neurons and possibly nonexcitable cells.
Footnotes
This work was supported by grants from the National Institutes of Health (GM63496, DK61747 to B.E.E., and MH67830 to M.F.Y.), Whitehall Foundation (M.F.Y.), German National Merit Foundation (S.N.J. and C.-U.C.), and Vetenskapsrådet, the Swedish Research Council (P.U.). We are grateful to J. Fitzpatrick, M. Nathanson, C. Schlecker, A. Varshney, M. Estrada, and S. Krueger for thoughtful discussions and comments on this manuscript and to A. Kolar for invaluable help with the hippocampal neuron cultures.
Correspondence should be addressed to Dr. Barbara E. Ehrlich, Department of Pharmacology, Yale University, 333 Cedar Street, New Haven, CT 06520-8066. E-mail: barbara.ehrlich@yale.edu.
Copyright © 2005 Society for Neuroscience 0270-6474/05/252853-12$15.00/0
References
- Baimbridge KG, Celio MR, Rogers JH (1992) Calcium-binding proteins in the nervous system. Trends Neurosci 15: 303-308. [DOI] [PubMed] [Google Scholar]
- Barylko B, Gerber SH, Binns DD, Grichine N, Khvotchev M, Sudhof TC, Albanesi JP (2001) A novel family of phosphatidylinositol 4-kinases conserved from yeast to humans. J Biol Chem 276: 7705-7708. [DOI] [PubMed] [Google Scholar]
- Berridge MJ (1998) Neuronal calcium signaling. Neuron 21: 13-26. [DOI] [PubMed] [Google Scholar]
- Bezprozvanny I, Watras J, Ehrlich BE (1991) Bell-shaped calcium-response curves of Ins1,4,5P3- and calcium-gated channels from endoplasmic reticulum of cerebellum. Nature 351: 751-754. [DOI] [PubMed] [Google Scholar]
- Brewer GJ, Torricelli JR, Evege EK, Price PJ (1993) Optimized survival of hippocampal neurons in B27-supplemented Neurobasal, a new serum-free medium combination. J Neurosci Res 35: 567-576. [DOI] [PubMed] [Google Scholar]
- Choe CU, Harrison KD, Grant W, Ehrlich BE (2004) Functional coupling of chromogranin with the inositol 1,4,5-trisphosphate receptor shapes calcium signaling. J Biol Chem 279: 35551-35556. [DOI] [PubMed] [Google Scholar]
- Czech MP (2003) Dynamics of phosphoinositides in membrane retrieval and insertion. Annu Rev Physiol 65: 791-815. [DOI] [PubMed] [Google Scholar]
- Delmas P, Wanaverbecq N, Abogadie FC, Mistry M, Brown DA (2002) Signaling microdomains define the specificity of receptor-mediated InsP3 pathways in neurons. Neuron 34: 209-220. [DOI] [PubMed] [Google Scholar]
- Downing GJ, Kim S, Nakanishi S, Catt KJ, Balla T (1996) Characterization of a soluble adrenal phosphatidylinositol 4-kinase reveals wortmannin sensitivity of type III phosphatidylinositol kinases. Biochemistry 35: 3587-3594. [DOI] [PubMed] [Google Scholar]
- Ford CP, Stemkowski PL, Light PE, Smith PA (2003) Experiments to test the role of phosphatidylinositol 4,5-bisphosphate in neurotransmitter-induced M-channel closure in bullfrog sympathetic neurons. J Neurosci 23: 4931-4941. [DOI] [PMC free article] [PubMed] [Google Scholar]
- Furuichi T, Mikoshiba K (1995) Inositol 1,4,5-trisphosphate receptor-mediated Ca2+ signaling in the brain. J Neurochem 64: 953-960. [DOI] [PubMed] [Google Scholar]
- Hagar RE, Burgstahler AD, Nathanson MH, Ehrlich BE (1998) Type III InsP3 receptor channel stays open in the presence of increased calcium. Nature 396: 81-84. [DOI] [PMC free article] [PubMed] [Google Scholar]
- Hong K, Nishiyama M, Henley J, Tessier-Lavigne M, Poo M (2000) Calcium signalling in the guidance of nerve growth by netrin-1. Nature 403: 93-98. [DOI] [PubMed] [Google Scholar]
- Johenning FW, Zochowski M, Conway SJ, Holmes AB, Koulen P, Ehrlich BE (2002) Distinct intracellular calcium transients in neurites and somata integrate neuronal signals. J Neurosci 22: 5344-5353. [DOI] [PMC free article] [PubMed] [Google Scholar]
- Johenning FW, Wenk MR, Uhlen P, Degray B, Lee E, De Camilli P, Ehrlich BE (2004) InsP3-mediated intracellular calcium signalling is altered by expression of synaptojanin-1. Biochem J 382: 687-694. [DOI] [PMC free article] [PubMed] [Google Scholar]
- Kapur A, Yeckel M, Johnston D (2001) Hippocampal mossy fiber activity evokes Ca2+ release in CA3 pyramidal neurons via a metabotropic glutamate receptor pathway. Neuroscience 107: 59-69. [DOI] [PMC free article] [PubMed] [Google Scholar]
- Koizumi S, Bootman MD, Bobanovic LK, Schell MJ, Berridge MJ, Lipp P (1999) Characterization of elementary Ca2+ release signals in NGF-differentiated PC12 cells and hippocampal neurons. Neuron 22: 125-137. [DOI] [PubMed] [Google Scholar]
- Larkum ME, Watanabe S, Nakamura T, Lasser-Ross N, Ross WN (2003) Synaptically activated Ca2+ waves in layer 2/3 and layer 5 rat neocortical pyramidal neurons. J Physiol (Lond) 549: 471-488. [DOI] [PMC free article] [PubMed] [Google Scholar]
- Meyers R, Cantley LC (1997) Cloning and characterization of a wortmannin-sensitive human phosphatidylinositol 4-kinase. J Biol Chem 272: 4384-4390. [DOI] [PubMed] [Google Scholar]
- Micheva KD, Holz RW, Smith SJ (2001) Regulation of presynaptic phosphatidylinositol 4,5-biphosphate by neuronal activity. J Cell Biol 154: 355-368. [DOI] [PMC free article] [PubMed] [Google Scholar]
- Nakamura T, Barbara JG, Nakamura K, Ross WN (1999) Synergistic release of Ca2+ from IP3-sensitive stores evoked by synaptic activation of mGluRs paired with backpropagating action potentials. Neuron 24: 727-737. [DOI] [PubMed] [Google Scholar]
- Nakamura T, Nakamura K, Lasser-Ross N, Barbara JG, Sandler VM, Ross WN (2000) Inositol 1,4,5-trisphosphate (IP3)-mediated Ca2+ release evoked by metabotropic agonists and backpropagating action potentials in hippocampal CA1 pyramidal neurons. J Neurosci 20: 8365-8376. [DOI] [PMC free article] [PubMed] [Google Scholar]
- Nakanishi S, Catt KJ, Balla T (1995) A wortmannin-sensitive phosphatidylinositol 4-kinase that regulates hormone-sensitive pools of inositolphospholipids. Proc Natl Acad Sci USA 92: 5317-5321. [DOI] [PMC free article] [PubMed] [Google Scholar]
- Nishiyama M, Hoshino A, Tsai L, Henley JR, Goshima Y, Tessier-Lavigne M, Poo MM, Hong K (2003) Cyclic AMP/GMP-dependent modulation of Ca2+ channels sets the polarity of nerve growth-cone turning. Nature 424: 990-995. [DOI] [PubMed] [Google Scholar]
- Ogden D, Capiod T (1997) Regulation of Ca2+ release by InsP3 in single guinea pig hepatocytes and rat Purkinje neurons. J Gen Physiol 109: 741-756. [DOI] [PMC free article] [PubMed] [Google Scholar]
- Patel S, Joseph SK, Thomas AP (1999) Molecular properties of inositol 1,4,5-trisphosphate receptors. Cell Calcium 25: 247-264. [DOI] [PubMed] [Google Scholar]
- Pozzo-Miller LD, Petrozzino JJ, Golarai G, Connor JA (1996) Ca2+ release from intracellular stores induced by afferent stimulation of CA3 pyramidal neurons in hippocampal slices. J Neurophysiol 76: 554-562. [DOI] [PubMed] [Google Scholar]
- Rizzuto R (2001) Intracellular Ca2+ pools in neuronal signalling. Curr Opin Neurobiol 11: 306-311. [DOI] [PubMed] [Google Scholar]
- Sharp AH, Nucifora Jr FC, Blondel O, Sheppard CA, Zhang C, Snyder SH, Russell JT, Ryugo DK, Ross CA (1999) Differential cellular expression of isoforms of inositol 1,4,5-triphosphate receptors in neurons and glia in brain. J Comp Neurol 406: 207-220. [PubMed] [Google Scholar]
- Shuai JW, Jung P (2003) Optimal ion channel clustering for intracellular calcium signaling. Proc Natl Acad Sci USA 100: 506-510. [DOI] [PMC free article] [PubMed] [Google Scholar]
- Sorensen SD, Linseman DA, McEwen EL, Heacock AM, Fisher SK (1998) A role for a wortmannin-sensitive phosphatidylinositol-4-kinase in the endocytosis of muscarinic cholinergic receptors. Mol Pharmacol 53: 827-836. [PubMed] [Google Scholar]
- Suh BC, Hille B (2002) Recovery from muscarinic modulation of M current channels requires phosphatidylinositol 4,5-bisphosphate synthesis. Neuron 35: 507-520. [DOI] [PubMed] [Google Scholar]
- Takei K, Shin RM, Inoue T, Kato K, Mikoshiba K (1998) Regulation of nerve growth mediated by inositol 1,4,5-trisphosphate receptors in growth cones. Science 282: 1705-1708. [DOI] [PubMed] [Google Scholar]
- Tang TS, Tu H, Wang Z, Bezprozvanny I (2003) Modulation of type 1 inositol (1,4,5)-trisphosphate receptor function by protein kinase a and protein phosphatase 1α. J Neurosci 23: 403-415. [DOI] [PMC free article] [PubMed] [Google Scholar]
- Thrower EC, Park HY, So SH, Yoo SH, Ehrlich BE (2002) Activation of the inositol 1,4,5-trisphosphate receptor by the calcium storage protein chromogranin A. J Biol Chem 277: 15801-15806. [DOI] [PubMed] [Google Scholar]
- Thrower EC, Choe CU, So SH, Jeon SH, Ehrlich BE, Yoo SH (2003) A functional interaction between chromogranin B and the inositol 1,4,5-trisphosphate receptor/Ca2+ channel. J Biol Chem 278: 49699-49706. [DOI] [PubMed] [Google Scholar]
- Vlahos CJ, Matter WF, Hui KY, Brown RF (1994) A specific inhibitor of phosphatidylinositol 3-kinase, 2-(4-morpholinyl)-8-phenyl-4H-1-benzopyran-4-one (LY294002). J Biol Chem 269: 5241-5248. [PubMed] [Google Scholar]
- Watt SA, Kular G, Fleming IN, Downes CP, Lucocq JM (2002) Subcellular localization of phosphatidylinositol 4,5-bisphosphate using the pleckstrin homology domain of phospholipase C delta1. Biochem J 363: 657-666. [DOI] [PMC free article] [PubMed] [Google Scholar]
- Wenk MR, Pellegrini L, Klenchin VA, Di Paolo G, Chang S, Daniell L, Arioka M, Martin TF, De Camilli P (2001) PIP kinase Igamma is the major PI4,5P2 synthesizing enzyme at the synapse. Neuron 32: 79-88. [DOI] [PubMed] [Google Scholar]
- Winkler H, Fischer-Colbrie R (1992) The chromogranins A and B: the first 25 years and future perspectives. Neuroscience 49: 497-528. [DOI] [PMC free article] [PubMed] [Google Scholar]
- Yeckel MF, Kapur A, Johnston D (1999) Multiple forms of LTP in hippocampal CA3 neurons use a common postsynaptic mechanism. Nat Neurosci 2: 625-633. [DOI] [PMC free article] [PubMed] [Google Scholar]
- Yuste R, Majewska A, Cash SS, Denk W (1999) Mechanisms of calcium influx into hippocampal spines: heterogeneity among spines, coincidence detection by NMDA receptors, and optical quantal analysis. J Neurosci 19: 1976-1987. [DOI] [PMC free article] [PubMed] [Google Scholar]
- Zucker RS (1989) Short-term synaptic plasticity. Annu Rev Neurosci 12: 13-31. [DOI] [PubMed] [Google Scholar]