

Abstract
Neurons of the mammalian nervous system express the proton-sensing ion channel ASIC1. Low concentrations of protons in the normal range of extracellular pH, pH 7.4–7.3, shut the pore by a conformational transition referred as steady-state desensitization. Therefore, the potential of local acidification to open ASIC1 relies on proton affinity for desensitization. This property is important physiologically and also can be exploited to develop strategies to increase or decrease the channel response to protons. In a previous study (Li, T., Yang, Y., and Canessa, C. M. (2010) J. Biol. Chem. 285, 22706–22712), we found that Leu-85 in the β1-β2 linker of the extracellular domain decreases the apparent proton affinity for steady-state desensitization and retards openings, slowing down the time course of the macroscopic currents. Here, we show that Asn-415 in the β11-β12 linker works together with the β1-β2 linker to stabilize a closed conformation that delays transition from the closed to the desensitized state. Substitutions of Asn-415 for Cys, Ser, or Gly render ASIC1 responsive to small increases in proton concentrations near the baseline physiological pH.
Keywords: Acid-sensing Ion Channels (ASIC), Allosteric Regulation, Ion Channels, Neuron, Receptor Desensitization
Introduction
ASIC1 is a cation channel activated by external protons (1) expressed in neurons of the central and peripheral nervous systems of all vertebrates (2). ASIC1 has been implicated in modulation of synaptic activity (3) and in worsening neuronal damage induced by brain ischemia (4).
The response of ASIC1 to protons is complex. Fast and large increases of proton concentrations induce currents that decay in the continuous presence of protons, a process referred to as desensitization. In addition, low concentrations of protons, below the levels required for activation, inhibit ASIC1 by steady-state desensitization. In a recent study, we showed that the substitution M85L in the β1-β2 linker of the extracellular domain slows the time course of the macroscopic currents and decreases the apparent proton affinity for steady-state desensitization (5). These effects result from stabilization of a closed conformation by Leu-85 that retards transition from the closed to desensitized state and also delays openings. As a consequence, ASIC1 with Leu-85, such as mammalian and avian channels, exhibits less sensitivity to steady-state desensitization and has currents with a slower time course than channels with Met-85, such as ASIC1 from sharks, fish, and frogs. A question not addressed in the previous work (5) was whether the functional effects arising from the substitution M85L were due to changes in the conformation of the β1-β2 backbone or to interaction of the side chain with a neighboring residue.
The crystal structure of chicken ASIC1 (6, 7) shows Asn-415, the last residue in the β11-β12 linker, as the closest residue with the nitrogen from the amide group of Asn-415 ∼3 Å away from Leu-85. Of note, the two linkers are part of similar structures that connect the transmembrane segments to the extracellular domain in a linear arrangement of the TM1,3 β1-strand, and β1-β2 linker and the TM2, β12-strand, and β11-β12 linker (see Fig. 1).
FIGURE 1.

Crystal structure of cASIC1 according to Jasti et al. (6) shows the front subunit in ribbon representation (yellow) and the other two subunits in surface representation (purple and green). Residues Met-85 in the β1-β2 linker and Asn-415 in the β11-β12 linker are shown in red. Expansion of the area is demarcated by a square.
Here, we examined whether Asn-415 plays a role in defining the properties of rat and frog ASIC1 channels. The findings indicate that changing residue Asn-415 decreases proton affinity of steady-state desensitization and slows the decay of the currents. These effects, however, are additive to those produced by Leu-85 consistent with the β1-β2 and β11-β12 linkers contributing independently in the stabilization of a closed conformation of ASIC1.
EXPERIMENTAL PROCEDURES
Molecular Biology
Point mutations were introduced into cDNAs of Xenopus ASIC1.1-V5 in pcDNA3.1 and rat ASIC1a in pCR2.1 using QuikChange (Agilent). All products were sequenced to confirm the presence of the mutations. cDNAs were transcribed in vitro using the T7 mMESSAGE mMACHINE kit (Ambion). Each Xenopus laevis oocyte was injected with 5 ng of cRNA in a volume of 50 nl. Electrophysiological studies were made 2–3 days after injection. Xenopus oocytes were prepared by standard procedures (8) from frog ovaries purchased from Nasco.
Biotinylation of Proteins and Western Blotting
Fifteen oocytes per condition were biotinylated with sulfo-NHS-SS-biotin (Pierce) on ice. After lysis of cells with 1% Triton X-100 and centrifugation at 8,000 × g for removal of the yolk, biotinylated proteins were recovered with streptavidin beads (Pierce). The beads were washed with 1% Triton X-100 and 300 mm NaCl. Biotinylated proteins were eluted from beads, resolved in 10% SDS-PAGE, and transferred to PVDF membranes (Immobilon). xASIC1.1 was detected with anti-V5 monoclonal (Invitrogen) and rASIC1a with a rabbit polyclonal antibody against the carboxyl terminus raised previously by our group (9). Signals were developed with ECL Plus (Amersham Biosciences) and exposed to BioMax MR film (Eastman Kodak).
Two-electrode voltage clamp recordings of oocytes were done using the Clamp OC-725B amplifier (Warner Instrument Corp., Hamden, CT). Data were digitized at a sampling rate of 2 kHz (PowerLab 4/30, ADInstruments). Oocytes were placed in a recording chamber (400 μl) perfused by gravity at a rate of 4 ml/min and impaled with two glass microelectrodes filled with 3 m KCl with a resistance <1 megohm. Composition of the standard bath solution was as follows: 120 mm NaCl, 2 mm KCl, 1.5 mm CaCl2, 15 mm HEPES-MES. The pH was adjusted to obtain a series of solutions differing by 0.1 pH units from pH 7.8 to 6.5. The same set of solutions was used in all experiments to minimize variations owing to the calibration of pH. All experiments were conducted at room temperature.
Apparent proton affinities were calculated with Equation 1.
Time constants for the rise and decay phases were obtained by fitting the time course of currents to the Equation 2,
where Io is a scaling factor.
Aminoethyl-methanethiosulfonate hydrobromide (MTSEA) (Anatrace) was diluted to 2.5 mm in bath solution, and the pH was adjusted to the desired value. MTSEA was replaced with a freshly prepared solution every 10 min. Time constants for modification (τ) were obtained by fitting the data points with a single exponential function, and apparent modification rates (R) were calculated according to Equation 3,
where [M] is the concentration of MTSEA.
Patch clamp recordings were conducted in the outside-out configuration. Patch pipettes were pulled from PG150T glass (Warner Instruments) to a tip diameter of 2–4 μm after heat polishing. The pipette solution consisted of the following: 120 mm KCl, 5 mm EDTA, 10 mm HEPES titrated with KOH to pH 7.4. Bath and activating solutions were the same as in two-electrode voltage clamp experiments. Activating solutions were applied using a modified Perfusion Fast Step device SF-77B (Warner Instruments) onto which eight perfusion pipettes were mounted. The data acquisition program Pulse, in turn, controlled the SF-77B. Time resolution of the solution exchange device is 0.5 ms as described previously (10). Recordings were made using an EPC-9 amplifier and the Pulse acquisition program (HEKA Electronic). Membrane potential was held at −60 mV. Experiments were conducted at room temperature.
Calculation of Channel Mean Open Times
We followed the approach as described previously (11). Briefly, an idealization was first made from patches containing fewer than three channels opening simultaneously to obtain the number n(t) of channels open as a function of time. The number nc of closing steps in the sweep was also counted. An estimate of the mean open time was obtained as in Equation 4,
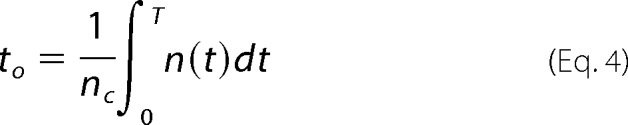 |
where no channels are open at time 0, and the limit T of integration is a time near the end of a sweep where no channels are open.
RESULTS
Activity of ASIC1 Varies According to Amino Acid in Position 415
Asn-415 is a highly conserved residue among the ASICs, only the non-proton-activated mammalian ASIC4 has Thr in this position. The amide group of Asn-415 is in close proximity to Leu-85 in rASIC1a or to Met-85 in xASIC1.1 (Fig. 1). To explore whether channel stabilization mediated by Leu-85 depends on interaction with Asn-415, the latter residue was substituted by Cys, Ser, Gln, Val, or Gly. The selection criteria for the substitutions were as follows. Cys was chosen to test accessibility to thiosulfonate reagents. Ser has a side chain with similar size and polarity to the one of Cys but does not react with sulfhydryl reagent. Gln is larger than Asn, but it has also an amide group. Val is hydrophobic but has a side chain of size equivalent to that of Asn. Finally, Gly only has a hydrogen atom as a side chain, reducing the possibility of interaction with residue in position 85.
Fig. 2, A and B, show the average peak currents evoked by pH 6.5 in rat ASIC1a and Xenopus ASIC1.1. Bars represent the mean ± S.D. of individual oocytes from three independent experiments. Cys, Ser, and Gly induced large currents, whereas Gln and Val were no functional or produced currents of <50 nA/oocyte. Changing the intensity of the stimulus to pH 5.0 produced only a small increase of the response in the latter mutants, suggesting that a acid shift of the proton affinity may not be the underlying explanation for the small currents.
FIGURE 2.

Substitutions of residue Asn-415 change the magnitude of ASIC1 response to external protons. A, whole-cell currents evoked by a change in pH from 7.8 to 6.5 in rat ASIC1a channels bearing the indicated amino acids in position 415. B, similar experiments conducted in Xenopus ASIC1.1. Bars represent the mean of at least 12 oocytes from three different frogs. The error bars represent S.D. C, Western blot analysis of membrane expression of rASIC1a examined with anti-CT rASIC polyclonal antibody. D, Western blot analysis of oocytes expressing xASIC1.1 examined with anti-V5 monoclonal antibody. Each lane represents 12 oocytes. r, rat; x, xenopus.
Oocytes used in electrophysiological experiments were examined subsequently for membrane expression of ASIC1 proteins by Western blot analysis. No significant differences were observed in the intensity of the signals. Even if we take into account a small contamination from the intracellular pool of channels, 5–10% of the signal, this cannot explain the ∼400-fold difference in currents between functional and nearly nonfunctional constructs (Fig. 2, C and D).
Substitutions of Asn-415 Slow the Decay of ASIC1 Currents
Rat ASIC1a and xASIC1.1 bearing the single substitution N415C exhibit currents with slower kinetics than the corresponding wild type channels. Fig. 3A compares representative examples of whole-cell currents from rASIC1a wild type (black trace) and N415C mutant (gray trace) evoked by pH 6.5, which corresponds to the pH50A of rASIC1a. Traces show a slight delay of the rising face but a 4-fold decrease in the decay rate. The same mutation introduced in xASIC1.1 also slowed the kinetics of the macroscopic currents. Fig. 3B shows channels activated by pH 6.9, which is the pH50A of the frog channel. When the mutation N415C was expressed in the background of xASIC1.1-M85L, the effect was additive to that of M85L as illustrated in Fig. 3C.
FIGURE 3.

The substitution N415C slows kinetics of ASIC1 channels. Representative examples of macroscopic scaled currents recorded from oocytes with the two-electrode voltage clamp recordings from rat ASIC1a (A), Xenopus ASIC1.1 (B), and XenopusASIC1.1-M85L (C). The parent channels are shown in black, and the same channel with the mutation N415C is shown in gray. The lines over the traces indicate the duration of the activating stimulus. The activating pH was 6.5 for rASIC1a and 7.0 for xASIC1.1. Holding potential, −60 mV. The time scale is the same for all recordings and is shown by the bar on the right. D, representative examples of outside-out patches expressing xASIC1.1 wild type and with the indicated single and double mutations. Currents were evoked by changing pH from 7.6 to 7.0 for 10 s. The time scale bar is 1 s for all traces, whereas the current scale bar is 100 pA, except for M85L, which is 10 pA.
To calculate the values of the rise and decay faces of the currents, we examined outside-out patches perfused with a rapid exchange solution system. As the time constants are pH dependent, we examined all mutants at pH 7.0 (Fig. 3D). Upon activation, currents from xASIC1.1 exhibited a fast rise (τa, 25 ms) and decay (τd, 80 ms) as reported previously (5). The substitution N415C slowed the rise time constant (τa, 45 ms) but had a much larger effect on the decay (τd, 900 ms). For comparison, we also showed the effect of the substitution M85L (τa, 75 ms; τd, 500 ms). Currents of the double mutant xASIC1.1-M85L/N415C were slower (τa, 150 ms; τd, 1650 ms) than the single mutants by an additive factor. Similar results although of less magnitude were observed with the mutations N415S and N415G.
Replacement of Asn-415 Decreases Proton Affinity of Desensitization of ASIC1
The substitution N415C also shifts the apparent proton affinity of steady-state desensitization from pH50D 7.27 to 7.1 in rASIC1a and from 7.4 to 7.12 in xASIC1.1 (Fig. 4, A and C). When Cys-415 was introduced in the background of Leu-85 of xASIC1.1, the pH50D changed from 7.27 to 6.92. Because the apparent affinity for activation was changed slightly (Fig. 4, B and D), the steady-state desensitization and activation curves overlapped (Fig. 4E), generating a range of pH wherein currents from the double mutant xASIC1.1 increased stepwise upon consecutive increments in the external proton concentration (pH range 7.0 to 6.8) (Fig. 4F).
FIGURE 4.

The substitution N415C decreases the apparent proton affinity of ASIC1. A, dose-response relationships of rat ASIC1a wild type and mutant N415C to desensitization by external protons. The activating pH was 6.8. B, the dose response of rat ASIC1a to activation by protons. The preconditioning pH was 7.4 for all measurements. C, the dose response of desensitization by protons of Xenopus (Xen) ASIC1.1 wild type and the indicated mutants. The activating pH was 7.0. D, dose response of activation of xASIC1.1 by protons preconditioning by pH 7.6. E, overlap of activation and desensitization curves of the double mutant xASIC1.1-M85L/N415C. For all graphs, data points are the mean ± S.D. of at least six independent measurements. Lines are the fit of the data to Equation 1. F, currents evoked by sequential increases in the concentration of protons without returning the pH to 7.8 between stimuli. G, pH50D changes of multiple amino acid substitutions in the pair of residues 85 and 415 of xASIC1.1. pH50D values, mean ± S.D. are shown in parentheses below each mutant.
Substitutions of Asn-415 by other amino acids in xASIC1.1 such as Gly also displaced the pH50D toward a more acidic range. As illustrated by double mutant cycles (12) shown in Fig. 4G, changes in pH50D were additive when introduced in the Met-85 (wild type) or Leu-85 background. Values corresponding to pH50D are in parentheses below each single and double mutant. The coupling coefficient, Ω, defined as EC50(WT:WT) × EC50(mut:mut)/EC50(WT:mut) × EC50(mut:WT) (13), gave values close to unity, indicating that the mutated residues are independent of one another.
Single Channel Analysis of xASIC1.1-N415
To gain insight on the underlying mechanism of the substitution N415C, we examined patches activated by low concentrations of protons, pH 7.2 to 7.0, to have fewer than three open channels in the patch. The protocol consisted first in estimating the number of total channels in the patch by activation with pH 6.8. Most patches responded by generating ∼2-nA peak currents, which correspond approximately to 1000 channels (amplitude of unitary currents is 2.2 pA at −60 mV membrane potential and 120 mm outside Na+). Patches were returned to pH 7.8 for 4 s and reactivated by pH 7.0, 7.1, and 7.2. The pH that opened fewer than three channels was then used in up to 20 sweeps of a 20-s duration. A representative example is shown in Fig. 5. Channel activity was observed for many tens of seconds at pH 7.2. These records were used for analysis of the mean open time (τo) applying Equation 4. The estimated τo according to this method was 6.4 ± 0.5 ms, which is not significantly different from that of wild type xASIC1.1 (6.8 ± 0.3 ms) (5), indicating that the slow decay of the currents cannot be attributed to lengthening of the mean open time. At low proton concentrations such as pH 7.2, the probability of a channel opening is low; thus, only one to three channels of ∼1000 present in the patch are open at any time during the long stimulus >20 s. Eventually, activity ceases after all channels in the patch have opened and have entered the desensitized state. (The mutation N415C does not prevent desensitization from the open state.) By contrast, the activity of wild type xASIC1.1 is short and of small magnitude, because at pH 7.2, most of the channels in the patch are desensitized, and the ones that are not also have low probability of opening. For comparison, the bottom trace activated by pH 7.2 in Fig. 5 is from xASIC1.1 wild type. It shows a low level of channel activity and declines rapidly over time.
FIGURE 5.

Single channel activity of xASIC1.1-N415C. Representative example of an outside-out patch expressing xASIC1.1-N415. A, the patch was first activated by pH 6.8. The magnitude of the peak current is 2.5 nA. B, the pH was returned to 7.8 for a 4-s recovery from desensitization followed by activation by pH 7.0. C, upper two traces are the first 2 s of a continuous recording of 20-s duration. The activating pH was 7.2. In 20 sweeps of a 20-s duration, only one or two channels were open simultaneously. Bars in the right lower corner indicate the time and amplitude scales. The third trace is from xASIC1.1 wild type.
State-specific Reactivity of Cys-85 and Cys-415 to MTSEA
To examine exposure to solvent of Cys-85 and Cys-415 and whether it changes in the closed and desensitized conformations, we treated xASIC1.1 bearing single Cys substitutions with MTSEA added to the bath.
Because the proton affinity for steady-state desensitization differs in the two Cys mutants, MTSEA was applied to xASIC1.1-C85 (pH50D, 7.4) at pH 7.6 (closed channels) or 7.3 (desensitized channels) whereas xASIC1.1-C415 (pH50D, 7.1) received MTSEA at pH 7.4 and 7.0. The protocol consisted of a 5-s perfusion with MTSEA at the desired pH, a 10-s wash with solution of pH 7.6, followed by channel activation. Recovery from desensitization was complete with a 10-s application of pH 7.6 (see supplemental figure). Fig. 6, A and B, illustrate almost complete inhibition of xASIC1.1-C85 currents by MTSEA applied to closed and desensitized channels (modification rate, 100 m−1 s−1). Of notice, xASIC1.1-C85 currents exhibit faster kinetics than those of wild type channels (5). Time course of the cumulative effect is shown in Fig. 6C.
FIGURE 6.

State-dependent accessibility of extracellular MTSEA in xASIC1.1-M85C. A, representative example of whole-cell currents evoked by pH 6.9 (bar above current traces) before and after exposing closed channels (pH 7.6) to consecutive 5-s treatments with 2.5 mm MTSEA. After MTSEA exposure, cells were washed for 10 s with reagent-free solution pH 7.6. B, similar experiment to A, but the application of MTSEA was at pH 7.3 when channels are desensitized. 10 s at pH 7.6 completely recovers channels from desensitization. C, cumulative effect of MTSEA on peak currents. Each data point is the mean ± S.D. of at least five oocytes. The lines are the fit to a single exponential from which the time constant t was used to calculate the apparent modification rate (R = 100 m−1 s−1) according to Equation 3.
Currents from xASIC1.1-C415 were not inhibited by MTSEA but instead the reagent augmented the effects of the substitution N415C. Fig. 7 shows the effect of MTSEA in a cell before and after application of MTSEA at pH 7.4 for 30 s. Affinities of protons for activation (Fig. 7A) and desensitization (Fig. 7B) decreased shifting the pH50A and pH50D to a more acidic range; the new values were 6.8 and 7.0, respectively (Fig. 7C). The reaction with MTSEA also significantly slowed down the time course of the currents as illustrated by the traces in Fig. 6A before and after MTSEA. Effects of the reagent were comparable when applied at pH 7.4 or 7.0, and the time course of the reactions was also similar for the two conditions: modification rates 63 and 46 m−1 s−1 (Fig. 7D). In these experiments, the parameter for estimating modification rates was the change in peak current evoked by pH 7.0. Thus, properties of the residue in position 415 translate into a broad range of stabilization of the closed conformation from very little stabilization leading to ready desensitization and no currents as shown in Fig. 2, to significant stabilization and resistance proton-induced desensitization. Currents from wild type xASIC1.1 treated under identical conditions did not change as expected from the absence of endogenous free Cys. All 14 Cys in the extracellular domain are engaged in the formation of disulfide bridges and are very resistant to treatment with extracellular reducing agents.
FIGURE 7.

State-dependent accessibility of extracellular MTSEA in xASIC1.1-N415C. A, currents evoked by increasing concentrations of protons from a cell before and after a 30-s application of 2.5 mm MTSEA at pH 7.4 (closed channel). Between activations, the external pH was returned to 7.6 for 10 s to recover from desensitization. Traces before and after are shown in the same time scale. B, currents evoked by pH 6.9 after a 10-s perfusion with preconditioning solutions of the indicated pH before and after 2.5 MTSEA applied at pH 7.0 (desensitized) for 30 s. Traces correspond to the same cell. C, dose-response curves of protons generated before and after modification of xASIC1.1-N415C by MTSEA. D, time course of 2.5 mm MTSEA reaction measured as the change in peak current evoked by pH 7.0 in xASIC1.1-N415C (RpH7.4 = 63 and RpH7.0 = 46 m−1 s−1).
DISCUSSION
The findings of this work indicate that the residue in position 415 in the β11-β12 linker changes the apparent proton affinity and the time course of ASIC1 currents. These effects are akin to those produced by Leu-85 in the β1-β2 linker implying a common underlying mechanism, i.e. stabilization of a closed conformation (5). But as the effects of amino acid 415 were found to be additive to those of amino acid 85, the interpretation of interaction owing to proximity is not favored. Rather, each linker independently contributes to stabilization of a closed conformation. Independent contribution of the linkers conforms with the notion that structural changes initiated in the extracellular domain by proton binding are transmitted by the β1- and β12-strands to TM1 and TM2. Indeed, recent evidence supports participation of both transmembrane segments in opening and closing the pore (14–16).
The possibility of conformational changes of the linkers was explored by MTSEA modification of Cys introduced in positions 85 and 415. The two residues are exposed to solvent, but the rates of modification are much slower (apparent R, 100 m−1 s−1 and ∼50 m−1 s−1) than the rate predicted from free Cys in solution (R, ∼25,000 m−1 s−1) as calculated for MTSEA reacting with free mercaptoethanol (17). It indicates that the residues are partially buried in the protein; indeed, the side chain of residue 85 points to the interior of the protein, and the one of 415 is even more distant from the surface of the protein than residue 85 (Fig. 1). However, similar values of the apparent modification rate constants in the close and desensitized states do not prove rearrangements of the linkers but also do not rule it out because the closed and desensitized conformations may both be exposed to solvent. Such a result only indicates that state-specific conformations of the linkers cannot be detected by this approach.
On a more practical note, understanding the molecular bases of steady-state desensitization is important because it provides the means to develop drugs that promote or prevent channel opening. Example of the former type have not been yet developed, but, as our findings indicate, it will be possible to open ASIC1 with very low concentrations of protons (Fig. 4F). Example of the latter type is the tarantula toxin Psalmotoxin 1 (PcTx1) that is the only high affinity (EC50 ∼ 1 nm) and ASIC1-specific inhibitor (18). PcTx1 increases the apparent proton affinity leading to desensitization and therefore inhibition of channels at pH ≥ 7.4 (19). Mapping of ASIC1-toxin interactions (20) and molecular dynamics simulations (21) have identified α1 and α5 in the thumb domain of one subunit, and β3 from the adjacent subunit as potential contact sites.
Taken together, results from this work and a recently published paper (5) indicate that the amino acid composition of the linkers, specifically positions 85 and 415, markedly influence the stability of the closed conformation. Certain residues stabilize the close conformation (i.e. Leu-85 and Cys-415), whereas others favor the transition to the desensitized state. “Stiff' linkers prevent or slow transitions, whereas “floppy” linkers lead to rapid desensitization. From a mechanistic point of view, we speculate that the linkers work like joints that twist or move up and down the β1- and β12-strands, whereby they convey conformational changes started by the binding of protons in the extracellular domain to the pore in the transmembrane segments. When thinking of conformational changes, one usually seeks to associate movement to that part of the molecule. In this instance, the methods of cysteine accessibility and modification by MTSEA did not provide conclusive evidence but also did not rule out the possibility of a conformational change. The results also suggest that the small and accessible site defined by the β1-β2 and β11-β12 linkers is a potential target for modulation of channel activity by new drugs or small molecules.
Supplementary Material

The on-line version of this article (available at http://www.jbc.org) contains a supplemental figure.
- TM
- transmembrane domain
- MES
- 4-morpholineethanesulfonic acid
- MTSEA
- aminoethyl-methanethiosulfonate hydrobromide.
REFERENCES
- 1.Waldmann R., Champigny G., Bassilana F., Heurteaux C., Lazdunski M. (1997) Nature 386, 173–177 [DOI] [PubMed] [Google Scholar]
- 2.Krishtal O. A., Pidoplichko V. I. (1980) Neuroscience 5, 2325–2327 [DOI] [PubMed] [Google Scholar]
- 3.Wemmie J. A., Chen J., Askwith C. C., Hruska-Hageman A. M., Price M. P., Nolan B. C., Yoder P. G., Lamani E., Hoshi T., Freeman J. H., Jr., Welsh M. J. (2002) Neuron 34, 463–477 [DOI] [PubMed] [Google Scholar]
- 4.Xiong Z. G., Zhu X. M., Chu X. P., Minami M., Hey J., Wei W. L., MacDonald J. F., Wemmie J. A., Price M. P., Welsh M. J., Simon R. P. (2004) Cell 118, 687–698 [DOI] [PubMed] [Google Scholar]
- 5.Li T., Yang Y., Canessa C. M. (2010) J. Biol. Chem. 285, 22706–22712 [DOI] [PMC free article] [PubMed] [Google Scholar]
- 6.Jasti J., Furukawa H., Gonzales E. B., Gouaux E. (2007) Nature 449, 316–323 [DOI] [PubMed] [Google Scholar]
- 7.Gonzales E. B., Kawate T., Gouaux E. (2009) Nature 460, 599–604 [DOI] [PMC free article] [PubMed] [Google Scholar]
- 8.Fyfe G. K., Canessa C. M. (1998) J. Gen. Physiol. 112, 423–432 [DOI] [PMC free article] [PubMed] [Google Scholar]
- 9.Alvarez de la Rosa D., Zhang P., Shao D., White F., Canessa C. M. (2002) Proc. Natl. Acad. Sci. U.S.A. 99, 2326–2331 [DOI] [PMC free article] [PubMed] [Google Scholar]
- 10.Yang Y., Yan Y., Sigworth F. J. (2004) J. Gen. Physiol. 124, 163–171 [DOI] [PMC free article] [PubMed] [Google Scholar]
- 11.Zhang P., Sigworth F. J., Canessa C. M. (2006) J. Gen. Physiol. 127, 109–117 [DOI] [PMC free article] [PubMed] [Google Scholar]
- 12.Carter P. J., Winter G., Wilkinson A. J., Fersht A. R. (1984) Cell 38, 835–840 [DOI] [PubMed] [Google Scholar]
- 13.Hidalgo P., MacKinnon R. (1995) Science 268, 307–310 [DOI] [PubMed] [Google Scholar]
- 14.Salinas M., Lazdunski M., Lingueglia E. (2009) J. Biol. Chem. 284, 31851–33189 [DOI] [PMC free article] [PubMed] [Google Scholar]
- 15.Passero C. J., Okumura S., Carattino M. D. (2009) J. Biol. Chem. 284, 36473–36481 [DOI] [PMC free article] [PubMed] [Google Scholar]
- 16.Li T., Yang Y., Canessa C. M. (2010) Am. J. Physiol. Cell Physiol. 299, C66–73 [DOI] [PMC free article] [PubMed] [Google Scholar]
- 17.Stauffer D. A., Karlin A. (1994) Biochemistry 33, 6840–6849 [DOI] [PubMed] [Google Scholar]
- 18.Escoubas P., De Weille J. R., Lecoq A., Diochot S., Waldmann R., Champigny G., Moinier D., Ménez A., Lazdunski M. (2000) J. Biol. Chem. 275, 25116–25121 [DOI] [PubMed] [Google Scholar]
- 19.Chen X., Kalbacher H., Gründer S. (2005) J. Gen. Physiol. 126, 71–79 [DOI] [PMC free article] [PubMed] [Google Scholar]
- 20.Salinas M., Rash L. D., Baron A., Lambeau G., Escoubas P., Lazdunski M. (2006) J. Physiol. 570, 339–354 [DOI] [PMC free article] [PubMed] [Google Scholar]
- 21.Pietra F. (2009) J. Chem. Inf. Model. 49, 972–977 [DOI] [PubMed] [Google Scholar]
Associated Data
This section collects any data citations, data availability statements, or supplementary materials included in this article.