

Abstract
Tubulin is able to switch between a straight microtubule-like structure and a curved structure in complex with the stathmin-like domain of the RB3 protein (T2RB3). GTP hydrolysis following microtubule assembly induces protofilament curvature and disassembly. The conformation of the labile tubulin heterodimers is unknown. One important question is whether free GDP-tubulin dimers are straightened by GTP binding or if GTP-tubulin is also curved and switches into a straight conformation upon assembly. We have obtained insight into the bending flexibility of tubulin by analyzing the interplay of tubulin-stathmin association with the binding of several small molecule inhibitors to the colchicine domain at the tubulin intradimer interface, combining structural and biochemical approaches. The crystal structures of T2RB3 complexes with the chiral R and S isomers of ethyl-5-amino-2-methyl-1,2-dihydro-3-phenylpyrido[3,4-b]pyrazin-7-yl-carbamate, show that their binding site overlaps with colchicine ring A and that both complexes have the same curvature as unliganded T2RB3. The binding of these ligands is incompatible with a straight tubulin structure in microtubules. Analytical ultracentrifugation and binding measurements show that tubulin-stathmin associations (T2RB3, T2Stath) and binding of ligands (R, S, TN-16, or the colchicine analogue MTC) are thermodynamically independent from one another, irrespective of tubulin being bound to GTP or GDP. The fact that the interfacial ligands bind equally well to tubulin dimers or stathmin complexes supports a bent conformation of the free tubulin dimers. It is tempting to speculate that stathmin evolved to recognize curved structures in unassembled and disassembling tubulin, thus regulating microtubule assembly.
Keywords: Anticancer Drug, Protein Assembly, Protein Drug Interactions, Protein-Protein Interactions, Tubulin, Bending Flexibility, Microtubule Assembly Switch, Stathmin
Introduction
Microtubules are essential for eukaryotic chromosome segregation, cellular architecture and intracellular trafficking, among other processes. Understanding microtubule dynamics, regulation, and organization requires knowledge of the nucleotide-regulated assembly switch of tubulin. Microtubules are hollow cylinders made of protofilaments of αβ-tubulin dimers in head to tail association, forming a pseudohelical lattice (1). The functional assembly-disassembly cycle of a αβ-tubulin molecule includes activation by GTP binding at the β-subunit, polymerization into microtubules, GTP hydrolysis at the β-α interdimer interface and depolymerization of GDP-tubulin, followed by replacement by GTP. Vectorial polymerization and GTP hydrolysis combine with tubulin structural plasticity in microtubule dynamics (2). Depolymerizing microtubule ends show characteristic curled protofilaments, whereas relatively straight sheets form at growing ends (3, 4). GDP-tubulin does not assemble into microtubules, but forms double rings (5), which also form upon microtubule depolymerization (6) and correspond to curved microtubule protofilaments (7, 8). The tendency of GDP-tubulin to curve is thought to strain the microtubule lattice, causing disassembly when the terminal cap of GTP-bound tubulin is lost. Interestingly, remnants of the GTP-tubulin conformation inside microtubules have reportedly been detected by a recombinant antibody (9). Curling protofilaments and depolymerizing microtubule ends generate pulling force. Microtubule attachment to kinetochores couples depolymerization to chromosome segregation in mitotic spindles (10).
Stathmin (11) is a cellular microtubule inhibitor (12), which forms a tight complex with two αβ-tubulin dimers (13), T2Stath,5 binding along their sides and capping the α-end (14). T2Stath has been shown to be curved by electron microscopy, and it does not polymerize into microtubules (15). RB3 is a stathmin family protein which shares with other members the stathmin-like domain (SLD). Stathmin is an intrinsically disordered protein, and its activity is down-regulated by multiple phosphorylation. Proteins of the stathmin family are pivotal microtubule regulators implicated in signal transduction and disease (for reviews, see Refs. 11, 14).
Only two atomic structures of αβ-tubulin are currently known: One is GDP-tubulin in straight antiparallel protofilaments of two-dimensional zinc sheets stabilized by taxol (16, 17), that has been employed to construct pseudo-atomic models of microtubules, which have parallel protofilaments, from their electron microscopy maps (18). The other is the curved structure of two head to tail GDP-tubulin dimers in complex with the stathmin-like domain of RB3 (RB3-SLD) (19–21), named here T2RB3. The structure of tubulin in microtubules is related to the straight zinc-sheet structure, since both are made of similar protofilaments, although the different lateral contacts cause modifications. It may be asked whether the unknown structure of labile free αβ-tubulin dimers relates to the straight structure or if it is bent similarly to the T2RB3 complex, and how GTP-tubulin differs from GDP-tubulin.
It was first thought that GTP would allosterically induce a straight conformation of tubulin subunits capable of microtubule assembly and that GDP would induce a curved conformation favoring disassembly. A 12 Å resolution map of tubulin-GDP protofilament spirals has indicated different intra- and inter-dimer curvatures, and the structure of GMPCPP-tubulin tubes assembled at low temperatures has been interpreted in support of a sequential model in which a conformational change after GTP binding straightens the dimers enough for lateral contacts to form sheets, which later close into microtubules (22). However, this type of allosteric mechanism is challenged by the findings of curved T2RB3-like structures of GTP-bound γ-tubulin (23) and bacterial tubulin (24), by the lack of nucleotide-induced structural changes in the prokaryotic tubulin relative FtsZ (25) and by the biochemical properties of αβ-tubulin indicating that its ground state in the absence of magnesium is the curved GDP conformation (26). This evidence led to the proposal that, contrary to what was previously thought, the free GTP-tubulin dimer is curved similarly to tubulin rings and is driven into the straight conformation by the microtubule lattice contacts, and that the GTP γ-phosphate only lowers the unfavorable free energy difference between the curved and the straight form (27). This could take place by allowing the flexilibity required to adopt the straight conformation driven by the lateral interactions or by enhancing the longitudinal interaction between dimers within the microtubule lattice. The similar GDP- and GTP-bound γ-tubulin structures, the identical affinity of allocolchicine for GTP- and GDP-tubulin (28), and kinetic simulations have been proposed to favor the lattice model (29). To summarize, in the allosteric model GTP binding would induce a straighter conformation prestructured in solution for lateral interactions (30) whereas in the lattice model (27) αβ-tubulin adopts a microtubule incompatible, curved conformation independent of the nucleotide state, so that the conformational switch is a consequence, not a cause, of lattice assembly (29). More recently, molecular dynamics simulations and coarse-grained analysis have indicated curved conformations of GDP- and GTP-bound tubulin dimers, supporting the lattice model but with a tendency toward smaller bending in GTP-tubulin than in GDP-tubulin (31). Tubulin flexibility has also been studied with hydrogen/deuterium exchange mass spectrometry and urea denaturation, and a blended model proposed combining allosteric effects in the free dimer with an assembly process dominated by lattice-induced effects (32).
Small molecule microtubule inhibitors and antitumor drugs have been historically employed to investigate tubulin and microtubule assembly (33, 34). The colchicine binding site was biochemically mapped to β-tubulin near the contact interface with α-tubulin in the αβ-tubulin dimer (28, 35, 36). The 3.5 Å resolution structure of the curved T2RB3-colchicine complex showed the colchicine binding site at the intradimer interface, and how colchicine binding is incompatible with the straight conformation of tubulin in microtubules (20). MTC is similar to colchicine but lacks the middle ring (37) and unlike colchicine it binds fast and reversibly to tubulin (38); MTC has been extensively used as a reference ligand of the colchicine binding site (39) and as a reversible inhibitor of cellular microtubules (40, 41).
The two chiral isomers NSC 613862-(CI980) (S) and NSC 613863 (R) (42) have antitumor activity, bind to tubulin with a high affinity overlapping the colchicine site and powerfully inhibit microtubule assembly in vitro (43) and in cells (44). Interestingly, the R and S compounds bind to GTP-tubulin with higher affinity than to GDP-tubulin dimers, allosterically distinguishing the bound nucleotide (45). However, allocolchicine (28) and MTC (45) have similar affinities irrespective of the GTP- or GDP-bound nucleotide. The synthetic microtubule inhibitor TN-16 also competes with colchicine for binding to tubulin (46). The recent determination of the structure of T2RB3 in complex with TN-16 has shown that this ligand overlaps the trimethoxyphenyl ring A of colchicine and is more deeply buried in the β-tubulin subunit, thus extending the colchicine binding domain (21).
We reasoned that studying the interactions of ligands of the colchicine domain with tubulin-stathmin complexes in comparison with tubulin dimers should give insight into the bending flexibility of the αβ-tubulin dimer, indicating whether its conformation is similar to straight tubulin in microtubules or to curved tubulin in complex with stathmin-like proteins, and to which degree it depends on bound GTP or GDP. In this work, we have determined the structures of T2RB3 with bound R and S, and have employed the R, S, MTC, and TN-16 ligands as probes of bending at the αβ-tubulin intradimer interface in tubulin dimers and in complexes with stathmin and RB3-SLD, with GTP or GDP. We show that R and S overlap with TN-16 in equally curved T2RB3 complexes, and that the four probes bind similarly to tubulin dimers and to stathmin complexes. This indicates that unassembled dimeric tubulin is predominantly curved and switches into the straight conformation upon microtubule assembly.
EXPERIMENTAL PROCEDURES
Ligands
MTC was a gift from Dr. T. J. Fitzgerald (37). Its concentration was determined spectrophotometrically with an extinction coefficient of 17,600 m−1 cm−1 at 343 nm (38). NSC 613862 (CI980) (S) and NSC 613863 (R) were a gift from Dr. G. A. Rener (42). Their concentrations were determined spectrophotometrically at 374 nm with extinction coefficients of 15100 and 15400 m−1·cm−1 for the S and R compounds, respectively (42). TN-16 was from CalBiochem. Ligand stock solutions in dimethyl sulfoxide were stored dry at −20 °C.
Protein Purification
For crystallization experiments tubulin was purified from ovine brain by two cycles of polymerization in a high molarity buffer followed by depolymerization (47, 48). For biochemical experiments, tubulin was purified in large scale from lamb brain by ammonium sulfate fractionation, ion exchange chromatography and precipitation with magnesium (33, 49). Purified tubulin was stored in liquid nitrogen and prepared for use as described (45). GTP- and GDP-tubulin were prepared as described (45). Tubulin concentration was determined spectrophotometrically at 275 nm in 6 m guanidine hydrochloride (ϵ275 nm = 109,000 m−1·cm−1) or in 0.5% sodium dodecyl sulfate in neutral aqueous buffer (ϵ275 nm = 107,000 m−1·cm−1).
Recombinant human stathmin was purified, stored as previously described (50), weighed, and dissolved before use. Stathmin concentration was routinely measured using a Lowry method (DC protein assay, Bio-Rad) with BSA standard, corrected by a color yield ratio stathmin/BSA of 0.84.
RB3-SLD was expressed from a pET vector introduced into BL21(DE3) and purified as described (48) with some modifications. A 10-ml overnight preculture of bacteria transformed with the expression vector pET-3d containing the RB3-SLD cDNA was used to inoculate 1L of LB-medium containing ampicillin at 37 °C. RB3-SLD expression was induced by the addition of 0.4 mm IPTG when the A600 nm reached the 0.4 to 0.6 range. After 3 h, the culture was cooled and centrifuged (15 min, 5,000 × g). Bacterial pellets were resuspended in extraction buffer (10 ml per 1 g of bacteria): 20 mm Tris-HCl pH 8.0, 1 mm EGTA, 2 mm TCEP supplemented with a protease inhibitor mixture, and sonicated on ice. The lysate was cleared by centrifugation (15 min, 10,000 × g at 4 °C), the supernatant was heated at 80 °C for 10 min and centrifuged for 15 min at 10,000 × g. Optionally, 30 mm spermine was added to the supernatant, pH readjusted to 8.0 and the solution incubated 1 h at 4 °C. The mixture was ultracentrifuged at 4 °C (1 h, 100,000 × g). The resulting supernatant was loaded onto a Q Sepharose FF or a 5 ml HiTrap Q HP anion exchange column, which was then washed with the anion exchange chromatography-loading buffer: 20 mm Tris-HCl pH 8.2, 1 mm EGTA, 2 mm TCEP. After elution with a linear 0–0.6 m NaCl gradient, the RB3-SLD-containing fractions, identified by SDS-PAGE, were pooled, concentrated and loaded on a Superdex 75 26/60 or 16/60 gel filtration column, which was eluted with 10 mm HEPES-NaOH pH 7.2, 150 mm NaCl, 2 mm TCEP. RB3-SLD-containing fractions were pooled, concentrated to ∼10 mg/ml, and stored at −70 °C until use. The SLD concentration was determined either by amino acid analysis or by titration of a known tubulin solution with the SLD on a gel filtration column (Superose 12 10/300). Both methods gave similar results. For the biochemical experiments the gel filtration buffer was 10 mm sodium phosphate, 100 mm NaCl, 1 mm EGTA, pH 7.0, 1 mm DTT was used instead of TCEP, and RB3-SLD was spectrophotometrically measured in concentrated solutions employing an extinction coefficient ϵ280 nm = 1490 m−1 cm−1 (1 Tyr, 0 Trp residues).
Crystallization and X-ray Structure Determination of the R and S Isomer-Stathmin-Tubulin Complexes
The R and S isomers were added to recycled tubulin (typically in the 50–80 μm concentration range) complexed with RB3-SLD (T2RB3) using a 1.3:2 RB3-SLD:tubulin ratio. R and S were added at a 250 μm final concentration from 10 mm stock solutions in DMSO. Complexes were concentrated to ∼20 mg of tubulin per ml by ultrafiltration and were either used immediately or stored at −70 °C. Crystals were obtained at 4 °C by streak seeding a 1:1 mixture of the complex and a reservoir solution consisting of 50 mm PIPES-KOH pH 7.5, 5% PEG 400, 10% ethylene glycol to which 4–5% PEG 20K was added (48) (21). Crystals appeared within 48 h and were harvested within a week in the well solution with ligand at 250 μm concentration, they were flash-frozen in the harvesting buffer supplemented with ethylene glycol at 25% final concentration. X-ray diffraction datasets were collected at 100K using a MarCCD detector at beam-line ID14–4 of the European Synchrotron Radiation Facility, Grenoble. Tubulin:RB3-SLD-R and S complexes crystals belong to space group P65. Diffraction data were processed using the HKL package (51). The structure of T2RB3-colchicine (20) in which colchicine was removed from the model was used as a starting point for rigid-body refinement. The structures were further refined with REFMAC using the TLS option (52). Initial models and topology parameters for the ligands were generated using program PRODRG (53). Rounds of refinement were alternated with manual refitting using the cross-validated, sigma-A weighted, phase combined 2Fo-Fc and Fo-Fc maps (54). Progress in the model refinement was evaluated by decrease in the free R-factor. Statistics for data processing and refinement are summarized in supplemental Table S1. We used the O program (55) for structure visualization and manual rebuilding. Superimpositions of atomic models were done either with SUPERPK (56) or with O. Search for interactions between the ligand and tubulin was achieved with CONTACT (54). Figures were generated with PYMOL (57), BOBSCRIPT (58) and RASTER3D (59).
Sedimentation Velocity
The experiments were done at 40,000 rpm and 20 °C in a Beckman Optima XL-I analytical ultracentrifuge equipped with interference and absorbance optics, using an eight holes An50Ti rotor and 1.2 cm Epon double-sector centerpieces. Apparent sedimentation coefficients were determined by the sedimentation coefficient distribution c(s) generated by the SEDFIT program (60) All the analytical ultracentrifugation experiments were done in 20 mm sodium phosphate, 10 μm GTP, pH 6.5. When RB3 was present, 1 mm DTT was added.
Ligand Binding Measurements by Analytical Ultracentrifugation
Tubulin or tubulin-stathmin complex with various concentrations of S isomer (from 0 to 25 μm) were loaded into the analytical ultracentrifuge. Sedimentation velocity experiments were performed and radial absorbance data were acquired at 375 nm to observe the ligand distribution. The experiment was done with tubulin or 100% of tubulin-stathmin complex (20 μm tubulin and 20 μm stathmin) at 20 °C.
The sedimentation coefficient distribution C(S) generated by the SEDFIT program (61) allowed to quantify the bound ligand concentration by measuring the area under the sedimenting peak and the free ligand concentration by determination of the baseline (ligand that does not sediment). For various total ligand concentrations, bound ligand divided by total tubulin concentration (B) was then plotted versus free ligand [L] concentrations, and the binding was analyzed using the following equations. The binding of S isomer to tubulin required a two non-equivalent independent binding sites model in Equation 1,
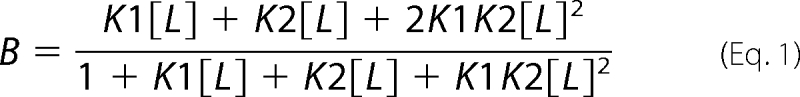 |
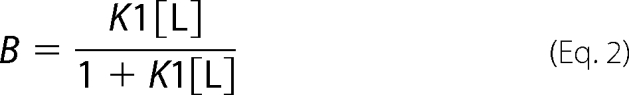
where K1, K2 are the affinity constants of the S isomer binding. The binding of this isomer to the tubulin-stathmin complex could be fitted by one binding site model,
 |
Binding Measurements by Fluorometric Titration
Quenching of the tryptophan protein fluorescence due to the interaction of the R and S compounds with tubulin was employed to measure their binding parameters. Tubulin and tubulin-stathmin complex (2–5 μm) were titrated with various concentrations of R and S isomer (0.5–12 μm) in 20 mm sodium phosphate, 0.1 mm GTP, pH 7. The fluorescence measurements were performed with a Horiba-Jobin-Yvon Fluoromax-3 spectrofluorimeter with slit widths of 2/2 nm. Corrected fluorescence spectra were obtained by using 1 (excitation direction) × 0.2 cm cells (Hellma) thermostatted at 25 °C by a circulating water bath. Emission spectra (λexc = 295 nm) were collected. The length of the light path was chosen to decrease the light absorption by the sample at the emission and excitation direction to minimize the inner filter effect (R and S isomers have an absorption maximum at 374 nm). After correction for this effect, the fluorescence intensity values at 330 nm were plotted versus R and S isomer concentrations, and the binding parameters fitted as described elsewhere (62). This method was also employed to measure the TN-16 binding to GTP-and GDP-tubulin. Tubulin (2–5 μm) was titrated with various concentrations of TN-16 (0.5–30 μm) in 20 mm sodium phosphate, 10 μm GTP or 1 mm GDP, 5% DMSO, pH 7. 0.2 (excitation direction) × 1 cm cells (emission direction) were chosen to minimize the inner filter effect due to the absorbance of the TN-16, which was corrected as described (62). All experiments were done in triplicate with three independent tubulin preparations at 25 °C.
TN-16 Binding to GTP-tubulin by Differential Absorption
Light absorption spectra were obtained with a Perkin Elmer Lambda 800 UV/Vis spectrophotometer employing 1 cm cells (Hellma) thermostatted at 25 °C. For each TN-16 concentration, the tubulin and TN-16 alone spectra in 20 mm sodium phosphate, 10 μm GTP, 5% DMSO, pH 7 were subtracted from the tubulin-TN-16 mixture spectra, and the differential absorption at 330 nm was plotted versus TN-16 concentration and analyzed as in the fluorometric titrations.
RESULTS
Structures of Tubulin-RB3-SLD Complexes with R and S Isomers: Mapping the Binding Site
The structures of the T2RB3 complexes with the R and S compounds (Fig. 1A) were superimposable to the structures of the T2RB3-colchicine complex (20) and to unliganded T2RB3 (except for a loop of β-tubulin that lies in the colchicine site in the absence of colchicine domain ligands (21)). This shows that binding of these ligands does not modify the conformation of tubulin in the T2RB3 complex (21), which accommodates them without subunit or domain displacements in the crystal. The binding sites for R and S isomers were identified in a 4 Å Fobs-Fcalc difference electron density map, calculated from a model in which the ligand was missing, by positive peaks significantly higher than non attributed ones. In the case of the R isomer, these heights were 10.9 σ and 7.6 σ in the two β subunits of T2RB3, respectively, the highest non-attributed peak height being 5.2 σ; similar results were obtained with the S-isomer. The globular shape of the electron density (Fig. 1B) leaves some ambiguity in the orientation of the ligands. The orientation we propose is based on the better quality of the corresponding difference map calculated after refinement and takes into account more favorable interactions with tubulin. In the two most likely orientations of the ligands, the locations of the carbamate and phenyl groups of R and S, which are respectively polar and hydrophobic, are exchanged. In the orientation we propose, the carbamate nitrogen and carbonyl oxygen interact with polar residues of tubulin (Fig. 1C), whereas this group would be in an essentially hydrophobic environment if its location was exchanged with that of the phenyl ring. Consistent with the results of competition experiments (43), the ligands overlap with colchicine; this overlap is limited to the phenyl of R (or S) and to the trimethoxyphenyl ring of colchicine. By contrast, the electron densities of tubulin-bound R (or S) and TN-16 (21) largely colocalize (Fig. 1B) within the colchicine binding domain. As a consequence, the R and S isomers are more deeply buried in β-tubulin than colchicine and, unlike it, they do not contact the α subunit. The tubulin subunit structure comprises three domains, an N-terminal nucleotide-binding domain, an intermediate domain and a C-terminal helical hairpin. The colchicine-binding site is mostly embedded in the intermediate domain. The R and S isomers make fewer contacts than colchicine with the intermediate domain while establishing new interactions with residues belonging to β strands S5 and S6 in the nucleotide-binding domain (Fig. 1C). When one superimposes the N-terminal domain of β-tubulin in its straight conformation (PDB ID: 1JFF) on that of tubulin in T2RB3-R, and compares the intermediate domains, the following changes are observed. In the straight structure, the intermediate domain β-sheet (strands S8 to S10) comes closer to the H8 helix. Together with the H7 translation, this leads to a shrinking of the colchicine domain (21). When a ligand is bound to it, the straight conformation cannot be accommodated because of steric clashes the ligand makes with surrounding secondary structure elements (S8, S9, H7, and H8).
FIGURE 1.

The binding site for R and S in tubulin. A, general view of the T2RB3 complex with compound R. The α-subunits are in magenta, β-subunits in green, RB3-SLD in blue, and the R compound in cyan. B, the R isomer (cyan) is presented in its Fobs-Fcalc omit map contoured at 3.5 sigmas and overlapped with colchicine (yellow) and TN-16 (red) (PDB ID code 3N2G). At the 4 Å resolution of the diffraction data, the electron densities of the R and S isomers are very similar; the omit map corresponding to the S isomer is presented in supplemental Fig. S1. Residues presented are in the region from residue 127 to residue 382 of the β-subunit; secondary structure elements interacting with the R isomer are in darker green. These are strands S5-S6 in the nucleotide-binding domain, helix H7, loop T7 and in the intermediate domain strands S7-S10 and helix H8. For the limits of secondary structure elements see (69). C, R isomer binding site. The R isomer in its most likely orientation is in cyan in the β-subunit (green). Side chains of residues most likely to make polar interactions with the carbamate moiety of R are also presented.
The Tubulin Dimer Curvature Probed with Colchicine Domain Ligands
Colchicine (20) or the R and S ligands (see above) bind to β-tubulin at the α-β association interface in T2RB3 crystals, where αβ-tubulin is curved, but these ligands are known not to bind to the microtubule lattice, in which αβ-tubulin is straight (18). To probe the unknown bending conformation of αβ-tubulin dimers in solution by reference to the curved conformation of tubulin-RB3-SLD and of tubulin-stathmin complexes (21, 15), we have employed the strategy schematized by the simplified thermodynamic box in Fig. 2, which contains several linked equilibria (63). Equilibria 1 and 3 are the associations of RB3-SLD or stathmin (Stath) to dimers and liganded dimers respectively, leading to identically curved complexes (results above). An energetically significant modification of the dimer curvature by the binding of the ligand (see chemical structures in Fig. 2) would result in different stathmin association with liganded and unliganded tubulin (63) (different observed association constants K3obs and K1obs, respectively). Reactions 4 and 2 are the binding of the interfacial probe ligand to tubulin dimers and tubulin-stathmin complexes, respectively. Note that straight tubulin has no room to bind the ligand (results above). Different curvatures of tubulin in dimers and in stathmin complexes would be expected to give rise to different apparent affinities of the ligand (K4obs and K2obs). In one extreme case, if the tubulin dimer was straight as in microtubules, the binding of the ligand or stathmin would bend tubulin, resulting in K4obs < K2obs and K1obs < K3obs; in the other extreme case, if the dimer conformation was the same as in the stathmin complex, the bindings of stathmin and the ligand would be independent from each other, K4obs = K2obs and K1obs = K3obs.
FIGURE 2.

Scheme of tubulin dimer association with stathmin or RB3-SLD (S) or into microtubules and binding of colchicine domain ligands (L) to β-tubulin at the intradimer interface. The chemical structures of the four ligands employed as probes of tubulin bending are shown.
First of all, we examined the effects of ligands R and S on the tubulin-RB3 complex formation and the relative amount of ligand bound to tubulin dimers and tubulin-RB3 complexes, by sedimentation velocity experiments. Interference optics to detect protein and absorbance optics to detect the small ligands were simultaneously employed. Experiments were initially performed with GTP-tubulin because if it had a different curvature in dimers than in the stathmin complex we should detect preferential binding of the R and S isomers to one of the two tubulin forms. As shown in Fig. 3A, the αβ-tubulin dimer sedimented at an apparent sedimentation coefficient of 5.6 S and the T2RB3 complex at ∼8 S. For the RB3-SLD to tubulin ratio employed (3.8 μm RB3-SLD, 10 μm tubulin), we found 50% of each peak (which corresponds to 55% tubulin in dimers and 45% in T2RB3 complex, taking into account the 18% mass contribution of the RB3-SLD), compatible with previous results with stathmin (13). This distribution was the same irrespectively of the presence of the S-isomer (37 μm). Scanning the samples at the ligand absorption maximum allowed measurement of the bound ligand sedimenting with tubulin and with the T2RB3 complex, as shown by Fig. 3B. The area under the sedimenting peaks analyzed by the SEDFIT program (60) represents the amount of bound ligand. The free ligand concentration was calculated from the SEDFIT baseline, because the unbound ligand does not significantly sediment during the experiment. 50% of the sedimenting S isomer was bound to tubulin and 50% was bound to T2RB3. This experiment showed that this ligand has a similar affinity for GTP-tubulin dimers and for T2RB3 complexes, consistent with its lack of effect on T2RB3 complex formation equilibrium, providing a first indication that both processes are independent. In an experiment with GDP-tubulin (7 μm) and stathmin (3.12 μm) we observed two peaks corresponding to tubulin and to the stathmin-tubulin complex (7.6 S), respectively, in a 40–60% proportion (45% tubulin in dimers and 55% in T2Stath complexes) (Fig. 3C). We similarly found 44% of the R isomer bound to tubulin and 56% to the T2Stath complex (Fig. 3D), also indicating independent binding of the ligand and stathmin to GDP-tubulin.
FIGURE 3.

Sedimentation coefficient distribution c(s) of GTP-tubulin (10 μm) and RB3 (3.82 μm) in a solution containing the S isomer (37 μm) detected by interference optics (A, raw data and fitting in supplemental Fig. S2) or by absorbance of the S isomer at 375 nm (B, supplemental Fig. S3). Sedimentation velocity of GDP-tubulin (7 μm) and stathmin (3.12 μm) with R isomer (10 μm) detected by interference optics (C, supplemental Fig. S4) or by absorbance of the R isomer at 375 nm (D, supplemental Fig. S5). Data were analyzed by the Sedfit program.
The Formation of Tubulin Complexes with Stathmin and RB3-SLD Is Independent of the Binding of Ligands at the Intradimer Interface
Based on the the above indications, we titrated tubulin with varying concentrations of RB3-SLD or stathmin, with and without an excess of ligand, and determined the percent of tubulin in the 8 S complex by sedimentation velocity. Excess S-isomer insignificantly modified the GTP-tubulin complex formation with RB3-SLD (Fig. 4A) or stathmin (supplemental Fig. S2). Similar results were obtained in an excess R isomer (37 μm) (supplemental Fig. S2), with TN-16 (33 μm) and with the bicyclic colchicine analogue MTC (23 μm), both with RB3-SLD and stathmin in each case (not shown). MTC is expected to bind like colchicine rings A and C, lacking the middle ring. The titration profiles of GDP-tubulin with stathmin were also similar with and without R isomer (Fig. 4B), S isomer, TN-16 or MTC (not shown). In summary, none of the four colchicine domain ligands significantly modified the formation of the RB3-SLD-tubulin and stathmin-tubulin complexes, irrespective of tubulin being bound to GTP or GDP.
FIGURE 4.

A, GTP-tubulin titration (10 μm) by RB3 analyzed by sedimentation velocity without (●) and with (○) S isomer (37 μm) at 20 °C. B, GDP-tubulin titration (9 μm) with stathmin without (●) and with (○) R isomer (10 μm) at 20 °C.
The Affinity of Ligand Binding at the Intradimer Interface Is Independent of Tubulin Complex Formation with Stathmin
If the binding of stathmin or RB3-SLD to tubulin is essentially independent of the binding of ligands to the colchicine domain (see above), the reciprocal should hold, the binding of these ligands to tubulin should not be modified in the stathmin complexes (Fig. 2) (63). We went further and measured the affinity of the ligands for tubulin and tubulin in stathmin excess (T2Stath). We first employed sedimentation velocity to measure directly the equilibrium binding affinity of the S isomer to tubulin and the T2Stath complexes with GTP. The proteins were titrated with increasing concentrations of ligand and the bound and free ligand measured by scanning the ultracentrifuge cells (as in Fig. 3, B and D). The concentration of bound ligand divided by total protein concentration was plotted versus free ligand concentration and analyzed (“Experimental Procedures”). The binding of the S isomer to tubulin (Fig. 5A), could be fitted by a high affinity site with binding equilibrium constant Ka (1.3 ± 0.3) × 106 m−1, plus a lower affinity binding with Ka (7.0 ± 0.2) × 103 m−1. The binding to the T2Stath complex could be fitted by the same high affinity site, with Ka (1.9 ± 0.9) 106 m−1, without the lower affinity binding site (Fig. 5B). The low affinity binding may be attributed to nonspecific binding to tubulin, which is prevented by complex formation.
FIGURE 5.

Binding of the S compound to GTP-tubulin (A) and to the GTP-T2Stath complex (B) measured by analytical ultracentrifugation. The experiments were done at 20 °C and analyzed as described under “Experimental Procedures.”
The binding of R and S isomers induced a decrease of the intrinsic tryptophan tubulin fluorescence (43, 45). We used this property to compare the binding affinity of both isomers to the αβ-tubulin dimers and to the T2Stath complexes. The apparent binding constants are summarized in Table 1 for comparison. The S isomer bound to tubulin with a slightly higher affinity than the R isomer, as previously shown (43, 45). The R and S isomer affinities were not modified in the stathmin complexes. The affinity ratios (tubulin/T2Stath) obtained for both S and R isomers were unitary within experimental error, confirming the analytical ultracentrifugation result. In summary, the R and S isomers bind to the GTP-tubulin dimer and to the T2Stath complex essentially with the same affinity.
TABLE 1.
Comparison of R and S isomer and TN16 binding affinities to GTP- and GDP-liganded αβ-tubulin dimers and to tubulin-stathmin complexes
| Ligand | Receptor | Kb × 106 (m−1) | Ratio tubulin/T2Stath | Ratio GTP/GDP |
|---|---|---|---|---|
| R | GTP-tubulin | 1.7 ± 0.3a | ||
| 1.1 ± 0.6b | ||||
| GTP-T2Stath | 1.4 ± 0.7a | 1.2 ± 0.2d | ||
| GDP-tubulin | 0.3 ± 0.1a | 5.6 ± 1.3d | ||
| 0.29 ± 0.05b | 4.0 ± 2.7b | |||
| S | GTP-tubulin | 2.4 ± 1.3a | ||
| 2.5 ± 0.7b | ||||
| 1.3 ± 0.3c | ||||
| GTP-T2Stath | 3.1 ± 1.2a | 1.0 ± 0.3d | ||
| 1.9 ± 0.9c | 0.7c | |||
| GDP-tubulin | 1.5 ± 0.6b | 1.7 ± 1.2b | ||
| TN-16 | GTP-tubulin | 0.17 ± 0.05a | ||
| GDP-tubulin | 0.19 ± 0.03a | 0.9 ± 0.4 | ||
| MTC | GTP-tubulin | 0.32 ± 0.06b | ||
| GDP-tubulin | 0.31 ± 0.07b | 1.0 ± 0.4 |
a Average of three independent Kb values determined by tubulin fluorescence quenching in this work.
b Value previously determined by fluorescence quenching (45).
c Determined from sedimentation velocity data in this work.
d Average of three independently determined ratios.
Finally, because the R and S isomers have higher affinity for GTP- than for GDP-tubulin (Table 1) and since TN-16 shares the same binding site in the structures of the corresponding T2RB3 complexes (Fig. 1B), we explored the possibility that TN-16 could also distinguish the two nucleotide states of tubulin. The binding of TN-16 to GTP-tubulin measured by differential absorption spectroscopy gave one binding site with an association binding constant of (5 ± 2) 105 m−1 (Fig. 6A). However, the affinity constants of TN-16 for GTP-and GDP-tubulin measured by quenching of the intrinsic tubulin fluorescence were (1.7 ± 0.5) 105 m−1 and (1.9 ± 0.3) 105 m−1, respectively (Fig. 6B). These results show that TN-16 binds equally to GTP- and GDP-tubulin with an affinity similar to the colchicine analogue MTC but lower than the R and S isomers (Table 1).
FIGURE 6.

A, GTP-tubulin titration (4 μm) with various concentrations of TN-16 by differential light absorption. In this experiment, we found one binding site with an affinity constant Ka = (5 ± 2) 105 m−1. B, quenching of tubulin tryptophan fluorescence by TN-16. From these individual experiments, we determined affinity constant values (1.68 ± 0.04) 105 m−1 and (1.44 ± 0.06) 105 m−1 with GTP-tubulin (●) and GDP-tubulin (○), respectively. The difference to A may be ascribed to the different method.
DISCUSSION
The Tubulin Assembly Switch and the Role of the Nucleotide
Tubulin switches between a straight conformation when assembled in microtubule protofilaments (16, 18) and a curved conformation in complexes of two tubulin dimers with stathmin or the RB3-SLD (15, 20). One important question for the mechanism of microtubule dynamics is whether free tubulin dimers straighten with respect to curved GDP-tubulin by GTP binding which pre-structures them for assembly (30), or if GTP-tubulin is also curved and switches into a straight conformation as a consequence of the assembly contacts (27) (see Introduction). We have obtained new insight into this problem by studying the interplay of the tubulin-RB3-SLD/stathmin association with the binding of small molecule microtubule inhibitors at the tubulin intradimer interface.
The structures of T2RB3 complexes with the R and S compounds determined in this work show that their binding site overlaps with TN-16 (21), that the binding of these ligands does not induce any large structural changes with respect to unliganded T2RB3 and that binding is incompatible with the tubulin conformation as seen in straight protofilaments. However, the small allosteric effects of the nucleotide gamma phosphate on the binding affinity of the R and S isomers (45) (Table 1) are difficult to explain from the structures of the T2RB3-R and T2RB3-S complexes at their current resolution. The fact that TN-16 does not distinguish GTP- from GDP-tubulin, although it shares the R and S isomer binding site, may be explained by the non-identical interactions with protein residues at the binding site of these compounds with different chemical structures, though higher resolution data would also be required to assess the different interactions with tubulin of these co-localized ligands.
We have found that the GTP-tubulin association with RB3-SLD and the binding of the R and S ligands (see scheme in Fig. 2) are independent of each other. Tubulin-stathmin association measurements and binding measurements with two other ligands, TN-16 and the colchicine analogue MTC, led to similar findings. These four ligands of the colchicine domain bind to tubulin at the intradimer interface, potentially interfering with the relative orientation of the subunits. Since the structure of tubulin in liganded and unliganded T2RB3 complexes is curved (this work and Ref. 21) the simplest interpretation is that the liganded and unliganded tubulin dimers are similarly curved. The possibility that the structure of tubulin around the colchicine binding site would change and the ligands binding affinity would remain the same due to compensations of perturbation effects appears unlikely. This strongly supports the proposal (27) and other evidence (29, 31) suggesting that unassembled GTP-tubulin is curved, instead of as straight as in microtubular sheets (22) and that its structure is close to that of tubulin in T2RB3 (20, 21). Our results do not exclude possible GTP-induced structural changes at another zone of the tubulin dimer.
The radius of curvature of tubulin in T2RB3 (19) is similar to that in magnesium-induced tubulin double rings (8), also suggesting that RB3-SLD binding, at most, weakly modifies the intrinsic curvature of unassembled tubulin. GDP binding favors the closure step of magnesium-induced tubulin double ring formation (5). Colchicine binding slightly enhances (28), whereas R and S isomers slightly inhibit this ring formation (45), possibly by very weak effects propagated along multiple tubulin dimers, that are not perceptible in the stathmin complexes.
Related to our results, it was observed that stathmin only weakly distinguishes (13), if at all, between GTP- and GDP-tubulin dimers (64) and we find that the binding to tubulin of stathmin and of the colchicine domain ligands are independent of each other, both with GTP- and GDP-tubulin. Taken together, the data favor the conclusion that GTP and GDP-tubulin dimers are similarly curved. In this view, binding of the nucleotide γ-phosphate does not markedly modify tubulin curvature, but it lowers the unfavorable free energy difference between curved soluble tubulin and straight microtubular tubulin, and nucleotide hydrolysis in microtubules triggers the disassembly switch (27).
The Linkages between Stathmin and Antitumor Drug Binding to Tubulin
The association of tubulin with the cellular inhibitor stathmin and the binding of small molecule microtubule inhibitors at each of the tubulin dimer interfaces are interesting cases of heterotropic linkage (63). Ligands of the vinblastine domain bind as wedges at the interdimer tubulin interface in T2RB3 (65) and induce self-association of tubulin dimers leading to spirals (66) or single rings (67, 68). Their curvature radii are compatible with the formation of tubulin complexes with the long C-terminal α-helix of SLDs (15, 65). This suggests that vinblastine binding does not strongly modify the interdimer curvature observed in these complexes. Because both stathmin and vinblastine promote the end-to-end association of tubulin dimers by binding to different sites, the linkage of the binding equilibria results in vinblastine increasing the affinity of stathmin for tubulin 50-fold and vice versa, which may explain the increased sensitivity to Vinca alkaloids of tumor cells overexpressing stathmin (50).
We have shown here that both stathmin and four colchicine domain ligands recognize, by binding at different sites, a similarly bent conformation of tubulin in its ground state (26), which is incompatible with microtubules. In this case, the binding of the colchicine domain ligands and stathmin are independent, because ligand binding at the intradimer interface does not affect tubulin curvature and is unrelated to the end-to end association of tubulin dimers.
Antitumor microtubule inhibitors bind to unassembled tubulin and to microtubule ends, suppressing microtubule dynamics (34). Stathmin inhibits microtubule assembly by sequestering tubulin dimers and stimulates depolymerization at microtubule ends (14). It is tempting to speculate that proteins of the stathmin family co-evolved with tubulin to recognize the inactive curved conformations of unassembled and disassembling tubulin and in this manner regulate microtubules.
Supplementary Material
Acknowledgments
We thank Dr. B. Gigant for his invaluable help with crystallographic studies. Diffraction data were collected on beamline ID14–4 at the E.S.R.F. (Grenoble, France). We thank Dr. G. Renner for the gift of the R and S compounds and Dr T. J. Fitzgerald for MTC.
This work was supported by grant from Ministerio de Ciencia BFU2008-00013 (to J. M. A.), a FPU fellowship (L. S.), and a grant from the Association pour la Recherche contre le Cancer n°1035 (to F. D.).
The atomic coordinates and structure factors (codes 3N2G and 3N2K) have been deposited in the Protein Data Bank, Research Collaboratory for Structural Bioinformatics, Rutgers University, New Brunswick, NJ (http://www.rcsb.org/).

The on-line version of this article (available at http://www.jbc.org) contains supplemental Figs. S1–S5 and Table S1.
- T2Stath
- complex of two αβ-tubulin dimers with one stathmin molecule
- SLD
- stathmin-like domain
- T2RB3
- complex of two tubulin dimers with the stathmin-like domain of protein RB3
- R and S isomers
- R-(+) and S-(−) ethyl-5-amino-2-methyl-1,2-dihydro-3-phenylpyrido[3,4-b]pyrazin-7-yl-carbamate
- MTC
- 2-methoxy-5-(2,3,4-trimethoxyphenyl)-2,4,6-cycloheptatrien-1-one
- TN-16
- N-16, 3-(l-anilinoethylidene)-5-benzylpyrrolidine-2,4-dione
- TCEP
- tris(2-carboxyethyl)phosphine
- IPTG
- isopropyl β-d-1-thiogalactopyranoside.
REFERENCES
- 1.Amos L. A., Schlieper D. (2005) Adv. Protein Chem. 71, 257–298 [DOI] [PubMed] [Google Scholar]
- 2.Kueh H. Y., Mitchison T. J. (2009) Science 325, 960–963 [DOI] [PMC free article] [PubMed] [Google Scholar]
- 3.Mandelkow E. M., Mandelkow E., Milligan R. A. (1991) J. Cell Biol. 114, 977–991 [DOI] [PMC free article] [PubMed] [Google Scholar]
- 4.Chrétien D., Fuller S. D., Karsenti E. (1995) J. Cell Biol. 129, 1311–1328 [DOI] [PMC free article] [PubMed] [Google Scholar]
- 5.Howard W. D., Timasheff S. N. (1986) Biochemistry 25, 8292–8300 [DOI] [PubMed] [Google Scholar]
- 6.Melki R., Carlier M. F., Pantaloni D., Timasheff S. N. (1989) Biochemistry 28, 9143–9152 [DOI] [PubMed] [Google Scholar]
- 7.Kirschner M. W., Williams R. C., Weingarten M., Gerhart J. C. (1974) Proc. Natl. Acad. Sci. U.S.A. 71, 1159–1163 [DOI] [PMC free article] [PubMed] [Google Scholar]
- 8.Diaz J. F., Pantos E., Bordas J., Andreu J. M. (1994) J. Mol. Biol. 238, 214–225 [DOI] [PubMed] [Google Scholar]
- 9.Dimitrov A., Quesnoit M., Moutel S., Cantaloube I., Poüs C., Perez F. (2008) Science 322, 1353–1356 [DOI] [PubMed] [Google Scholar]
- 10.Joglekar A. P., Bloom K. S., Salmon E. D. (2010) Curr. Opin. Cell Biol. 22, 57–67 [DOI] [PMC free article] [PubMed] [Google Scholar]
- 11.Sobel A. (1991) Trends Biochem. Sci. 16, 301–305 [DOI] [PubMed] [Google Scholar]
- 12.Belmont L. D., Mitchison T. J. (1996) Cell 84, 623–631 [DOI] [PubMed] [Google Scholar]
- 13.Jourdain L., Curmi P., Sobel A., Pantaloni D., Carlier M. F. (1997) Biochemistry 36, 10817–10821 [DOI] [PubMed] [Google Scholar]
- 14.Steinmetz M. O. (2007) J. Struct. Biol. 158, 137–147 [DOI] [PubMed] [Google Scholar]
- 15.Steinmetz M. O., Kammerer R. A., Jahnke W., Goldie K. N., Lustig A., van Oostrum J. (2000) EMBO J. 19, 572–580 [DOI] [PMC free article] [PubMed] [Google Scholar]
- 16.Nogales E., Wolf S. G., Downing K. H. (1998) Nature 391, 199–203 [DOI] [PubMed] [Google Scholar]
- 17.Löwe J., Li H., Downing K. H., Nogales E. (2001) J. Mol. Biol. 313, 1045–1057 [DOI] [PubMed] [Google Scholar]
- 18.Li H., DeRosier D. J., Nicholson W. V., Nogales E., Downing K. H. (2002) Structure 10, 1317–1328 [DOI] [PubMed] [Google Scholar]
- 19.Gigant B., Curmi P. A., Martin-Barbey C., Charbaut E., Lachkar S., Lebeau L., Siavoshian S., Sobel A., Knossow M. (2000) Cell 102, 809–816 [DOI] [PubMed] [Google Scholar]
- 20.Ravelli R. B., Gigant B., Curmi P. A., Jourdain I., Lachkar S., Sobel A., Knossow M. (2004) Nature 428, 198–202 [DOI] [PubMed] [Google Scholar]
- 21.Dorléans A., Gigant B., Ravelli R. B., Mailliet P., Mikol V., Knossow M. (2009) Proc. Natl. Acad. Sci. U.S.A. 106, 13775–13779 [DOI] [PMC free article] [PubMed] [Google Scholar]
- 22.Wang H. W., Nogales E. (2005) Nature 435, 911–915 [DOI] [PMC free article] [PubMed] [Google Scholar]
- 23.Aldaz H., Rice L. M., Stearns T., Agard D. A. (2005) Nature 435, 523–527 [DOI] [PubMed] [Google Scholar]
- 24.Schlieper D., Oliva M. A., Andreu J. M., Löwe J. (2005) Proc. Natl. Acad. Sci. U.S.A. 102, 9170–9175 [DOI] [PMC free article] [PubMed] [Google Scholar]
- 25.Oliva M. A., Cordell S. C., Löwe J. (2004) Nat. Struct. Mol. Biol. 11, 1243–1250 [DOI] [PubMed] [Google Scholar]
- 26.Shearwin K. E., Perez-Ramirez B., Timasheff S. N. (1994) Biochemistry 33, 885–893 [DOI] [PubMed] [Google Scholar]
- 27.Buey R. M., Díaz J. F., Andreu J. M. (2006) Biochemistry 45, 5933–5938 [DOI] [PubMed] [Google Scholar]
- 28.Shearwin K. E., Timasheff S. N. (1994) Biochemistry 33, 894–901 [DOI] [PubMed] [Google Scholar]
- 29.Rice L. M., Montabana E. A., Agard D. A. (2008) Proc. Natl. Acad. Sci. U.S.A. 105, 5378–5383 [DOI] [PMC free article] [PubMed] [Google Scholar]
- 30.Nogales E., Wang H. W. (2006) Curr. Opin. Struct. Biol. 16, 221–229 [DOI] [PubMed] [Google Scholar]
- 31.Gebremichael Y., Chu J. W., Voth G. A. (2008) Biophys. J. 95, 2487–2499 [DOI] [PMC free article] [PubMed] [Google Scholar]
- 32.Bennett M. J., Chik J. K., Slysz G. W., Luchko T., Tuszynski J., Sackett D. L., Schriemer D. C. (2009) Biochemistry 48, 4858–4870 [DOI] [PMC free article] [PubMed] [Google Scholar]
- 33.Weisenberg R. C., Borisy G. G., Taylor E. W. (1968) Biochemistry 7, 4466–4479 [DOI] [PubMed] [Google Scholar]
- 34.Jordan M. A., Wilson L. (2004) Nat. Rev. Cancer 4, 253–265 [DOI] [PubMed] [Google Scholar]
- 35.Menéndez M., Rivas G., Díaz J. F., Andreu J. M. (1998) J. Biol. Chem. 273, 167–176 [DOI] [PubMed] [Google Scholar]
- 36.Bai R., Covell D. G., Pei X. F., Ewell J. B., Nguyen N. Y., Brossi A., Hamel E. (2000) J. Biol. Chem. 275, 40443–40452 [DOI] [PubMed] [Google Scholar]
- 37.Fitzgerald T. J. (1976) Biochem. Pharmacol. 25, 1383–1387 [DOI] [PubMed] [Google Scholar]
- 38.Andreu J. M., Gorbunoff M. J., Lee J. C., Timasheff S. N. (1984) Biochemistry 23, 1742–1752 [DOI] [PubMed] [Google Scholar]
- 39.Andreu J. M., Perez-Ramirez B., Gorbunoff M. J., Ayala D., Timasheff S. N. (1998) Biochemistry 37, 8356–8368 [DOI] [PubMed] [Google Scholar]
- 40.Díez J. C., Avila J., Nieto J. M., Andreu J. M. (1987) Cell Motil. Cytoskeleton 7, 178–186 [DOI] [PubMed] [Google Scholar]
- 41.Gajate C., Barasoain I., Andreu J. M., Mollinedo F. (2000) Cancer Res. 60, 2651–2659 [PubMed] [Google Scholar]
- 42.Temple C., Jr., Rener G. A. (1989) J. Med. Chem. 32, 2089–2092 [DOI] [PubMed] [Google Scholar]
- 43.Leynadier D., Peyrot V., Sarrazin M., Briand C., Andreu J. M., Rener G. A., Temple C., Jr. (1993) Biochemistry 32, 10675–10682 [DOI] [PubMed] [Google Scholar]
- 44.de Ines C., Leynadier D., Barasoain I., Peyrot V., Garcia P., Briand C., Rener G. A., Temple C., Jr. (1994) Cancer Res. 54, 75–84 [PubMed] [Google Scholar]
- 45.Barbier P., Peyrot V., Leynadier D., Andreu J. M. (1998) Biochemistry 37, 758–768 [DOI] [PubMed] [Google Scholar]
- 46.Arai T. (1983) FEBS Lett. 155, 273–276 [DOI] [PubMed] [Google Scholar]
- 47.Castoldi M., Popov A. V. (2003) Protein Expr. Purif. 32, 83–88 [DOI] [PubMed] [Google Scholar]
- 48.Dorleans A., Knossow M., Gigant B. (2007) Methods Mol. Med. 137, 235–243 [DOI] [PubMed] [Google Scholar]
- 49.Andreu J. M. (2007) Methods Mol. Med. 137, 17–28 [DOI] [PubMed] [Google Scholar]
- 50.Devred F., Tsvetkov P. O., Barbier P., Allegro D., Horwitz S. B., Makarov A. A., Peyrot V. (2008) FEBS Lett. 582, 2484–2488 [DOI] [PMC free article] [PubMed] [Google Scholar]
- 51.Otwinowski Z., Minor W. (1997) Methods Enzymol. 276, 20. [DOI] [PubMed] [Google Scholar]
- 52.Winn M. D., Isupov M. N., Murshudov G. N. (2001) Acta Crystallogr. D. Biol. Crystallogr. 57, 122–133 [DOI] [PubMed] [Google Scholar]
- 53.Schüttelkopf A. W., van Aalten D. M. (2004) Acta Crystallogr. D. Biol. Crystallogr. 60, 1355–1363 [DOI] [PubMed] [Google Scholar]
- 54.CCP4 (1994) Acta Crystallogr. D. Biol. Crystallogr. 50, 760–763 [DOI] [PubMed] [Google Scholar]
- 55.Jones T. A., Zou J. Y., Cowan S. W., Kjeldgaard M. (1991) Acta Crystallogr. A. 47, 110–119 [DOI] [PubMed] [Google Scholar]
- 56.Dominguez R., Souchon H., Spinelli S., Dauter Z., Wilson K. S., Chauvaux S., Béguin P., Alzari P. M. (1995) Nat. Struct. Biol. 2, 569–576 [DOI] [PubMed] [Google Scholar]
- 57.DeLano W. L. (2002) The PyMOL Molecular Graphics System, DeLano Scientific LLC [Google Scholar]
- 58.Esnouf R. M. (1997) J Mol. Graph Model 134, 112–133 [DOI] [PubMed] [Google Scholar]
- 59.Merritt E. A., Bacon D. J. (1997) Methods Enzymol. 277, 505–524 [DOI] [PubMed] [Google Scholar]
- 60.Schuck P., Rossmanith P. (2000) Biopolymers 54, 328–341 [DOI] [PubMed] [Google Scholar]
- 61.Balbo A., Minor K. H., Velikovsky C. A., Mariuzza R. A., Peterson C. B., Schuck P. (2005) Proc. Natl. Acad. Sci. U.S.A. 102, 81–86 [DOI] [PMC free article] [PubMed] [Google Scholar]
- 62.Barbier P., Peyrot V., Sarrazin M., Rener G. A., Briand C. (1995) Biochemistry 34, 16821–16829 [DOI] [PubMed] [Google Scholar]
- 63.Wyman J., Gill S. J. (1990) Binding and Linkage. Functional Chemistry of Biological Macromolecules, University Science Books, Mill Valley, CA [Google Scholar]
- 64.Honnappa S., Cutting B., Jahnke W., Seelig J., Steinmetz M. O. (2003) J. Biol. Chem. 278, 38926–38934 [DOI] [PubMed] [Google Scholar]
- 65.Cormier A., Marchand M., Ravelli R. B., Knossow M., Gigant B. (2008) EMBO Rep. 9, 1101–1106 [DOI] [PMC free article] [PubMed] [Google Scholar]
- 66.Lobert S., Ingram J. W., Correia J. J. (2007) Biophys. Chem. 126, 50–58 [DOI] [PubMed] [Google Scholar]
- 67.Barbier P., Gregoire C., Devred F., Sarrazin M., Peyrot V. (2001) Biochemistry 40, 13510–13519 [DOI] [PubMed] [Google Scholar]
- 68.Moores C. A., Milligan R. A. (2008) J. Mol. Biol. 377, 647–654 [DOI] [PMC free article] [PubMed] [Google Scholar]
- 69.Nogales E., Downing K. H., Amos L. A., Löwe J. (1998) Nat. Struct. Biol. 5, 451–458 [DOI] [PubMed] [Google Scholar]
Associated Data
This section collects any data citations, data availability statements, or supplementary materials included in this article.