

Abstract
Cytochrome P450 46A1 (CYP46A1) initiates the major pathway of cholesterol elimination from the brain and thereby controls cholesterol turnover in this organ. We determined x-ray crystal structures of CYP46A1 in complex with four structurally distinct pharmaceuticals; antidepressant tranylcypromine (2.15 Å), anticonvulsant thioperamide (1.65 Å), antifungal voriconazole (2.35 Å), and antifungal clotrimazole (2.50 Å). All four drugs are nitrogen-containing compounds that have nanomolar affinity for CYP46A1 in vitro yet differ in size, shape, hydrophobicity, and type of the nitrogen ligand. Structures of the co-complexes demonstrate that each drug binds in a single orientation to the active site with tranylcypromine, thioperamide, and voriconazole coordinating the heme iron via their nitrogen atoms and clotrimazole being at a 4 Å distance from the heme iron. We show here that clotrimazole is also a substrate for CYP46A1. High affinity for CYP46A1 is determined by a set of specific interactions, some of which were further investigated by solution studies using structural analogs of the drugs and the T306A CYP46A1 mutant. Collectively, our results reveal how diverse inhibitors can be accommodated in the CYP46A1 active site and provide an explanation for the observed differences in the drug-induced spectral response. Co-complexes with tranylcypromine, thioperamide, and voriconazole represent the first structural characterization of the drug binding to a P450 enzyme.
Keywords: Cholesterol, Cholesterol Metabolism, Crystal Structure, Cytochrome P450, Drug Design, Enzyme Structure, Membrane Proteins, X-ray Crystallography
Introduction
Cytochrome P450 46A1 (CYP46A1)3 catalyzes cholesterol 24S-hydroxylation, the first step in cholesterol elimination from the brain (1–3). This enzymatic reaction produces a membrane-permeable form of cholesterol, 24(S)-hydroxycholesterol, that spontaneously diffuses across cellular membranes and the blood-brain barrier to systemic circulation and is delivered to the liver for further degradation (2, 4). Recent studies in animals indicate that CYP46A1 is important for memory and learning. Loss of CYP46A1 gene in mice leads to slower cholesterol excretion from the brain and a compensatory decrease in cerebral cholesterol biosynthesis. This response maintains the steady-state levels of the brain cholesterol within the normal range yet reduces cerebral cholesterol turnover and the production of the biosynthetic intermediate geranylgeraniol necessary for normal learning and hippocampal plasticity (5, 6). As a result, CYP46A1 knock-out (KO) mice show severe deficiencies in spatial, associative, and motor learning and have a significantly impaired cognitive performance in common laboratory tests (7). Reduced cholesterol biosynthesis does not, however, affect amyloid plaque deposition in CYP46A1 KO mice cross-bred with one of the mouse models of Alzheimer disease but does extend animal life span (8). Effect of increased CYP46A1 expression was evaluated in two mouse models of Alzheimer disease (9). Cerebral delivery of CYP46A1 gene by adeno-associated virus increased the production of 24(S)-hydroxycholesterol and reduced amyloid deposits before and after the formation of amyloid plaques. CYP46A1-treated transgenic animals also had improved spatial memory (9). Identification of several polymorphisms in the CYP46A1 gene in humans led to numerous investigations assessing the link between these polymorphisms and neurodegenerative disease, such as Alzheimer disease. Data on association of CYP46A1 polymorphisms and dementias in humans still conflict and require additional studies (for review, see Ref. 10).
CYP46A1 has also been characterized biochemically and structurally (11, 12). First, we expressed human CYP46A1 in Escherichia coli and described catalytic properties of the purified recombinant enzyme. We found that in vitro substrate specificities of CYP46A1 are not limited to cholesterol and include a number of structurally distinct compounds, both sterols and marketed drugs (11). Then we determined crystal structures of substrate-free and substrate-bound CYP46A1 and established the structural basis for the broad substrate specificity of this P450; the enzyme active site turned out to be conformationally flexible and capable of being reshaped by interactions with the substrate (12). This finding led to a search and identification of several therapeutic drugs that significantly inhibit CYP46A1 activity in vitro (12). Subsequent testing of one of these drugs, voriconazole, on mice showed that voriconazole inhibits cholesterol 24-hydroxylation not only in vitro but in vivo as well (13).
In the present work we continued our studies of CYP46A1 and determined x-ray structures of the P450 in complex with four tight binding pharmaceuticals; they are the monoamine oxidase inhibitor tranylcypromine (antidepressant), H3/H4 receptor antagonist thioperamide (experimental anticonvulsant), and two CYP51 inhibitors, clotrimazole and voriconazole (antifungal agents) (14). The four drugs were selected because they differ in size, shape, and hydrophobicity, contain different types of nitrogen atom ligand (primary amine, azole, and 1,2,4 triazole; see Fig. 1), and belong to different drug classes. These drugs also elicit a red shift in the CYP46A1 Soret γ band, yet of a different magnitude, indicating that they belong to a group of the so called type II ligands. Type II ligands are usually nitrogen-containing compounds that bind to P450s by displacing the water ligand from the heme iron and forming an N-Fe coordinate bond. This bond is much stronger than that formed by the water ligand. Therefore, in general, type II ligands are inhibitors of P450s because they stabilize their low reduction potential and prevent binding of molecular oxygen during the monooxygenation reaction (15, 16). The results of the present study reveal how the enzyme adapts to bind structurally distinct compounds and provide an explanation for the observed tight binding and differences in the P450 spectral response. We also demonstrate novel modes of the drug-P450 binding and interactions that could be conserved in the P450 superfamily.
FIGURE 1.

Chemical structures of the CYP46A1 substrate cholesterol and compounds tested in the present study.
EXPERIMENTAL PROCEDURES
Chemicals
Tranylcypromine (TCP), thioperamide (THP), and other chemicals were from Sigma unless otherwise specified. Voriconazole (VOR) (Vfend) was obtained from Pfizer, clotrimazole (CLO) was from MP Biomedicals, Inc, and detergents were from Anatrace.
Protein Expression, Purification, and Crystallization
All studies were carried out on truncated, Δ(2–50), human CYP46A1 unless otherwise specified. Substrate-free enzyme for spectral binding assay was expressed and purified as described (12). Drug complexes for crystallization were obtained by saturating CYP46A1 with the inhibitor during the last purification step, chromatography on CM-cellulose. The washing and elution buffers at this step contained 50 μm inhibitor, and the inhibitor was also present in the buffer used for dilution of CYP46A1 before concentration. Crystals of drug complexes were grown at 18 °C in sitting drops after 1 μl of CYP46A1 solution was mixed with 1 μl of precipitant solution. The P450 solution contained 40 mg/ml CYP46A1, 50 μm drug, 50mm potassium phosphate buffer (KPi), pH 7.2, 20% glycerol, 25 mm NaCl, 1 mm EDTA, and 0.2 mm DTT. The precipitant solutions were as follows: 12% PEG 8000, 50 mm KPi, pH 5.8, 20% glycerol, and 0.1 m trimethylamine N-oxide for TCP-CYP46A1; 8% PEG 8000, 50 mm KPi, pH 5.8, and 20% glycerol for the THP-CYP46A1 complex; 8% PEG 8000, 50 mm KPi, pH 4.7, 20% glycerol, and 0.03% undecylmaltoside for VOR-CYP46A1 complex; 14% PEG 8000, 50 mm KPi, pH 6.4, and 20% glycerol for the CLO-CYP46A1 complex. The morphology of initial crystals was improved by microseeding with a cat whisker.
Spectral Binding Assay
Binding affinities of drugs were estimated as described (12, 13) using 0.3 μm purified truncated CYP46A1. Titrations were carried out in 50 mm KPi, pH 7.2, 100 mm NaCl at 18 °C. Drugs were added from 0.1–1 mm stocks in 50% methanol, except CLO, whose stock was in 100% methanol. As with the full-length CYP46A1, spectral shifts in truncated CYP46A1 showed a hyperbolic dependence on the inhibitor concentration and reached a plateau (supplemental Fig. S1). The Kd values were calculated by nonlinear least-squares fitting using the quadratic form of the single-site binding equation (17),
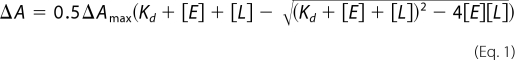 |
where ΔA is the spectral response at different ligand concentrations [L], ΔAmax is the maximal amplitude of the spectral response, and [E] is the enzyme concentration. When the calculated binding constants were much lower than the concentration of the protein in the assay, the numbers represent estimates only, reflecting whether the ligand has low, intermediate, or high nanomolar affinity.
Inhibition Assay
Effect of different compounds on cholesterol 24-hydroxylase activity of CYP46A1 was evaluated in the reconstituted system in vitro as described (12), except the reaction temperature was 22 °C and phospholipids were not included. The reaction mixture contained 0.4 μm CYP46A1, 1.0 μm NADPH cytochrome P450 oxidoreductase, 1 mm NADPH, 3.8 μm cholesterol as a substrate (this concentration is equal to 0.5 Km), 2.9 nm [3H]cholesterol (250,000 cpm), and 62 μm test compound.
Enzyme Assay and Mass Spectrometry (MS) Analysis
CLO hydroxylation by CYP46A1 was carried out for 60 min at either 25 or 37 °C in 1 ml of 50 mm KPi, pH 7.2, containing 100 mm NaCl. Purified 0.5 μm CYP46A1 was reconstituted with 1.0 μm NADPH cytochrome P450 oxidoreductase, 1 μm CLO, and NADPH-regenerating system. The enzymatic reaction was terminated by vortexing with 2 ml of CH2Cl2. The organic phase was isolated, evaporated, and dissolved in 200 μl of methanol containing 0.1% formic acid. The solution was then directly infused into a Thermo-Finnigan LCQ Deca mass spectrometer via a syringe pump at a rate of 10 μl/s. Electrospray ionization was performed in positive ion mode with the following conditions: ionization probe voltage, 4.5 kV; N2 sheath gas, 20 relative units; transfer capillary temperature, 150 °C; transfer capillary voltage, −20 V. Ion optics parameters were automatically tuned to maximize signal at m/z 345 Da. Forty MS scans were collected for each sample and averaged using XCalibur Qual Browser. MS2 spectra were collected on the same instrument operating in MS2 mode with a mass isolation width of 4.5 Da. Daughter transitions were generated utilizing normalized collision energy of 10–25% during MS2.
X-ray Data Collection, Processing, and Structure Determination
X-ray diffraction data were collected from single crystals at Stanford Synchrotron Radiation Lightsource (SSRL) beam lines at 100 K (18). The diffraction limits of THP-, TCP-, VOR-, and CLO-bound crystals were 1.65, 2.15, 2.35, and 2.50 Å resolution, respectively. Data sets were processed with Mosflm (19) and CCP4 programs (20). The structure of THP-bound CYP46A1 was determined by molecular replacement using cholesterol sulfate (C3S)-bound Δ(2–50)CYP46A1 as the search model (Protein Data Bank code 2Q9F) and Phaser (21). The THP-CYP46A1 complex then served as the preliminary model for a molecular replacement solution for the TCP-, VOR-, and CLO-bound structures. SigmaA weighted 2 Fo − F1c, and unbiased composite omit maps were used to correct the models, identify substrate density, and place H2O molecules. The models were refined using both Refmac (22) and CNS (23). The THP complex crystallized with one molecule in the asymmetric unit in space group P212121. The TCP, VOR, and CLO complexes crystallized in space group I41 with two molecules per asymmetric unit and cell dimensions closely similar to crystals of the C3S complex in space group I4122. The TCP, VOR, and CLO structures were refined with (partial) merohedral twin fractions α 0.468, 0.500, and 0.459, respectively. The data for the VOR complex were corrected for anisotropy (24) (eigenvalues 0.6501, 1.000, 1.000 in Ctruncate (20), and the isotropic B factors were used to derive 20 translation/libration/screw groups per chain (25). Data collection and refinement statistics for the four drug-bound structures are given in Table 1.
TABLE 1.
Crystallographic statistics for CYP46A1 drug complexes
| CYP46A1 complex | Thioperamide | Tranylcypromine | Voriconazole | Clotrimazole |
|---|---|---|---|---|
| PDB code | 3MDM | 3MDR | 3MDT | 3MDV |
| Space group | P212121 | I41 | I41 | I41 |
| Unit cell dimensions (Å) | 58.83 85.82 104.20 | 121.19 121.19 143.99 | 121.60 121.60 143.83 | 121.61 121.61 144.61 |
| Molecules per asymmetric unit | 1 | 2 | 2 | 2 |
| Solvent content | 49.6% | 49.8% | 50.2% | 50.4% |
| Data | ||||
| Total observations >0σF | 450,397 | 202,856 | 157,055 | 198,607 |
| Unique reflections >0σF | 64,205 | 55,839 | 42,939 | 36,109 |
| Redundancy | 7.0 | 3.6 | 3.7 | 5.5 |
| Completeness | 100.0% | 99.2% | 98.9% | 99.5% |
| Resolution (last shell) (Å) | 1.74-1.65 | 2.27-2.15 | 2.48-2.35 | 2.64-2.50 |
| 〈 σI〉 all data (last shell) | 16.9 (2.0) | 11.8 (2.3) | 13.9 (2.3) | 13.4 (2.1) |
| Rmerge all data (last shell) | 0.074 (0.376) | 0.067 (0.303) | 0.064 (0.326) | 0.097 (0.357) |
| Refinement | ||||
| R-factor | 0.178 | 0.199 | 0.209 | 0.196 |
| Rfree | 0.220 | 0.230 | 0.243 | 0.219 |
| Reflections used | 60,424 | 52,986 | 41,063 | 33,183 |
| Test set | 3,182 (5.0%) | 2840 (5.1%) | 2111 (4.9%) | 1735 (5.0%) |
| r.m.s.d. from ideality | ||||
| Bond lengths (Å) | 0.030 | 0.027 | 0.024 | 0.023 |
| Bond angles (degree) | 2.12 | 1.97 | 1.62 | 1.62 |
| Ramachandran plot | ||||
| Favored regions | 97.7% | 97.5% | 97.9% | 96.7% |
| Allowed regions | 100.0% | 99.6% | 100.0% | 99.9% |
| Model | ||||
| Copy A | Residues/average B (Å2) | Residues/average B (Å2) | Residues/average B (Å2) | Residues/average B (Å2) |
| Protein | 437 (19.1) | 427 (38.3) | 424 (34.3) | 424 (32.5) |
| Heme | 1 (10.2) | 1 (23.9) | 1 (21.1) | 1 (19.6) |
| Drug | 1 (12.9) | 1 (38.2) | 1 (44.8) | 1 (56.1) |
| Copy B | ||||
| Protein | 425 (38.1) | 424 (35.9) | 424 (32.5) | |
| Heme | 1 (23.8) | 1 (23.5) | 1 (17.9) | |
| Drug | 1 (37.8) | 1 (42.4) | 1 (53.8) | |
| H2O molecules | 774 (37.9) | 340 (37.1) | 378 (34.1) | 484 (33.2) |
Calculation of the Active Site Volumes and Volumes of the Ligands
The solvent-accessible surface of the active site without the ligand and water molecules was calculated first using VOIDOO (26) with a 1.4-Å probe and a mesh of 1.0. Then the cavity was filled out with water molecules using FLOOD, and the final volume was determined. Volumes of the ligands were calculated by VOIDOO as well using the conformer taken from the crystal structure.
RESULTS
Binding of TCP to CYP46A1
TCP (Mr = 133; 6.4 Å in length) is the smallest of the four drugs characterized in the present study and the only known tight CYP46A1 inhibitor that has a primary amine (Fig. 1). Titration with TCP elicited a shift in the CYP46A1 Soret γ band (λmax) from 418 to 427 nm and led to the appearance of a trough at 414 nm and peak at 435 nm in the difference spectrum (Fig. 2B). This spectral behavior represents a classical type II spectral response of the P450 enzymes and reflects the coordination of the P450 heme iron with a nitrogen-containing ligand (15). Spectral titrations and enzyme activity studies demonstrate that TCP binds to CYP46A1 with low nanomolar affinity and completely inhibits cholesterol 24-hydroxylation under the experimental conditions used (Table 2). The TCP-P450 complex crystallized in space group I41, related to the original substrate-free and C3S-bound CYP46A1 crystals in I4122 but with two molecules in the asymmetric unit (Table 1). Molecule A has electron density for residues 58–491 and molecule B for residues 58–489, and both molecules lack electron density for residues 229–235 (F-G loop). Overall fold and details of the active site in the TCP-bound CYP46A1 are very similar in the two molecules (r.m.s.d. for Cα atoms 0.07 Å) including well defined electron density for TCP allowing unambiguous fitting of the drug (Fig. 3).
FIGURE 2.

Absolute and difference (insets) spectra of CYP46A1 in the absence (A) and presence of different drugs (B, TCP; C, THP; D, VOR; E, CLO). The concentration of CYP46A1 is 0.3 μm, and that of the ligand is 50 μm. The black line shows the CYP46A1 spectrum at 18 °C, and red line shows the spectrum at 37 °C.
TABLE 2.
Some of the properties of the nitrogen-containing ligands investigated in the present study
C3S is included for comparison. NA, not applicable. ND, not determined.
| Ligand | Spectral response in CYP46A1 |
Spectral Kd | Cholesterol hydroxylation | Log P | Volume of the ligand/volume of the active site, Å3/Å3 | |
|---|---|---|---|---|---|---|
| λmax in the absolute spectrum | λmin and λmax in the difference spectrum | |||||
| nm | nm | % | ||||
| CYP46A1 wild type | ||||||
| None | 418 | NA | 100 ± 3a | NA/470b | ||
| C3S | 414 | 425, 389 | 7 ± 1 | 5.3c | 431/522 | |
| TCP | 427 | 414, 435 | 10 ± 4 | Not detectable | 1.4d | 142/302 |
| 2-Phenylethylamine | 426 | 414, 435 | 60 ± 7 | Not detectable | 0.9c | ND |
| Benzylamine | 425 | 414, 435 | 6,400 ± 80 | 1.1c | ND | |
| Aniline | 424 | 413, 432 | 52,000 ± 1,900 | 1.0c | ND | |
| Milnacipran | 427 | 413, 435 | 9,500 ± 50 | 86 ± 3 | 1.7c | ND |
| THP | 427 | 414, 435 | 60 ± 7 | Not detectable | 2.7c | 278/301 |
| VOR | 423 | 412, 431 | 180 ± 10 | 5 ± 1 | 1.0d | 310/450 |
| Fluconazole | 425 | 414, 433 | 7,500 ± 50 | 87 ± 4 | 0.4d | ND |
| CLO | 422 | 410, 429 | 4 ± 1 | 25 ± 2 | 6.1d | 323/437 |
| T306A mutant | ||||||
| None | 418 | N/A | ||||
| TCP | 424 | 413, 432 | 50 ± 10 | |||
| THP | 427 | 415, 435 | 10 ± 3 | |||
| VOR | 421.5 | 412, 430 | 280 ± 10 | |||
| CLO | 425 | 414, 434 | 5 ± 1 | |||
a Conditions of the inhibition assay are described under “Experimental Procedures.” The results are the means of three independent experiments ± S.D.
b Calculated as described under “Experimental Procedures.”
c Calculated using Molinspiration.
d Determined experimentally, these data are taken from DrugBank.
FIGURE 3.

Unbiased composite omit electron density contoured at 1σ and 3σ for four CYP46A1 complexes: THP, TCP, VOR, CLO. For TCP and CLO, copy A of the asymmetric unit is shown; for VOR, copy B of the asymmetric unit is shown. For the THP and TCP complexes a portion of the electron density peak on iron is also present.
In molecule A the geometry of TCP-heme iron interaction is close to ideal for a ligand-metal complex with orthogonal binding and a N-Fe distance of 2.23 Å (27–29). In addition to the coordination of the heme iron, the primary amine in TCP also provides a hydrogen bond to the Ala-302 carbonyl and has the Thr-306 hydroxyl at a 3.8 Å distance (Fig. 4A). This distance, however, is too long to be a hydrogen bond. The cyclopropyl ring in TCP makes van der Waals contacts with the side chains of Ala-302, Ala-367, and Thr-306 and perfectly fits in the angle formed by the Thr-306 hydroxyl and methyl groups (Fig. 4A). The shape complementarity on the opposite side of the cyclopropyl ring is not ideal, however; this part is less restrained with contacts of 4.2 Å to a propionate aliphatic carbon atom and 4.77 Å to the Val-126 side chain. The TCP benzyl ring in contrast is restrained on all sides; its plane is located between the side chains of Thr-475 and Phe-121, and the edge is flanked by Leu-112 (contacts in the range 3.81–3.96 Å). In addition, the benzyl ring occupies the expanded groove of the I helix with van der Waals contacts to Ile-301, Ala-302, and Thr-306 (3.69–4.11 Å). A comparison to the substrate-free CYP46A1 structure indicates that conformational changes induced by TCP binding are limited to readjustments of the side chains only both inside (Leu-112, Phe-121, Ile-301, Phe-80, Met-218, and Arg-226) and outside (Arg-76, Asn-78, His-81, and Met-189) the active site (Fig. 4B). The movement of Leu-112 and Phe-121 improves the TCP-active site complementarity, whereas the shifts in the other side chains alter the shape and volume of the active site and lead to the blockage of the substrate access channel between the F-helix and β-sheet 1 (12). The volume of the active site in TCP-bound CYP46A1 is reduced by ∼35% as compared with the substrate-free enzyme (302 versus 470 Å3), yet there is still unoccupied space in the cavity (∼160 Å3) that exceeds the volume of the TCP molecule (142 Å3) (Table 2).
FIGURE 4.

Views of the CYP46A1 active site illustrating interactions with TCP. A, residues in contact with TCP are shown. Portions of the secondary structure are also shown. B, superposition of TCP-bound (slate) versus ligand-free (wheat) CYP46A1 show the active site volumes and amino acid residues that undergo conformational changes upon TCP binding. The heme group in TCP and ligand-free CYP46A1 is in light orange and red, respectively, and TCP is in yellow. The nitrogen, oxygen, sulfur, and iron atoms are in blue, red, yellow, and orange, respectively. H2O molecule 290 is shown as a red sphere. Dashed black lines indicate hydrogen bonds. Protein side chains are shown as sticks, and the solvent-occupied surface of the active site is shown as a light blue mesh (TCP-bound CYP46A1) and wheat surface (ligand-free CYP46A1).
Determinants of Tight TCP Binding to CYP46A1
The crystal structure of the TCP co-complex indicates that an orthogonal coordinate bond with the heme iron, hydrogen bond with the Ala-302 carbonyl, and a good complementarity fit to several regions of the active site underlie high affinity of the inhibitor to CYP46A1. To gain insight into structural features of TCP that determine these interactions, we titrated CYP46A1 with four structural analogs; three nonpharmaceuticals (2-phenylethylamine, benzylamine, and aniline) and a marketed drug milnacipran (Fig. 1). All three nonpharmaceuticals lack the cyclopropyl ring and have 0, 1, or 2 carbon atoms between the nitrogen atom and benzyl ring; milnacipran does have a cyclopropyl ring but with a different stereochemistry and a bulky substitution near the benzyl ring. This drug also has an additional methylene group between the nitrogen atom and cyclopropyl ring as compared with TCP. All four structural analogs elicited a type II spectral response in CYP46A1 (Table 2), indicating that they bind in the active site and ligate the heme iron with their nitrogen atoms. The estimated Kd of 2-phenylethylamine was 60 nm, and those of benzylamine, aniline, and milnacipran were much higher and equal to 6,400, 52,000, and 9,500 nm, respectively (Table 2). Less than a 10-fold increase in the Kd of 2-phenylethylamine suggests that contacts between the cyclopropyl ring in TCP and CYP46A1 contribute only moderately to the strength of the drug binding to the P450. This Kd as well as the significantly increased Kd values of benzylamine and aniline also indicate that the benzyl ring should be separated by two carbon atoms from the amino group to have optimal interactions with CYP46A1. Much lower affinities of benzylamine and aniline are presumably due to increasingly severe steric clashes of one or zero carbon atom linkages with Ala-302, Ala-367, and Thr-306, residues otherwise in contact with the TCP cyclopropyl ring. Finally, similar Kd values of milnacipran and benzylamine suggest that the CYP46A1 active site can accommodate substitutions near the benzyl ring if it is sufficiently distal from the amino group.
Next, we investigated the properties of the T306A CYP46A1 mutant. The Thr-306 side chain positions the TCP cyclopropyl ring, whereas hydrogen bonding to a H2O molecule 290 widens the groove in the I helix, allowing the benzyl moiety to wedge into the helix (Fig. 4A). H2O molecule 290 also hydrogen bonds to the Ala-302 carbonyl and the amide and side chain of Ser-307, whereas the Ala-302 carbonyl accepts a hydrogen bond from the TCP primary amine. Replacement of Thr-306 with a smaller alanine creates a partial loss of the active site complementarity and could affect the position of H2O molecule 290 and consequently the width of the groove in the I helix and interaction of Ala-302 with the TCP amine. In the T306A mutant, the Kd for TCP increased only 5-fold (Table 2), suggesting retention of the TCP hydrogen bond with Ala-302, bound water, and a widened I-helix. The lower affinity may be due to loss of van der Waals contacts between the methyl group of Thr-306 and the cyclopropyl ring. The inhibitor also elicited a smaller red shift in the Soret γ band in the mutant than in the wild type enzyme (to 424 versus 427 nm; Table 2), possibly reflecting a less polar environment for the primary amine group and heme iron due to the loss of the Thr-306 hydroxyl.
To elucidate the contribution of the hydrogen bonding between the TCP primary amine and Ala-302 carbonyl, we analyzed co-crystal structures of CYP2A6 with the three furan analogs bearing methanamino side chains with different substitutions at the nitrogen atom coordinating the heme iron (PDB ID codes 2FDW, 2FDV, and 2FDU) (30). The heme ligand in the 2FDW structure is the primary amine, whereas in 2FDV and 2FDU it is a secondary and tertiary amine with one and two methyl groups, respectively. Similar to CYP46A1, the primary amine in 2FDW coordinates the heme iron and is hydrogen-bonded to the carbonyl of Gly-301, a counterpart of Ala-302 in CYP46A1. The N-Fe and N-carbonyl distances in 2FDW are 2.30 and 3.50 Å, respectively, and comparable with those in CYP46A1 (2.23 and 3.39 Å, respectively). Hydrogen bonding to the Gly-301 is, however, lost in the 2FDV and 2FDU structures because of the methyl substitutions, and the distance between the inhibitor nitrogen and Gly-301 carbonyl becomes longer by 0.6 Å as compared with the corresponding distance in 2FDW. This increase in the distance in 2FDV and 2FDU suggests that the NH2-carbonyl interaction in 2FDW is favorable and that it likely contributes to tighter inhibitor binding. In CYP2A6, the Ki of the primary amine is 0.1 μm, whereas those of the secondary and tertiary amines are 8 and 140 times higher (30). Thus, hydrogen bonding of TCP with the Ala-302 carbonyl in CYP46A1 coupled with direct coordination to the heme iron and favorable packing in the groove of the I-helix could explain the tight association of the drug with the I-helix on one side of the active site cavity. This tight association represents a striking feature of the TCP-CYP46A1 complex because it leaves a significant unoccupied volume in the active site.
Binding of THP to CYP46A1
THP (Mr = 292, 11.6 Å in length) is the longest of the four inhibitors that CYP46A1 was co-crystallized with, although not as long as cholesterol (∼16.7 Å). The drug is composed of alternating planar moieties (imidazole and thioamide) and saturated six-membered rings (piperidine and cyclohexyl) (Fig. 1). Similar to TCP, THP elicited a classical type II spectral response in CYP46A1 (the spectral Kd was estimated to be 60 nm, Table 2) with λmax at 427 nm in the absolute spectrum and a trough at 414 nm and peak at 435 nm in the difference spectrum (Fig. 2C). THP also completely abolished CYP46A1 enzyme activity in the in vitro inhibition assay (Table 2). Co-complex with THP crystallized with one molecule in the asymmetric unit in a different crystal form (space group P212121) as compared with the substrate-free and C3S-bound forms (12) (space group I4122) with significantly improved resolution (1.65 Å) (Table 1). Consistent with its tight binding, THP is very well defined in the electron density with an average B-factor of 12.9 Å2 (Fig. 3, Table 1). The active site in the drug complex is closed, and there are multiple favorable interactions with all components of the THP molecule (Fig. 5A). The imidazole ring is almost perpendicular to the plane of the heme and coordinates the heme iron via nitrogen N1 (N1-Fe distance 2.0 Å). The imidazole ring also stacks on Ala-302 and donates a hydrogen bond to the Thr-306 hydroxyl (Fig. 5A). The piperidine ring, which overlaps the position of the C3S side chain in the active site (Fig. 5B), is surrounded by Leu-112, Phe-121, Val-126, Ala-367, Ala-474, and Thr-475 within 5 Å and a trapped H2O molecule 781 (Fig. 5A). The shortest contacts that position this ring are with Leu-112 and Thr-475 at 3.5 Å. The thioamide group is restrained by the side chains of Leu-112 and Ala-474 and the Ala-474 carbonyl. This group has two polar interactions with CYP46A1. The thioamide sulfur forms charge-stabilized NH…S-type hydrogen bonds with the Arg-226 side chain at 3.40 and 3.76 Å, whereas the thioamide nitrogen N4 is hydrogen-bonded to an active site H2O molecule 600 in a hydrogen-bonded network with the H2O molecule 1103, Trp-368 amide, Gly-369 carbonyl, and propionate A carboxyl (Fig. 5A). In CYP46A1, the propionate A carboxyl is located above the heme plane where it interacts with Lys-104, Tyr-109, and Thr-370. Commonly, in other P450 structures both propionates are below the heme macrocycle. Consequently, the water bridging functionality of the heme propionate A plays a role in recognition of THP. Finally, the THP cyclohexyl ring occupies an aromatic nest of Phe-80, Tyr-109, Trp-368, and Phe-371 side chains and is in contact with Leu-112.
FIGURE 5.

Views of the CYP46A1 active site illustrating interactions with THP. A, residues in contact with THP are shown. B, superposition of THP-bound (cyan) versus C3S-bound (magenta) CYP46A1, and (C) THP-bound (cyan) versus ligand-free (wheat) P450 show the position of the ligands and major conformational differences between the structures. The heme group in THP and C3S-bound co-complexes is in light pink and red, respectively, and in ligand-free CYP46A1 is in hot pink. THP is in lemon, and C3S is in light orange. The nitrogen, oxygen, sulfur, and iron atoms are in blue, red, yellow, and orange, respectively. H2O molecules are shown as red spheres. Dashed black lines indicate hydrogen bonds. The solvent occupied surface of the active site in THP-bound CYP46A1 is colored in gray.
Determinants of Tight THP Binding to CYP46A1
THP has a distant similarity to C3S, a substrate that was previously co-crystallized with CYP46A1 (12). Like C3S, THP has a flat structure with several sequentially linked rings and, like C3S THP, induces conformational changes in the secondary structural elements that encompass the active site (Fig. 5B). To identify key conformational changes that underlie tight THP binding, we compared the THP-bound structure to both the C3S-bound and substrate-free CYP46A1 structures (Fig. 5, B and C). The major difference between the THP- and C3S-bound structures is that two residues in the former, Phe-80 on the loop between the β1–1 and β1–2 strands and Arg-226 at the end of the F-helix, swing into the active site to interact with THP (Fig. 5B). Phe-80 provides hydrophobic contacts to the cyclohexyl ring, whereas Arg-226 provides electrostatic complementarity with the thioamide moiety. Simultaneously, Phe-80 and Arg-226 stack and occupy the space filled with the rings A and B of the substrate in the C3S-bound structure. The interaction of Phe-80 and Arg-226, supported by a hydrogen bond between His-81 and the carbonyl of Asn-227 (not shown in Fig. 5B), leads to a 2.4 Å shift of the tip of the β1–1-β1–2 loop at Phe-80 and significant rearrangement of residues 225–235 encompassing the F-G loop). In particular, the Cα of Arg-226 shifts 2.2 Å, and the short F′ helix at residues 226–230 is unwound, with residues 227 and 228 adopting an extended β conformation. Conversely, residues 229–233 form a single helical turn compared with residues 231–233 in the C3S-bound structure, which are extended. The F-G regions of the two structures converge at Gly-235 at the N terminus of the G helix. The overall deviation for all Cα atoms of the THP- and C3S-bound structures is 1.01 Å. The rearrangements in the THP structure afford alternate packing interactions for residues of the β1–1 and β1–2 strands, Leu-229 and Phe-232, with the J-helix and the C-terminal strand of a symmetry related molecule, accounting for the change in space group.
Compared with the substrate-free structure, the THP-bound structure exhibits a similar compression of the F- and G-helices and B′-C loop as occurs upon binding of C3S (12) (Fig. 5C). Phe-80 and Arg-226 become reoriented as well, and in addition, the Thr-306 hydroxyl flips to hydrogen bond to the THP imidazole. We used the T306A mutant to evaluate how elimination of this hydrogen bond affects the strength of drug binding to CYP46A1. Quite unexpectedly, the Kd decreased 5-fold to a 10 nm value (Table 2), indicating a higher affinity. A possible explanation for such an effect would be a rotation of Glu-305 into the active site in the T306A mutant to form a stronger hydrogen bond with imidazole nitrogen than occurs with the Thr-306 hydroxyl in the wild type. Alternate positioning of the homologous glutamate on the I-helix in CYP2B4 (Glu-301) to hydrogen bond with imidazole is seen in the structures of CYP2B4 in complex with 4-CPI versus1-CPI (31). THP binding also induces movement of the B′-C loop that repositions Leu-112 and Phe-121 to contact THP and leads to an ∼2.0 Å shift of Trp-368 on the β1–3 strand to contact the cyclohexyl ring. The Glu-305 side chain also swings partially toward the active side to hydrogen bond to both the Thr-306 and Thr-475 hydroxyls, positioning these side chains for favorable interactions with THP. Thus, similar to C3S, tight binding of THP likely arises from the collapse of the active site around the drug, exclusion of all solvent except for three ordered H2O molecules, and multiple electrostatic and hydrophobic interactions with all portions of the inhibitor molecule. The ability of the active site residues to undergo conformational changes and in particular the rearrangement of the β1–1-β1–2 and F-G loops bringing Phe-80 and Arg-226 into the active site results in a high degree of complementarity between the THP and the active site and high occupancy of the active site volume (92%) as compared with other inhibitors (Table 2).
Binding of VOR to CYP46A1
VOR (Mr = 349) is an example of a branched CYP46A1 inhibitor that has two chiral carbon atoms, C2 and C3, and three aromatic rings (Fig. 1). Binding of VOR to CYP46A1 elicited an incomplete, as compared with TCP and THP, type II spectral shift with λmax at 423 nm in the absolute spectrum and a trough at 412 nm and peak at 431 nm in the difference spectrum (Fig. 2D). Also, the spectral Kd of VOR for CYP46A1 was higher than those for TCP and THP, and VOR did not completely inhibit cholesterol 24-hydroxylation in the enzyme assay (Table 2). The VOR-P450 complex crystallized in space group I41 with two molecules in the asymmetric unit (Table 1). Both CYP46A1 copies have strong density for VOR and are very similar (r.m.s.d. for Cα atoms 0.43 Å). The 2R,3R-stereoisomer was unambiguously modeled into the 2.35 Å resolution unbiased electron density in the CYP461 active site (Fig. 3).
Molecule B, which has a slightly lower B factor for VOR (42.4 versus 44.8 Å2), will be used for the description of the VOR-CYP46A1 crystal structure. The VOR triazole ring is almost perpendicular to the heme plane and ligated to iron (Fe-N8 bond 2.11 Å) (Fig. 6, A and B). The ring is wedged between the side chains of Ala-302 and Thr-306 by short van der Waals contacts in a manner similar to the azole ring of THP, except that in the VOR complex the side chain of Thr-306 is not flipped as in the THP complex and adopts a conformation as in the TCP complex, i.e. the Thr-306 hydroxyl hydrogen bonds with a H2O molecule 629 in the groove of the I helix and the methyl group is in contact with N7 of the triazole. The VOR phenyl and pyrimidinyl rings occupy the upper portion of the active site cavity and are flanked by nine amino acid residues, all within 4 Å (Tyr-109, Leu-112, Phe-121, Val-126, Ser-127, Leu-219, Ile-222, Ala-474, and Thr-475). The VOR methyl group is also in close contact with Ala-367. In addition to these hydrophobic contacts, a fluorine atom in the VOR phenyl ring forms an anion-π interaction with Phe-121 (Fig. 6B). Hence, the VOR aromatic rings are tightly constrained on the side of the active site cavity near the I helix. The opposite side of the active site facing the β1–3 strand is occupied with six ordered H2O molecules (605, 610, 614, 615, 617, and 644) that form hydrogen-bonding interactions that bridge the Pro-366 carbonyl, Trp-368 amide, Gly-369 amide and carbonyl, Arg-226, Tyr-109, and the heme propionate A (Fig. 6, A and B). This H2O network fills the remainder of the volume in the active site not occupied by the drug (Fig. 6B). VOR participates in this network with hydrogen bonds involving its hydroxyl with a H2O molecule 617 and the pyrimidinyl fluorine atom with H2O molecules 605 and 644 (Fig. 6A). Consequently, the overall interaction of VOR in the CYP46A1 active site is amphipathic. As in the case with TCP and THP, binding of VOR induces conformational changes in the protein. The side chains of Leu-112 and Ile-222, the hydroxyl group in Ser-127, and the phenyl ring in Phe-121 each adjust to accommodate VOR binding (Fig. 6B). These conformational changes do not significantly reduce the volume of the active site but alter its shape and increase complementarity for VOR.
FIGURE 6.

Views of the CYP46A1 active site illustrating interactions with VOR. A, shown are residues in contact with VOR and a network of bound H2O molecules. Portions of the secondary structure are also shown. B, superposition of VOR-bound (pale green) and ligand-free (wheat) structures show the active site volumes and conformational changes that accommodate binding of the VOR molecule. The heme group in VOR-bound and ligand-free CYP46A1 is in warm pink and red, respectively, and VOR is in light pink. The nitrogen, oxygen, iron, and fluorine atoms are in blue, red, orange, and light blue, respectively. H2O molecules are shown as red spheres. Dashed black lines indicate hydrogen bonds. The solvent-occupied surface of the active site is shown in green mesh in VOR-bound CYP46A1 and a wheat surface in ligand-free P450.
Determinants of VOR Binding to CYP46A1 as Compared with TCP and THP Binding
Although binding weaker than TCP and THP, VOR has a Kd value in the intermediate nanomolar range (Table 2). This affinity reflects optimal geometry of the N-Fe bond, numerous hydrophobic and polar interactions, and tight restraints on the inhibitor phenyl and pyrimidinyl rings. VOR displaces fewer H2O molecules from the active site than THP (6 and 3 ordered H2O molecules, respectively), and this incomplete displacement likely contributes in part to a weaker VOR binding, i.e. a less favorable entropic effect. The difference in water displacement is reflected in 69 and 92% occupancy of the active site volume by VOR and THP, respectively (Table 2), and in turn suggests greater mobility for VOR. This greater mobility is consistent with relative B-factors; in the VOR complex they are roughly twice that of the heme, whereas in the THP complex where they are nearly equal to the heme (Table 1). If less constrained binding contributes to a higher Kd, it would explain weaker binding of VOR to the T306A mutant (Table 2); the T306A substitution removes a van der Waals contact that otherwise constrains the position of the triazole. Another factor accounting for lower binding affinity of VOR is the nature of the nitrogen ligand. VOR is the only inhibitor in this study that has the 1,2,4-triazole group. The ligating nitrogen in the triazole ring has reduced electronegativity and would be expected to provide a weaker coordinate covalent bond to iron. Reduced electron donation ability of the triazole may also account in part for a smaller red shift in CYP46A1. To test the latter, we titrated the enzyme with fluconazole, a related drug from which VOR was derived (Fig. 1). Although fluconazole induced a larger red shift than VOR, it was still smaller than those observed with TCP and THP (at 425 versus 427 nm) (Table 2). Incomplete red shifts with VOR and fluconazole suggest that the triazole ring indeed contributes to a spectral response in CYP46A1. The smaller size of fluconazole versus VOR and, hence, greater potential degrees of freedom in the active site is also consistent with its ∼40-fold higher Kd compared with VOR and weaker CYP46A1 inhibition under the experimental conditions used (Table 2).
Binding of CLO to CYP46A1
CLO (Mr = 345) is the bulkiest of the four inhibitors examined in the present study. The drug has a tetrahedral carbon atom containing four aromatic substitutions (one imidazole and three phenyl rings) (Fig. 1). This spatial organization produces a weather cock-type structure with the phenyl rings acting as the blades. CLO elicits a small red shift of 4 nm of the CYP46A1 λmax with the trough and peak in the difference spectrum being at 410 and 429 nm, respectively (Fig. 2E). The spectral Kd of CLO is in the low nanomolar range; however, the drug does not completely inhibit CYP46A1 in the enzyme assay (Table 2). CLO-bound CYP46A1 crystallized in the I41 space group with two molecules in the asymmetric unit. The electron density for CLO in both copies is well defined for all four rings including the unique chlorine atom (Fig. 3). Molecule B has a lower B-factor (Table 1) and will be used for the description of the CLO-bound CYP46A1 structure. CLO binds to the active site in a single orientation that places its imidazole ring closest to the heme group (Fig. 7, A and B). The ring plane is inclined 56° to the plane of the heme macrocycle, whereas the distance between the imidazole nitrogen and heme iron is 4.01 Å (Fig. 7A). There is no significant density for a water molecule between the CLO nitrogen and heme iron. In fact, a H2O bound ∼2.0 Å above the iron would have a steric clash with the imidazole (H2O-N distance ∼2.3 Å). Thus, in contrast to TCP, THP, and VOR, CLO does not coordinate the heme iron in CYP46A1 yet displaces the coordinating H2O molecule present in the ligand-free CYP46A1 form (12). Such a mode of binding, the presence of the imidazole nitrogen in the vicinity of the heme iron when there is no sixth aqua ligand, may explain why CLO-bound CYP46A1 exhibits only a 4-nm red shift of its λmax in solution (Table 2). The lack of direct heme coordination also explains incomplete inhibition of the CYP46A1 activity under the experimental conditions used and is consistent with the relatively high B-factors for CLO (Table 1).
FIGURE 7.

Views of the CYP46A1 active site illustrating interactions with CLO. A, residues in contact with CLO are shown. B, superposition of CLO-bound (violet) and ligand-free (wheat) CYP46A1 structures shows the solvent-occupied surface of the active site in CLO-bound CYP46A1 and residues undergoing conformational changes upon CLO binding. The heme group in CLO-bound and ligand-free CYP46A1 is in salmon and red, respectively, and CLO is in gray. The nitrogen, oxygen, sulfur, iron, and chlorine atoms are in blue, red, yellow, orange, and green, respectively. H2O molecules are shown as red spheres. Dashed black lines indicate hydrogen bonds, and the dashed gray line connects the VOR nitrogen and heme iron showing the distance between the two atoms.
Of the four inhibitors used in the present study, CLO is the most hydrophobic. The log p value of CLO is 6.1, whereas those of TCP, THP, and VOR are 1.4, 2.67, and 1.0, respectively (Table 2). Consistent with the hydrophobic nature of CLO, the contacts between the drug and CYP46A1 in the crystal structure are exclusively nonpolar. The imidazole group is surrounded by the propionate A side chain, and the side chains of Val-126, Ala-302, Thr-306, and Ala-367 (3.6–4.4 Å contacts). The three phenyl rings are packed between Tyr-109, Leu-112, Phe-121, Val-126, Leu-219, Ile-222, Thr-298, Ile-301, Ala-302, Glu-305, Ala-474, and Thr-475, forming many van der Waals contacts with the drug (Fig. 7A). Two H2O molecules (600 and 619) interact with polar residues at the entrance to the active site (Arg-226) or in the BC loop (Ser-127, Thr-298). The involvement of Thr-298 and Glu-305 in contacts with the inhibitor is unique to the CLO-bound structure and consistent with the bulkiness of CLO (323 Å3; Table 2). Compared with THP and VOR, which are similar sized ligands, binding of CLO is associated with very little conformational adjustment in the active site (Fig. 7B; r.m.s.d. for Cα atoms 0.27 Å), whereas 74% of the available volume is used (Table 2). The absence of conformation change coupled with the large number of hydrophobic interactions likely determines the very tight binding affinity of CLO for CYP46A1.
CLO-bound CYP46A1 Structure Is Not an Artifact of Crystallization
In the crystal structure CLO cannot coordinate to the heme iron because the side chains of Val-126, Ala-302, and Thr-306, which are positioned around the periphery of the heme and in contact with CLO, prevent the bulky inhibitor from moving closer. At the same time, the positions of these residues relative to the heme is essentially unchanged (except for side chain torsional rotations) in all six available CYP46A1 structures (PDB codes 2Q9F and 2Q9G, Table 1). Assuming that this remains the case for CLO binding in solution, then an increase in temperature and increased thermal motion of CYP46A1 might permit CLO to bypass the hindering residues and coordinate the heme via imidazole ring. The latter will be reflected in the shift of the λmax of CLO-bound CYP46A1 to a longer wavelength. Indeed, increasing the solution temperature from 18 to 37 °C led to a shift in the λmax of CLO-bound CYP46A1 from 422 to 424 nm followed by protein precipitation (Fig. 2E). Control experiments with the ligand-free, TCP-, THP-, or VOR-bound CYP46A1 did not detect any spectral shifts or protein precipitation (Fig. 2, A–D).
Due to its 4.0 Å distance and offset position from the heme iron, CLO could in principle be a substrate. In fact, 180° rotation of the imidazole places the adjacent aromatic carbon atom nearer the heme iron and fits the electron density equally well (data not shown); this orientation of the imidazole also has no preferential interactions for the nitrogen atom. This rationale served as a basis for enzyme assay experiments with CLO as a substrate. Incubations were carried out at 25 and 37 °C. The mass spectrum of the extract from the 25 °C incubation showed two prominent peaks, one at m/z 344.99 corresponding to the [M+H+]+ ion of CLO and the other peak at m/z 277.28 corresponding to the triphenyl fragment ion of CLO lacking the imidazole moiety (Fig. 8A). This fragmentation pattern was very similar to that of CLO itself (data not shown). The mass spectrum of the incubation at 37 °C also had these two prominent peaks and in addition a peak at m/z 360.85, which is consistent with the hydroxylation product of CLO [M+16+H+]+ (Fig. 8B). The peak at m/z 360.85 was not present in the control incubations when NADPH was omitted or proteins were boiled before the addition of NADPH (data not shown). MS/MS of this peak showed a prominent peak at m/z 277.03 and small peak at m/z 292.92 (Fig. 8C). This fragmentation pattern suggests that there may be two sites of hydroxylation; one site is on one of the triphenyl rings, and the other site is on the imidazole ring. The peak at m/z 292.92 is consistent with the hydroxylated triphenyl fragment lacking imidazole moiety, and the peak at m/z 277.03 represents either the hydroxylated triphenyl fragment that lost the hydroxyl group or the triphenyl fragment that lacks the hydroxylated imidazole ring. Unfortunately, we could not detect the imidazole moiety under the ESI conditions used and, thus, directly confirm the hydroxylation of the imidazole ring. Yet, we can unambiguously demonstrate by MS that CLO is indeed hydroxylated by CYP46A1 at 37 °C.
FIGURE 8.

Mass spectra of the extracts from the incubations of CYP46A1 with CLO at 25 °C (A) and 37 °C (B). C, the MS/MS of the peak at m/z 360.85 in B is shown.
We also tested whether replacement of one of the residues that prevents CLO from closer approach to the heme induces a classical type II spectral shift in CYP46A1. Consistent with the structural data, λmax of the CLO-bound T306A mutant was 425 nm at 18 °C, indicating the coordination of the heme iron, and shifts of λmin and λmax in the difference spectrum were also in the right direction. This effect of the T306A mutation on CLO-induced spectral shift in CYP46A1 as well as the temperature dependence of the spectral assay and catalytic properties of the wild type CYP46A1 complexed with CLO suggests that CLO is indeed located at a distance from the heme iron in solution and that the crystal structure of CLO-bound CYP46A1 accurately captures this binding mode.
DISCUSSION
In the present study we investigated how structurally distinct inhibitors that are also therapeutic agents bind to CYP46A1. Four drug co-complexes have been crystallized, and x-ray structures of TCP-, THP-, VOR-, and CLO-bound CYP46A1 were determined. The inhibitors used span a range of molecular sizes, shapes, and iron-coordinating moieties. In the TCP, VOR, and CLO complexes inhibitor binding does not induce large conformational changes in the P450 but is limited to the localized shifts in the protein backbone and side chains. In the THP complex larger scale rearrangement occurs in loops at the entrance to the active site. For the TCP and THP complexes, these shifts significantly reduce the volume of the active site, and in all cases they improve complementarity to the inhibitor molecule. Conformational changes are specific to each inhibitor and do not involve all active site residues. However, collectively, residues that readjust in the four inhibitor complexes encompass every structural element that forms the CYP46A1 active site. Accordingly, the unusual ability of the endobiotic-metabolizing P450 to bind molecules of different size and shape arises from the plasticity of the CYP46A1 active site and supporting secondary structural elements. However, the conservation of structure directly adjacent to the heme, where catalysis of cholesterol takes place, also imposes limits on the binding of substrates, as indicated by the CLO complex. Overall, the data on spectral Kd, enzyme inhibition, and effect of the Thr-306 mutation and crystal structures are mutually consistent.
CYP46A1 crystal structures show that each inhibitor complex has a distinct feature. The structure with TCP reveals that its primary amine not only coordinates the heme iron but also provides a hydrogen bond to the carbonyl of Ala-302. Only two P450s, CYP2A6 and CYP130, have been crystallized so far in complex with a primary amine that coordinates the heme iron (30, 32). Like TCP, the coordinating amino group in these structures forms a hydrogen bond, and the bond is with the same residue, Ala or Gly, from the conserved helix I (A/G)XXXT motif. Thus, three different P450s have an analogous pattern of hydrogen bonding to three different primary amines and utilize a conserved residue. This similar mode of bonding indicates that there may be a general mechanism whereby primary amines interact with P450s, provided they can access the heme iron. Indeed, donation of a hydrogen bond increases the nucleophilicity of the ligating nitrogen and should facilitate its coordination of the heme iron. TCP is a marketed drug and a potent antidepressant, but its use is limited to special indications due to side effects and dietary restrictions (33). Interaction of this monoamine oxidase inhibitor with the P450 enzymes has never been evaluated by x-ray crystallography; we provide the first structural characterization of a TCP-P450 complex and delineate how this very small drug can bind so tightly to a P450 enzyme.
A distinct feature of THP binding is five hydrogen bonds with the CYP46A1 side chains involving three functionalities in the inhibitor molecule that have a potential for such interactions. Such optimal interaction with the protein reflects a good complementarity fit to the active site and may originate from a distant similarity of THP and cholesterol. Structural similarity to cholesterol could explain why, of the four inhibitors, THP occupies the highest fraction of the active site (0.92) followed by CLO (0.74), VOR (0.69), and TCP (0.47). THP belongs to the first generation of the H3 receptor antagonists that held promise in the 1980s but never entered the market because they were all imidazole-containing compounds and inhibited drug-metabolizing P450s (34). Undesired interactions with P450s diminished enthusiasm for imidazole-containing H3-receptor ligands, although they are still being developed (35, 36). THP has never been crystallized in complex with any protein including a P450 enzyme. Therefore, characterization of its binding to CYP46A1 is of value to those who continue to develop imidazole-containing H3 receptor antagonists to have a diminished affinity for P450s.
A network of five H2O molecules evenly distributed and spaced along one side of the active site above the heme propionate A group represents a distinct feature of VOR-bound CYP46A1. This H2O array probably plays several roles in the inhibitor interactions with CYP46A1. First, it occupies the space in the active site unfilled by VOR and thereby limits VOR motion. Second, this network strengthens VOR binding to CYP46A1 by bridging two of its polar moieties to the propionate A carboxyl. Third, two hydrogen bonds donated by the H2O molecules from this array to the heme may account at least in part for a smaller, as compared with TCP and THP, VOR-induced red shift in CYP46A1. This could also be due to the reduced electronegativity of the triazole as a ligand. VOR is a systemic drug designed to specifically inhibit fungal sterol 14α-demethylases, which belong to the family of CYP51 enzymes. It is a second generation derivative of fluconazole with enhanced potency and spectrum of activity (37). Unfortunately, VOR has a much high affinity for CYP46A1 than fluconazole (Table 2) and inhibits cholesterol 24-hydroxylation in vivo (13). None of the P450 enzymes including CYP51 have yet been crystallized in complex with VOR, although crystal structures of ketoconazole- and econazole-bound human CYP51 have recently been reported (38). Binding of VOR to CYP46A1 involves wedging of its triazole ring into the conserved helix I and incomplete displacement of the active site water molecules, and this could be a general mechanism whereby VOR interacts with other P450 enzymes. Thus, the significance of the first structural characterization the P450-VOR complex extends beyond the studies of CYP46A1. This crystal structure should aid in the design of more specific CYP51 inhibitors with reduced propensity to bind other P450s.
A distinct feature of CLO binding is a lack of a coordinate bond with the heme iron because the drug cannot approach the heme macrocycle closer than 4 Å. A sixth water ligand is, however, displaced in the CLO-CYP46A1 structure. This indirect binding mode is consistent with the constrained architecture of the active site and rationalizes a very small red shift of the CYP46A1 λmax elicited by CLO. CLO-bound structure of CYP46A1 demonstrates that alternative binding modes are possible for azole inhibitors should steric constraints prevent direct heme coordination by the drug. The lack of the heme ligation suggested that CLO could be a substrate for CYP46A1, which was confirmed by analyzing incubations of CYP46A1 with CLO by MS as a function of temperature. CLO is a topical drug, and its metabolism by CYP46A1 is not of clinical relevance. The significance of this structure is that it shows for the first time that type II ligands do not necessarily need to coordinate the heme iron to inhibit P450s. This is also the first structure demonstrating how a type II ligand could simultaneously be a P450 substrate.
In summary, the four drug complexes illustrate the versatility of CYP46A1 in binding of nitrogen-containing compounds while also revealing the importance of conserved residues closest to the heme. Different binding modes described in the present study enhance our understanding of how P450 enzymes could be inhibited by nitrogen-containing pharmaceuticals and contribute to more accurate in silico modeling. This knowledge will ultimately lead to more selective marketed drugs.
Supplementary Material
Acknowledgments
We thank Dr. M. Shimoji for generating the T306A CYP46A1 mutant. Portions of this research were carried out at the Stanford Synchrotron Radiation Lightsource (SSRL), a national user facility operated by Stanford University on behalf of the United States Department of Energy, Office of Basic Energy Sciences. The SSRL Structural Molecular Biology Program is supported by the Department of Energy, Office of Biological and Environmental Research, by the National Institutes of Health, National Center for Research Resources, Biomedical Technology Program, and by the NIGMS. We are grateful to the SSRL staff for generous support.
This work was supported in part by United States Public Health Service Grants GM62882 and AG024336 (to I. A. P). This work was also supported in part by National Institutes of Health Grant T32 EY07157 (an NEI predoctoral research training fellowship from the Visual Sciences Training Program, to C. C.).

The on-line version of this article (available at http://www.jbc.org) contains supplemental Figs. S1.
The atomic coordinates and structure factors (codes 3MDM, 3MDR, 3MDT, and 3MDV) have been deposited in the Protein Data Bank, Research Collaboratory for Structural Bioinformatics, Rutgers University, New Brunswick, NJ (http://www.rcsb.org/).
- CYP46A1
- cytochrome P450 46A1
- TCP
- tranylcypromine
- THP
- thioperamide
- VOR
- voriconazole
- CLO
- clotrimazole
- SSRL
- Stanford Synchrotron Radiation Lightsource
- C3S
- cholesterol 3-sulfate
- r.m.s.d.
- root mean square.
REFERENCES
- 1.Lütjohann D., Breuer O., Ahlborg G., Nennesmo I., Sidén A., Diczfalusy U., Björkhem I. (1996) Proc. Natl. Acad. Sci. U.S.A. 93, 9799–9804 [DOI] [PMC free article] [PubMed] [Google Scholar]
- 2.Björkhem I., Lütjohann D., Diczfalusy U., Ståhle L., Ahlborg G., Wahren J. (1998) J. Lipid Res. 39, 1594–1600 [PubMed] [Google Scholar]
- 3.Lund E. G., Guileyardo J. M., Russell D. W. (1999) Proc. Natl. Acad. Sci. U.S.A. 96, 7238–7243 [DOI] [PMC free article] [PubMed] [Google Scholar]
- 4.Meaney S., Bodin K., Diczfalusy U., Björkhem I. (2002) J. Lipid Res. 43, 2130–2135 [DOI] [PubMed] [Google Scholar]
- 5.Xie C., Lund E. G., Turley S. D., Russell D. W., Dietschy J. M. (2003) J. Lipid Res. 44, 1780–1789 [DOI] [PubMed] [Google Scholar]
- 6.Lund E. G., Xie C., Kotti T., Turley S. D., Dietschy J. M., Russell D. W. (2003) J. Biol. Chem. 278, 22980–22988 [DOI] [PubMed] [Google Scholar]
- 7.Kotti T. J., Ramirez D. M., Pfeiffer B. E., Huber K. M., Russell D. W. (2006) Proc. Natl. Acad. Sci. U.S.A. 103, 3869–3874 [DOI] [PMC free article] [PubMed] [Google Scholar]
- 8.Halford R. W., Russell D. W. (2009) Proc. Natl. Acad. Sci. U.S.A. 106, 3502–3506 [DOI] [PMC free article] [PubMed] [Google Scholar]
- 9.Hudry E., Van Dam D., Kulik W., De Deyn P. P., Stet F. S., Ahouansou O., Benraiss A., Delacourte A., Bougnères P., Aubourg P., Cartier N. (2010) Mol. Ther. 18, 44–53 [DOI] [PMC free article] [PubMed] [Google Scholar]
- 10.Russell D. W., Halford R. W., Ramirez D. M., Shah R., Kotti T. (2009) Annu. Rev. Biochem. 78, 1017–1040 [DOI] [PMC free article] [PubMed] [Google Scholar]
- 11.Mast N., Norcross R., Andersson U., Shou M., Nakayama K., Bjorkhem I., Pikuleva I. A. (2003) Biochemistry 42, 14284–14292 [DOI] [PubMed] [Google Scholar]
- 12.Mast N., White M. A., Bjorkhem I., Johnson E. F., Stout C. D., Pikuleva I. A. (2008) Proc. Natl. Acad. Sci. U.S.A. 105, 9546–9551 [DOI] [PMC free article] [PubMed] [Google Scholar]
- 13.Shafaati M., Mast N., Beck O., Nayef R., Heo G. Y., Björkhem-Bergman L., Lütjohann D., Björkhem I., Pikuleva I. A. (2010) J. Lipid Res. 51, 318–323 [DOI] [PMC free article] [PubMed] [Google Scholar]
- 14.Pikuleva I. A. (2006) Pharmacol. Ther. 112, 761–773 [DOI] [PubMed] [Google Scholar]
- 15.Dawson J. H., Andersson L. A., Sono M. (1982) J. Biol. Chem. 257, 3606–3617 [PubMed] [Google Scholar]
- 16.Hlavica P. (2006) Biochim. Biophys. Acta 1764, 645–670 [DOI] [PubMed] [Google Scholar]
- 17.Copeland R. A. (2000) Enzymes (Copeland R. A. ed) 2nd Ed., pp 76–108, John Wiley & Sons, Inc., New York [Google Scholar]
- 18.Soltis S. M., Cohen A. E., Deacon A., Eriksson T., González A., McPhillips S., Chui H., Dunten P., Hollenbeck M., Mathews I., Miller M., Moorhead P., Phizackerley R. P., Smith C., Song J., van dem Bedem H., Ellis P., Kuhn P., McPhillips T., Sauter N., Sharp K., Tsyba I., Wolf G. (2008) Acta Crystallogr. D Biol. Crystallogr. 64, 1210–1221 [DOI] [PMC free article] [PubMed] [Google Scholar]
- 19.Leslie A. G. (1999) Acta Crystallogr. D Biol. Crystallogr. 55, 1696–1702 [DOI] [PubMed] [Google Scholar]
- 20.Collaborative Computational Project, Number 4 (1994) Acta Crystallogr. D Biol. Crystallogr. 50, 760–76315299374 [Google Scholar]
- 21.McCoy A. J., Grosse-Kunstleve R. W., Adams P. D., Winn M. D., Storoni L. C., Read R. J. (2007) J. Appl. Crystallogr. 40, 658–674 [DOI] [PMC free article] [PubMed] [Google Scholar]
- 22.Murshudov G. N., Vagin A. A., Dodson E. J. (1997) Acta Crystallogr. D Biol. Crystallogr. 53, 240–255 [DOI] [PubMed] [Google Scholar]
- 23.Brünger A. T., Adams P. D., Clore G. M., DeLano W. L., Gros P., Grosse-Kunstleve R. W., Jiang J. S., Kuszewski J., Nilges M., Pannu N. S., Read R. J., Rice L. M., Simonson T., Warren G. L. (1998) Acta Crystallogr. D Biol. Crystallogr. 54, 905–921 [DOI] [PubMed] [Google Scholar]
- 24.Strong M., Sawaya M. R., Wang S., Phillips M., Cascio D., Eisenberg D. (2006) Proc. Natl. Acad. Sci. U.S.A. 103, 8060–8065 [DOI] [PMC free article] [PubMed] [Google Scholar]
- 25.Painter J., Merritt E. A. (2006) Acta Crystallogr. D Biol. Crystallogr. 62, 439–450 [DOI] [PubMed] [Google Scholar]
- 26.Kleywegt G. J., Jones T. A. (1994) Acta Crystallogr. D Biol. Crystallogr. 50, 178–185 [DOI] [PubMed] [Google Scholar]
- 27.Poulos T. L., Howard A. J. (1987) Biochemistry 26, 8165–8174 [DOI] [PubMed] [Google Scholar]
- 28.See R. F., Kruse R. A., Strub W. M. (1998) Inorg. Chem. 37, 5369–5375 [Google Scholar]
- 29.Balding P. R., Porro C. S., McLean K. J., Sutcliffe M. J., Maréchal J. D., Munro A. W., de Visser S. P. (2008) J. Phys. Chem. A 112, 12911–12918 [DOI] [PubMed] [Google Scholar]
- 30.Yano J. K., Denton T. T., Cerny M. A., Zhang X., Johnson E. F., Cashman J. R. (2006) J. Med. Chem. 49, 6987–7001 [DOI] [PubMed] [Google Scholar]
- 31.Zhao Y., Sun L., Muralidhara B. K., Kumar S., White M. A., Stout C. D., Halpert J. R. (2007) Biochemistry 46, 11559–11567 [DOI] [PMC free article] [PubMed] [Google Scholar]
- 32.Podust L. M., Ouellet H., von Kries J. P., de Montellano P. R. (2009) J. Biol. Chem. 284, 25211–25219 [DOI] [PMC free article] [PubMed] [Google Scholar]
- 33.Frieling H., Bleich S. (2006) Eur. Arch. Psychiatry Clin. Neurosci. 256, 268–273 [DOI] [PubMed] [Google Scholar]
- 34.Celanire S., Wijtmans M., Talaga P., Leurs R., de Esch I. J. (2005) Drug Discov. Today 10, 1613–1627 [DOI] [PubMed] [Google Scholar]
- 35.Łazewska D., Wiecek M., Ligneau X., Kottke T., Weizel L., Seifert R., Schunack W., Stark H., Kieć-Kononowicz K. (2009) Bioorg. Med. Chem. Lett. 19, 6682–6685 [DOI] [PubMed] [Google Scholar]
- 36.Berlin M., Ting P. C., Vaccaro W. D., Aslanian R., McCormick K. D., Lee J. F., Albanese M. M., Mutahi M. W., Piwinski J. J., Shih N. Y., Duguma L., Solomon D. M., Zhou W., Sher R., Favreau L., Bryant M., Korfmacher W. A., Nardo C., West R. E., Jr., Anthes J. C., Williams S. M., Wu R. L., Susan She H., Rivelli M. A., Corboz M. R., Hey J. A. (2006) Bioorg. Med. Chem. Lett. 16, 989–994 [DOI] [PubMed] [Google Scholar]
- 37.Sabo J. A., Abdel-Rahman S. M. (2000) Ann. Pharmacother. 34, 1032–1043 [DOI] [PubMed] [Google Scholar]
- 38.Strushkevich N., Usanov S. A., Park H. W. (2010) J. Mol. Biol. 397, 1067–1078 [DOI] [PubMed] [Google Scholar]
Associated Data
This section collects any data citations, data availability statements, or supplementary materials included in this article.