

Abstract
Under normal viewing conditions, the image on the retina is always in motion. Images fade and may eventually disappear when the physiological motion of the retinal stimulus is reduced or eliminated. According to a widespread theory, microsaccades are responsible for maintaining visibility during fixation. However, while it is clear that the sudden changes in visual input caused by microsaccades are sufficient to restore visibility, it has long been questioned whether this effect might be an epiphenomenon, rather than an important function of microsaccades. In this study, we compared the eye movements measured under conditions that either simulated or induced loss of visibility to those recorded when fading did not occur. Both drifts and microsaccades were unaffected by changes in the stimulus contrast and bandwidth that recreated the percept experienced during image fading. Under retinal stabilization, a condition in which observers reported fading, microsaccade rates decreased, instead of increasing as predicted by the fading prevention hypothesis. While image fading had no influence on oculomotor activity, eye movements were instead strongly modulated by the onset of the stimulus and by the requested precision of fixation. Microsaccades occurred more frequently and were more corrective for preceding drifts during accurate fixation on a cue than during relaxed fixation on a region of the screen. These results do not support a causal relationship between image fading and microsaccade production and show that the precision of required fixation is a major contributor to microsaccades.
Keywords: Troxler's fading, filling-in, microsaccade, ocular drift, retinal stabilization
Introduction
During natural viewing, small eye movements and movements of the head and body keep the stimulus on the retina always in motion. It has long been known that percepts tend to fade when the physiological motion of the retinal image is attenuated. Fading of dim peripheral stimuli is often experienced during steady and prolonged fixation, an effect first described by Troxler in 1804 (Komatsu, 2006). The image appears to gradually lose contrast and eventually disappears during strict fixation, until a change in the visual input caused by eye movements, blinks, or stimulus motion temporarily revives the percept. More substantial fading is experienced when stimuli are observed in the absence of retinal image motion, a laboratory condition known as retinal stabilization (Ditchburn & Ginsborg, 1952; Riggs & Ratliff, 1952; Yarbus, 1967). Although controversies remain regarding whether or not perfectly stabilized images disappear completely (Arend & Timberlake, 1986; Ditchburn, 1987), it is clear that contrast sensitivity is reduced when observing a fixed retinal stimulus for a period of several seconds or minutes (Kelly, 1979; Koenderink, 1972; Tulunay-Keesey, 1982). Perhaps the most striking example of perceptual fading is given by the extremely fast disappearance of entoptic images, stimuli that are perfectly immobile on the retina. The shadows of retinal vessels can be readily seen when a moving pinhole light is shone in front of the eye, but they disappear very quickly when the light stops moving (Coppola & Purves, 1996).
Image fading has been commonly held as an explanation for the existence of fixational eye movements. According to this theory, microscopic eye movements are necessary in order to refresh neuronal responses and prevent the disappearance of a stationary scene. It was originally hypothesized by Ditchburn, Fender, and Mayne (1959) that microsaccades, the small saccades that separate periods of drifts, might play a prominent role in maintaining visibility. These authors noted that the visibility of a stabilized stimulus was immediately restored by moving the stimulus in a way that replicated the visual input changes caused by microsaccades. In contrast, visibility did not improve when drift-like motion was superimposed to a stabilized stimulus. On the basis of these results, Ditchburn et al. (1959) argued that microsaccades are effective in restoring image visibility, whereas drifts are not. Since it is known that experienced observers can suppress microsaccades during strict fixation (Steinman, Cunitz, Timberlake, & Herman, 1967), this proposal is consistent with the hypothesis that Troxler's fading might be a consequence of a reduction in microsaccades. This view has recently received support by the finding that, during viewing of low-contrast peripheral stimuli, microsaccades tend to be more frequent before transitions to visibility and less frequent before periods of fade-out (Martinez-Conde, Macknik, Troncoso, & Dyar, 2006).
While the previous results support an important role for microsaccades in preventing image fading, other studies have yielded conflicting results. Cornsweet (1956) examined eye movements under retinal stabilization and reported that the rates of neither microsaccades nor drifts appear to be correlated with the occurrence of perceptual fading. Gerrits and Vendrik (1970) precisely controlled the retinal motion of an otherwise stabilized stimulus by using a small electric motor mounted on a contact lens. In contrast with previous reports, these authors found that continuous, drift-like motion was more effective than sudden, microsaccade-like changes for preserving visual perception. Microsaccades also tend to occur rarely during tasks that involve high-visual acuity, and yet fading does not seem to interfere (Bridgeman & Palca, 1980; Winterson & Collewijn, 1976). In summary, while it appears well established that microsaccades are sufficient to revive a faded percept, it has remained an open question whether “fading prevention might just be an incidental, if not accidental role of microsaccades” (Nachmias, 1961).
This study further examines the relation between visual fading and oculomotor activity. To determine whether image fading influences the pattern of fixational instability, we recorded and analyzed eye movements under several conditions in which stimulus visibility decreased or increased. In the following sections, we describe the results of experiments in which fading was either induced by suppressing retinal image motion or simulated by properly manipulating the stimulus.
Methods
The data presented in this study were collected in three experiments, which separately examined the effects of (1) changing the contrast of the stimulus, (2) varying its frequency content, and (3) eliminating retinal image motion. This section focuses on the methods that are novel to this study. Part of the experimental procedures were described in previous publications and are only briefly summarized here (see Rucci, Iovin, Poletti, and Santini, 2007).
Subjects
Eleven subjects with normal or corrected-to-normal vision took part in the experiments. Ten subjects were naive about the purposes of the study and were paid to participate. The other subject was one of the authors (MP). Informed consent was obtained from all participants following the procedures approved by the Boston University Charles River Campus Institutional Review Board.
Stimuli
Stimuli varied among experiments and conditions. In Experiments 1 and 2, subjects observed full-screen (800 × 600 pixels) movies that simulated the perceptual experience of image fading. A trial started with presentation of a grayscale image of a natural scene (first frame of the movie) and terminated with a homogeneous gray field with intensity equal to the average intensity of the image (last frame of the movie). In each trial, the displayed image was randomly chosen among 60 pictures selected from a public domain database (van Hateren & Ruderman, 1998). The radial mean of the power spectrum of the pool of images was best fit by 1/f2.08, where f is the spatial frequency. The similarity between this estimate and the power spectra measured on larger databases indicates that the selected set of images well represented the statistical characteristics of natural scenes (Field, 1987). Unless otherwise specified, observers maintained fixation on a 5V dot at the center of the screen.
In Experiment 1, the contrast of the image decreased monotonically during the course of a trial, as illustrated in Figure 1a. The image displayed on the screen at time t after trial onset was given by
| (1) |
where (x, y) are the pixel coordinates on the screen, is the average intensity of the image, α is a scalar that regulates the speed of contrast changes, and T = 10 s is the trial duration. The parameter α varied as a function of eccentricity. In order to closely replicate perceptual fading, contrast changes were faster in the periphery than in the center of the visual field, and α varied linearly according to the distance between each pixel and the center of the screen: , where D = 680′ represents the distance between the center (at xc and yc) and the furthermost point in the image. As explained later in this section, these values were chosen empirically by calibrating the stimuli in preliminary experimental sessions, so as to recreate a percept that mimicked as faithfully as possible the dynamics of perceptual fading experienced under retinal stabilization.
Figure 1.

Schematic representation of the stimuli used in this study. Each row represents a different experiment. (a) In Experiment 1, the perceptual experience of image fading was simulated by gradually decreasing the contrast of the image. (b) In Experiment 2, fading was simulated by low-pass filtering the image at progressively lower cut-off frequencies. (c) In Experiment 3, fading was induced by means of retinal stabilization. The image was actively translated on the screen to compensate for the subject's eye movements, so that it remained immobile on the retina. In each row, the left and right panels represent, respectively, the sequence of frames displayed on the monitor and a cartoon of the spectral density of the stimulus. Unless otherwise specified, observers maintained fixation on a dot at the center of the monitor. Examples of the movies shown in Experiments 1 and 2 are available online as Supplementary material.
In Experiment 2, perceptual fading was simulated by manipulating the frequency content of the image, rather than its contrast. As schematically illustrated in Figure 1b, the bandwidth of the stimulus displayed on the monitor was gradually narrowed during each trial, so that the image eventually faded into a uniform background. This effect was obtained by filtering the original image by means of low-pass filters with progressively lower cut-off frequencies (fc) so that only low-spatial frequencies were displayed toward the end of the trial. The cut-off frequency decreased linearly during the course of each trial:
| (2) |
where Fs represents the sampling frequency of the original image (60 cycles/deg), T = 10 s is the trial duration, and β is a parameter that regulates the speed of fading. As in Experiment 1, varied linearly as a function of eccentricity: .
In both experiments, in order to quantify the impact of image fading on oculomotor activity, the eye movements measured when the stimulus varied according to Equations 1 and 2 were compared to those recorded when the temporal order of the displayed stimuli was inverted. In this latter condition, the movies defined by Equations 1 and 2 were played backward so that the last frame of the movie was displayed at the beginning of the trial and the first frame at the end. In this case, visibility increased during the course of the trial, and the image appeared to emerge gradually from a homogeneous gray field.
In both Experiments 1 and 2, the dynamics of image fading were adjusted on the basis of data reported in the literature. During endogenous fading, the velocity at which stimuli disappear typically depends on the contrast of the stimulus (Gonzalez, Weinstock, & Steinbach, 2007). Since our stimuli were natural images, their contrast varied locally within the image. However, it is known that the distribution of contrasts in natural images is highly kurtotic, peaking at low contrast values (Brady & Field, 2000). We, therefore, adjusted the speed of fading on the basis of perceptual measurements with low-to-medium contrast grayscale stimuli. The temporal course of fading also depends on visual eccentricity. Stimuli closer to the fovea require longer time to fade than peripheral stimuli (Lou, 1999; Steinman & Levinson, 1990). In the fovea, low-contrast images tend to disappear after approximately 6 to 10 s (see Barlow, 1963; Ditchburn et al., 1959. See also Figure 9 in Santini, Redner, Iovin, & Rucci, 2007). In the periphery, stimuli can fade within 1–2 s. The parameters of Equations 1 and 2 in our study interpolated these empirical data so that the image faded into a homogeneous field in approximately 3–5 s at 5–8° of eccentricity and within 6–8 s at the center of the visual field. Tuning of these parameters occurred in preliminary experimental sessions in which two subjects compared our time-varying stimuli to the dynamics of endogenous fading experienced under retinal stabilization. The two types of image manipulations of Experiments 1 and 2 yielded qualitatively similar effects. Subjects in our experiments reported that both of them well captured visual fading and were evenly split in judging which one of the two conditions better replicated this perceptual effect.
In Experiment 3, fading was induced by eliminating retinal image motion. As illustrated in Figure 1c, retinal stabilization was achieved by translating the stimulus on the screen under real-time computer control so as to compensate for the eye movements performed by the observer. In this way, the stimulus remained at a fixed position on the retina for the entire duration of the trial. Stimuli consisted of the same images of natural scenes used in Experiments 1 and 2. In this experiment, however, each image was displayed for the entire duration of the trial (10 s) without changing its contrast and/or frequency content. In order to avoid edge effects, the image was observed through a circular Gaussian aperture with diameter of 12°. Unless otherwise specified, subjects maintained fixation on a non-stabilized dot displayed at the center of the monitor. Fading of the image was assessed for each subject during preliminary experimental sessions, in which the subject learned to calibrate the stabilization system. Subjects were also asked if they had perceived fading at the end of each block of trials during the execution of the experiments.
Apparatus
Stimuli were displayed on a fast phosphor CRT monitor (Iyama HM204DT) at a resolution of 800 × 600 pixels and vertical refresh rate of 200 Hz. Subjects were kept at a fixed distance of 126 cm from the monitor by means of a dental imprint bite bar and a head rest, which prevented movements of the head. Stimuli were observed monocularly with the right eye, while the left eye was patched. The contrast of the monitor was adjusted so that, for all subjects, stimulus fading always occurred under retinal stabilization.
Eye movements were continuously recorded by means of a Generation 6 Dual Purkinje Image (DPI) eye tracker (Fourward Technologies). The nominal resolution of this system is about 20″ with a time delay of approximately 0.25 ms (Crane & Steele, 1985). Vertical and horizontal eye position data were sampled at 1 kHz and recorded for subsequent analysis.
Stabilization of the image was obtained by means of EyeRIS, a system that enables flexible gaze-contingent display (Santini et al., 2007). This system processes eye movements in real time and guarantees refresh of the stimulus with a maximum delay equal to the time required to render two frames on the display (10 ms at 200 Hz; typical delay 7.5 ms). Previous analysis of EyeRIS performance has shown that this system stabilizes the retinal image with accuracy higher than 1′ (Rucci et al., 2007).
Procedure
Data were collected in separate experimental sessions, each of approximately 20 min. Every experimental session started with preliminary setup operations that lasted a few minutes and allowed the subject to adapt to the low level of light in the room. These preliminary operations included: (1) positioning the subject optimally and comfortably in the apparatus; (2) tuning the eye tracker; and (3) calibrating EyeRIS, the system for gaze-contingent display that we used to render the stimuli on the monitor. Subjects were never constrained in the experimental setup for more than 30 min consecutively. The same five subjects participated in the main three experiments of this study.
Control experiments were conducted for Experiments 1 and 3 in order to assess the way eye movements were influenced by instructions for fixation. The stimuli used in these controls were identical to those of Experiments 1 and 3. However, instead of maintaining accurate fixation on a dot (Accurate Fixation condition), subjects were asked to keep their gaze at the center of the monitor, and the fixation marker was not shown (Relaxed Fixation condition). An additional control experiment was conducted for Experiment 3 in order to ensure that subjects paid attention to the stimuli. In this experiment, after the presentation of each retinally stabilized image, subjects reported whether or not the image contained an animal. Subjects maintained accurate fixation on an unstabilized 5′ dot. At least two subjects participated in each of these controls.
To convert the eye position measurements given by the eye tracker into screen coordinates, a calibration procedure preceded each block of trials. This calibration consisted of two phases. In the first phase, the subject sequentially fixated on each of the nine points equispaced within the working area of the display. For each point, the mean output voltage from the eye tracker was estimated over a period of 3.5 s. The mapping from eye-position coordinates to degrees of visual angle was determined by bilinear interpolation over the mean eye positions measured at these nine points. This transformation was made possible by virtue of the highly linear behavior of the DPI eye tracker within the central region of the visual field. In the second phase of the calibration procedure, subjects fine-tuned and/or confirmed the gaze-to-pixel mapping. In this phase, subjects controlled the position of a cross, stabilized at the center of gaze and displayed in real time on the screen, while fixating on various locations marked on the screen. Subjects refined the offsets and gains of the calibration by using EyeRIS' joypad.
Eye movements analysis
The maximum amplitude of a microsaccade is a matter of definition, ranging from 5′ to 2° (see Collewijn & Kowler, 2008 for a comprehensive review). In this study, microsaccades were defined as movements with amplitude smaller than 30′ and peak velocity higher than 3°/s. This threshold was selected as the 90th percentile in the distribution of saccades executed by subjects in our experiments while maintaining fixation on a marker (see Figure 7e). Classification of eye movements was performed automatically and then validated and/or refined by human experts. Results identical to those presented in this paper were obtained by changing the maximum amplitude of microsaccades so as to restrict the analysis to saccades smaller than 20′ or to include larger movements. Identical results were also obtained by using a different algorithm for microsaccade detection (Engbert & Kliegl, 2003).
Figure 7.

Characteristics of microsaccades in Experiment 3. Images were either stabilized on the retina (Stabilized condition) or observed during sustained fixation (Unstabilized). The layout of the panels and use of symbols are as in Figure 2.
We examined the amplitude and the rate of microsaccades. Saccade amplitude was defined as the modulus of the vector connecting the first and last points of the trajectory followed by the eye during a saccade. The two points were defined by the instants in time in which eye velocity became greater (saccade onset) and lower (saccade offset) than 2°/s. Estimation of saccade offset automatically took into account and discarded the overshoot generated by the DPI eye tracker (Crane & Steele, 1978). Mean rates and amplitudes of saccades were evaluated as the average frequency and amplitude over the course of a trial. We also examined the time course of saccade rates and amplitudes throughout the trial by averaging these values over consecutive intervals. Averages were evaluated over bins of 1-s duration, with each bin centered so as to cover consecutive, non-overlapping 1-s periods starting from trial onset. That is, the value of the first sample corresponded to the average within the interval 0–1 s after trial onset, the second sample to the interval 1–2 s, and so on.
Periods of drifts were defined as blink-free intervals in between consecutive saccades. The motion of the eye during drift was characterized by means of several parameters, which include: (1) Mean and instantaneous velocities; (2) Drift amplitude and direction, defined as the modulus and the angle of the vector connecting the first and last points of the trajectory followed by the eye during the considered intersaccadic interval, (3) Drift length, defined as the average integral along the eye trajectory; (4) Span, defined as the radius of the smallest circle encompassing the trajectory. In the experiments described here, all these parameters were not affected by fading, and only length and velocity are reported.
In order to determine whether microsaccades were corrective for the displacements caused by drifts, we also examined the degree of correlation in the direction between consecutive drifts and microsaccades. Correlation coefficients were evaluated between the two vectors derived by the first and last points of successive intersaccadic-saccadic periods. Positive (negative) values indicate that microsaccades occurred in the same (opposite) direction of the preceding drifts.
Results
To explore the oculomotor impact of image fading, we examined the characteristics of fixational eye movements in three experiments. In Experiments 1 and 2, the stimulus was dynamically modified during the course of each trial in order to give the impression of image fading. Visual fading is typically described as an apparent change in contrast of the image, which progresses at faster speed in the visual periphery and tends to proceed from the periphery toward the center of the visual field (Lou, 1999; Sakaguchi, 2003). Experiment 1 simulated image fading following this description, by gradually decreasing the contrast of the image.
While a change in contrast captures the perceptual experience of visual fading well, other types of image manipulations also yield a similar effect. A particularly interesting case of such manipulations is a progressive decline in the frequency content of the image. Previous results from our laboratory have shown that fixational eye movements enhance discrimination of high-frequency gratings (Rucci et al., 2007), raising the hypothesis that the physiological instability of visual fixation contributes to the perception of fine spatial detail. Experiment 2 examined whether image fading can be regarded as a loss of spatial detail at progressively larger scales. In this experiment, fading was simulated by progressively narrowing the frequency bandwidth of the image while maintaining a constant contrast.
In Experiment 3, we examined the impact of endogenous (non-simulated) image fading. Fading was induced by moving the stimulus together with the eye in order to eliminate retinal image motion. The following three sections describe the results obtained in each of these experiments.
Experiment 1: Fading by contrast attenuation
In this experiment, the contrast of the stimulus was lowered during the course of the trial, so that the image eventually faded into a homogeneous gray field. The characteristics of microsaccades and drifts measured under these conditions are shown in Figures 2 and 3, respectively. To quantify the impact of fading on oculomotor activity, the eye movements recorded during simulated image fading (Fading) were compared to those measured when the contrast of the image increased instead of decreasing (No Fading condition). In this latter condition, the same movies presented during simulated fading were played backward (i.e., the last frame of each movie was presented at the beginning of the trial, and the first frame at the end of the trial), so that the images appeared to gradually emerge from a homogeneous gray field.
Figure 2.

Characteristics of microsaccades in Experiment 1. In each trial, the contrast of the stimulus either decreased (Fading) or increased (No fading). (a, c) Average microsaccadic rates and amplitudes across subjects (N = 5) in the two conditions. (b, d) Mean microsaccade rates and amplitudes estimated over consecutive 1-s intervals during the course of the trial. The error bars represent 95% confidence intervals (one-way ANOVA). The dashed lines represent the overall means. (e) Distributions of saccade amplitudes. The numbers give the average saccadic amplitudes in the two conditions.
Figure 3.

Characteristics of ocular drift in Experiment 1. (a) Average length (top) and velocity (bottom) of drift across subjects. (b) Dynamics of drift velocity during the course of a trial. Mean drift velocities estimated over consecutive 1-s intervals during the course of the trial. The error bars represent 95% confidence intervals (one-way ANOVA). The asterisks mark significant difference with respect to the last sample (post-hoc Scheffe's test). The dashed lines represent the overall means.
As previously reported in the literature, the frequency of microsaccades varied among subjects in an idiosyncratic manner. Among the five participants, the rate of microsaccades varied from a minimum of 0.5 microsaccade/s to a maximum of 2.1 microsaccades/s. However, as shown in Figure 2a, microsaccade rates were not affected by the direction of contrast changes. That is, each subject maintained its own rate of microsaccades when the contrast either increased or decreased. As a consequence, the average microsaccade rate across all subjects was virtually identical in the Fading and No Fading conditions (Fading: 1.2 ± 0.6 microsaccades/s; No Fading: 1.3 ± 0.6 microsaccades/s. t(4) = 0.86, p > 0.05, paired t-test). Thus, a loss of visibility caused by a reduction in stimulus contrast did not lead to more microsaccades.
While the average rate of microsaccades was not affected by image fading, it is possible that fading modulated microsaccade rates during the course of a trial. For example, microsaccades might have been more frequent at the beginning of a trial, when fading was initially experienced, and less frequent toward the end of a trial, when the image had almost completely disappeared. To investigate this possibility, we averaged microsaccade rates over consecutive 1-s intervals after trial onset. The graphs in Figure 2b show that the rates of microsaccades remained approximately constant during the course of a trial, and ANOVA comparisons of the rates measured at successive periods gave negative results. However, the mean rates measured during the first second following stimulus onset were lower than average, and individual comparisons of these initial values with the overall means (the mean rates estimated over the entire duration of the trial) reached significance in the No fading condition (0.9 microsaccade/s, t(4) = 4.22, p < 0.05) and fell shortly below significance in the Fading condition (1.1 microsaccades/s, t(4) = 1.31, p > 0.05). This phenomenon might be due to attentional modulations caused by the sudden appearance of the stimulus already reported in the literature (Engbert & Kliegl, 2003; Hafed & Clark, 2002).
We also examined the amplitudes of microsaccades and the way they varied during trials. Figure 2c shows that fading did not affect the amplitudes of microsaccades any differently from an enhancement in contrast. The mean microsaccade amplitude was 15′ ± 2′ when the contrast decreased (Fading) and 15′ ± 2′ when the contrast increased (No Fading; t(4) = 0.1, p > 0.05). As shown in Figure 2d, the mean amplitudes of microsaccades estimated at different intervals after the beginning of the trial always remained close to their overall averages. The only exception was the first 1-s interval in the Fading condition, in which the amplitude was slightly larger than average. This difference was, however, not significant, as it was entirely caused by one subject who performed larger saccades at the onset of the stimulus. The other subjects did not exhibit this behavior, and the amplitudes of their saccades during the first 2 s were very close to their overall averages.
Similar results were obtained when all saccades were included in the analysis. As shown in Figure 2e, saccades were distributed similarly in the two conditions and rarely exceeded 30′. The average saccadic amplitude was 19′ ± 14′ in the Fading condition and 20′ ± 15′ in the No Fading condition. The average saccadic rates in the two conditions were statistically undistinguishable, with a rate of 1.5 ± 0.7 saccades/s when the contrast decreased and a rate of 1.5 ± 0.8 saccades/s when the contrast increased.
Figure 3 compares the characteristics of ocular drifts between the two experimental conditions of Fading and No Fading. As was the case for microsaccades, drifts were also unaffected by changes in stimulus contrast. As shown in Figure 3, the length of the scanpath covered by the eye in the interval between two successive saccades was on average 14′ ± 5′ in the Fading condition and 14′ ± 4′ in the No Fading condition. Drifts also exhibited very similar mean velocity in the two conditions (Fading: 39 ± 4′/s; No Fading: 38 ± 5′/s, t(4) = 0.7, p 0.05; see bottom panel in Figure 3a). An almost identical evolution of the speed of ocular drift over the course of a trial was also found during contrast increments and decrements. Figure 3b shows instantaneous velocity of drift measured at successive 1-s intervals during the course of a trial. Interestingly, drift velocity was higher during the first second following the presentation of the stimulus (Fading: 44 ± 7′/s, t = 2.82, p < 0.05; No Fading: 43 ± 6′/s, t = 3.39, p < 0.05), an effect that, to our knowledge, has not been previously reported in the literature. This effect was, however, not caused by image fading, as it occurred in an identical manner when the contrast increased or decreased.
The data shown in Figures 2 and 3 were collected while subjects attempted to maintain precise fixation on a marker at the center of the image. It is possible that the very requirement of keeping accurate fixation influenced the pattern of eye movements. Such a difference would indeed be expected if microsaccades are part of the strategy by which the oculomotor system maintains the fovea on a stationary target, as originally proposed by Cornsweet (1956). To examine whether the presence of the fixation marker influenced oculomotor activity, in a control experiment, we relaxed the requirement of precise fixation by asking subjects to maintain their gaze within the central region of the image. No fixation marker was displayed in this case.
Figure 4 shows the results obtained from two subjects. For comparison, the microsaccade rates measured for these two subjects in the previous experiment, when they fixated on a marker, are also shown. Like in the case of accurate fixation, fading continued to have no noticeable effect on microsaccade production also under relaxed fixation. That is, while microsaccade rates were slightly different for the two subjects, each subject maintained their own rate in the two conditions of Fading and No Fading. Similar results were also obtained for micro-saccade amplitudes (data not shown). In contrast, micro-saccades were strongly modulated by the required precision of fixation. Both subjects exhibited a sharp reduction in microsaccadic rates under relaxed fixation. This reduction occurred in an identical manner in both Fading and No Fading conditions.
Figure 4.

Impact of the precision of required fixation on microsaccades. Observers were instructed to either fixate at the center of the monitor (Relaxed Fixation) or maintain fixation on a 5′ dot at the center of the screen (Accurate Fixation). The two panels show the rates of microsaccades measured when the contrast increased (No Fading) or decreased (Fading). Data points represent mean rates ± 95% confidence intervals for two individual subjects. Asterisks mark significant differences (p < 0.05, paired z-test).
Experiment 2: Fading by frequency bandwidth reduction
In this experiment, instead of changing the contrast of the stimulus, we simulated perceptual fading by progressively narrowing the frequency content of the image displayed on the monitor. Apart from this change, all the other procedures remained identical to those of Experiment 1. Subjects observed the same set of natural images already used in the previous experiment. Again, we quantified the oculomotor impact of visual fading by comparing the eye movements recorded when the frequency bandwidth of the image narrowed to those measured when the same movies were played backward, i.e., when the frequency bandwidth of the stimulus was enlarged. In this latter condition, the image gradually emerged from a uniformly gray field and reached its full sharpness at the end of the trial. In both conditions, observers maintained fixation on a dot at the center of the screen.
The characteristics of microsaccades and drifts measured in this experiment are shown in Figures 5 and 6, respectively. Results were very similar to those of Experiment 1. While microsaccade rates varied somewhat among subjects, every subject maintained a similar rate in the two conditions of bandwidth narrowing (Fading) and broadening (No Fading), yielding virtually identical averages (Fading: 1.1 ± 0.5 microsaccades/s; No Fading: 1.1 ± 0.6 microsaccades/s; t(4) = 0.14, p > 0.05. See Figure 5a). These averages were also statistically indistinguishable from those measured in Experiment 1. Furthermore, as shown in Figure 5b, instantaneous microsaccade rates varied slightly during the course of a trial. These rates were on average lower in the first 1-s interval immediately following the onset of the stimulus, a dynamic that replicated the pattern already observed in Experiment 1. This modulation was again not caused by the fading of the stimulus, as it occurred in both experimental conditions.
Figure 5.

Characteristics of microsaccades in Experiment 2. In each trial, the bandwidth of the image was either progressively narrowed (Fading) or enlarged (No Fading). The layout of the panels and graphic conventions are as in Figure 2.
Figure 6.

Characteristics of ocular drift velocity and length in Experiment 2. In each trial, the bandwidth of the image was either progressively narrowed (Fading) or enlarged (No Fading). The layout of the panels and graphic conventions are as in Figure 3.
The only visible difference between the characteristics of fixational eye movement measured in the two conditions regarded the amplitude of microsaccades. This difference was, however, smaller than 1′, and microsaccades measured when the bandwidth of the image narrowed were actually smaller in the Fading condition (Fading: 14′ ± 2′; No Fading: 15′ ± 2′; t(4) = 6.29, p < 0.05. See Figure 5b). Furthermore, the average amplitude of microsaccades remained virtually constant throughout the duration of the trial, as illustrated in Figure 5d. These data show that a progressive loss of high spatial frequencies, which visually resembles Troxler's fading, did not affect the frequency and amplitude of microsaccades.
Likewise in Experiment 2, similar results were obtained by comparing saccades with all amplitudes. Figure 5e shows that the amplitudes of saccades were distributed similarly in the two conditions of image blurring and sharpening. The average saccadic amplitude was 20′ ± 17′ in the Fading condition and 22′ ± 18′ in the No Fading condition. The average saccade rate was 1.3 ± 0.5 saccades/s in the Fading condition and 1.3 ± 0.6 saccades/s in the No Fading condition.
As shown in Figure 6, ocular drift was also minimally influenced by narrowing or enlarging the frequency bandwidth of the stimulus. Both the mean length of drift (Fading: 13′ ± 7′; No Fading: 12′ ± 7′) and drift velocities (Fading: 34 ± 5′/s; No Fading: 34 ± 5′/s) were statistically indistinguishable in the two experimental conditions. The only noticeable modulation in drift velocity was an increment in the mean speed of drift at the beginning of the trial. This modulation was very similar to the dynamics observed in Experiment 1. Again, this effect was not caused by image fading; it occurred during both blurring and sharpening of the image and appeared to be caused by the onset of the stimulus.
Experiment 3: Fading by retinal motion suppression
In the previous experiments, we manipulated the stimuli to simulate visual fading. It is possible that differences between the fading experienced in the absence of retinal image motion and the percept given by our stimuli contributed to the negative results of Experiments 1 and 2. To rule out this possibility, we conducted a third experiment in which fading was induced by eliminating retinal image motion, a procedure known as retinal stabilization. Stabilization of the stimulus on the retina was accomplished by means of EyeRIS (Santini et al., 2007), a custom-developed system that translated the image on the screen in a way that compensated for the subjects' eye movements. This method yields retinal stabilization with accuracy higher than 1′ and causes perceptual fading with dynamics highly similar to that given by a stimulus deflector, a standard method for eliminating retinal image motion (Crane & Steele, 1985; see Figure 9 in Santini et al., 2007).
In Experiment 3, the same images of natural scenes used in the previous experiments were stabilized on the observer's retina. In each trial, a non-stabilized fixation marker was also displayed at the center of the screen in order to ensure that the gaze would remain within the central region and the stabilized images would not reach the edges of the monitor. To quantify the impact of eliminating retinal image motion, the eye movements measured under retinal stabilization (Stabilized condition) were compared to those recorded when the same images were observed during prolonged fixation without stabilization (Unstabilized condition). After each block of consecutive trials, subjects were asked whether they had experienced fading. Subjects always reported fading when observing the stimulus under retinal stabilization and never reported fading during normal sustained fixation.
As shown in Figure 7a, the average rate of microsaccades was actually lower under retinal stabilization than during sustained fixation (Stabilized: 0.9 ± 0.5 microsaccades/s; Unstabilized: 1.3 ± 0.5 microsaccades/s; t(4) = 4.52, p < 0.05). Microsaccades were also slightly larger during retinal stabilization, but the difference between the amplitudes measured in the two conditions was small (Stabilized: 16′ ± 1′; Unstabilized: 15′ ± 0′; t(4) = 6.04, p < 0.05. See Figure 7c). Furthermore, the analyses in Figures 7b and 7d show that mean rates and amplitudes of microsaccades remained approximately constant during the course of the trial. The only important modulation was the reduction in the instantaneous rates of microsaccades during the first 1 s following the onset of the stimulus, when rates were significantly lower than the overall means (Stabilized: 0.7 microsaccade/s, t = 3.63, p < 0.05. Unstabilized: 0.9 microsaccade/s, t = 4.18, p < 0.05). This is the same phenomenon already observed in the previous two experiments.
Similar results were also obtained when the same analysis was extended to all saccades. As illustrated in Figure 7e, the distributions of saccades were similar in the two conditions of Experiment 3. The average saccadic amplitude was 21′ ± 16′ under retinal stabilization and 18′ ± 14′ during normal fixation (t(4) = 2.85, p < 0.05). The average saccadic rate was 1.1 ± 0.5 saccades/s under stabilization and 1.5 ± 0.6 saccades/s in the Unstabilized condition (t(4) = 3.05, p < 0.05).
As shown in Figure 8, although not statistically significant, the mean length of the trajectory covered by ocular drift during an intersaccadic period was higher under retinal stabilization than during sustained fixation (Stabilized: 19′ ± 4′ Unstabilized: 14′ ± 3′; t(4) = 2.72, p > 0.05). This effect was a direct consequence of the reduction in microsaccadic frequency, which increased the duration of the intersaccadic intervals. Indeed, as shown in the bottom panel of Figure 8a the velocity of drift was not affected by retinal stabilization (Stabilized: 36 ± 4′/s; Unstabilized: 35 ± 4′/s; t(4) = 0.4, p > 0.05) and was similar to the mean velocity measured in the previous experiments. Again, drift velocities were significantly higher than the overall means immediately after presentation of the stimulus (Stabilized: 43 ± 7′/s; t(4) = 3.96, p < 0.05; Unstabilized: 42 ± 7′/s; t(4) = 3.99, p < 0.05) and then remained constant for the entire duration of the trial. The initial increment in drift velocity occurred independently of whether the stimulus was stabilized on the retina or not. Thus, the only noticeable impact of retinal stabilization on eye movements was a reduction in the frequency of microsaccades. This effect goes in the opposite direction to the modulation predicted by the fading prevention hypothesis.
Figure 8.

Characteristics of ocular drifts velocity and length in Experiment 3. Images were either stabilized on the retina (Stabilized condition) or observed during sustained fixation (Unstabilized). The layout of the panels and use of symbols are as in Figure 3.
Whereas perceptual fading had little impact on eye movements, microsaccades continued to be strongly influenced by the precision of required fixation. As shown in Figure 9, in both stabilized and unstabilized conditions, the frequency of microsaccades dropped drastically when the fixation marker was eliminated, and subjects were instead instructed to fixate at the center of the screen. This further decrement in the frequency of microsaccades when stabilized images were examined without a fixed (unstabilized) reference corroborates our observation that, unlike perceptual fading, the precision of fixation is an important contributor to microsaccades.
Figure 9.

Impact of the precision of required fixation and attention on microsaccades. Observers were instructed to either fixate at the center of the monitor (Relaxed Fixation) or maintain fixation on a 5′ dot at the center of the screen (Accurate Fixation). The two panels show the rates of microsaccades measured during normal fixation (Unstabilized) and under retinal stabilization (Stabilized). The empty symbols in the right panel represent mean rates measured when subjects reported whether a stabilized image contained an animal. Accurate fixation was maintained in this experiment. Data points represent mean rates ± 95% confidence intervals for two individual subjects. Asterisks mark significant differences (p < 0.05, paired z-test).
Figure 9 also shows data from an additional control experiment, which examined the importance of explicitly attending to the fading stimuli. In all our experiments, the primary task was to fixate, and subjects were not required to pay attention to the images. It is therefore possible that lack of attention to the stimuli contributed to the similarity of the eye movements measured in the presence and absence of fading. To address this concern, we conducted a further experiment, in which subjects were explicitly asked to report about the stimulus. This control experiment was identical to the Stabilized condition of Experiment 3, except that observers were now required to report whether animals were present in the stabilized images. One every 10 images in our database contained a small animal (a bird or a rodent), most of the times located away from the center of the image. Thus, this task required observers to maintain fixation, while paying close attention to the fading image. The patterns of eye movements recorded in this experiment were very similar to those measured in the Stabilized condition of Experiment 3.As shown in Figure 9, the rates of microsaccades in this new condition were actually slightly lower than those measured when the same images were displayed but no perceptual report was required. They were also lower than the rates exhibited by the same subjects during fixation on the same unstabilized images. These data show that visual fading fails to elicit microsaccades also in a task in which attention to the fading stimulus is explicitly required.
Discussion
The nature of the relationship between microsaccades and perceptual fading has been the subject of a long controversy. While it is clear that microsaccades are sufficient to temporarily refresh visibility, it has remained an open question whether image fading acts as a stimulus for eliciting microsaccades. The results presented in this study show that both the frequency and the amplitude of microsaccades were not affected by manipulations of the stimulus, which simulated perceptual fading. Furthermore, elimination of retinal image motion by means of retinal stabilization, a procedure that induces visual fading, led to a reduction, rather than to an increment, in the rate of microsaccades. These results do not support a causal relationship between visual fading and microsaccade production.
Absence of retinal image motion causes image fading. As vividly described by Ditchburn et al. (1959), “when the subject views a stabilized image, perception of detail fails intermittently. For example a black bar a few minutes arc wide on a circular field 60′ in diameter (in the center of the fovea) and 50 m-L brightness would be seen easily and continuously in normal vision. However, when the image is stabilized the bar appears to fade out leaving the whole field uniformly illuminated; the bar reappears after a short interval and then disappears again, the whole process of `fade-out' followed by spontaneous regeneration being repeated at irregular intervals.” Perceptual fading is typically assumed to be the consequence of adaptation at various stages in the visual system (Burbeck & Kelly, 1984; Clarke & Belcher, 1962; Gur, 1989). However, other mechanisms might also contribute to this phenomenon, as it appears to be influenced by a number of complex factors ranging from the temporal characteristics of the background (Spillman & Kurtenbach, 1992) to attention (Weerd, Smith, & Greenberg, 2006).
The striking discovery that stimuli immobile on the retina tend to fade (Ditchburn & Ginsborg, 1952; Riggs & Ratliff, 1952; Riggs, Ratliff, Cornsweet, & Cornsweet, 1953; Yarbus, 1967) was followed by a debate on the specific roles of different types of eye movements in maintaining visibility (Bridgeman & Palca, 1980; Ditchburn et al., 1959; Gerrits & Vendrik, 1970; Winterson & Collewijn, 1976). Ditchburn et al. (1959) proposed that microsaccades are ideally suited for this task. These researchers observed that superposition of a sudden displacement to an otherwise retinally stabilized stimulus led to a sharp regeneration of the image, which did not seem to occur during reconstruction of ocular drift. An important role for microsaccades in preventing image fading is also supported by the observation that microsaccades improve contrast discrimination (Clowes, 1962) and is consistent with the interpretation that, during sustained fixation, Troxler's fading might be caused by a suppression of microsaccades. Indeed, it has recently been observed that the frequency and amplitude of microsaccades tend to be lower before periods of Troxler's fading and increase before transitions to visibility (Martinez-Conde et al., 2006).
However, the observation that microsaccadic motion is sufficient to revive a faded percept under retinal stabilization does not imply that microsaccades are necessary for maintaining visibility under normal viewing conditions. Kowler and Steinman (1980) pointed out that, outside of the laboratory conditions in which retinal stabilization experiments are conducted, the modulations necessary for preserving visibility are already given by uncompensated head and body movements without the need for microsaccades. This observation is supported by the report that fading is not experienced when eye movements are suppressed by means of retrobulbar block, a procedure that leaves head movements unaltered (Stevens et al., 1976). In contrast, fading does occur under complete body paralysis (Stevens et al., 1976). Moreover, the results of several studies speak against a specialized function for microsaccades in preventing image fading. Gerrits and Vendrik (1970) conducted an experiment similar to that of Ditchburn et al. (1959) and argued that drift-like motion are more effective than microsaccades in preventing visual fading. Microsaccades are also believed to be rare in tasks that involve high visual acuity, and yet subjects can successfully accomplish these tasks without experiencing fading (Winterson & Collewijn, 1976). In fact, even the data reported by Ditchburn et al. (1959) do not convincingly argue for a privileged function of microsaccades in preventing image fading. When the visibility impact of a smooth translation of the stimulus as measured by these authors is reexamined as a function of velocity rather than displacement, full visibility is already achieved with an average speed of the retinal image of approximately 20′/s (see Figure 2 in Ditchburn et al., 1959). This number is in the low range of the velocity spectrum of normal drift. In Experiments 1 and 2, the average velocity of ocular drift measured across subjects was 36′ ± 4′/s.
In our experiments, microsaccades were equally affected by opposite changes in the contrast and frequency content of the stimulus. Although the reductions in contrast and frequency bandwidth were designed to closely resemble the dynamics of fading occurring in the absence of retinal image motion, it is possible that differences between this percept and the endogenous experience of perceptual fading were responsible for the absence of a saccade modulation in Experiments 1 and 2. To exclude this possibility, we examined eye movements under retinal stabilization, a condition in which subjects reported fading of the image. We found that the rate of microsaccades was even lower with a stimulus immobile on the retina than during normal fixation. Similar results have already been reported using a contact lens mirror system for retinal stabilization (Cornsweet, 1956). However, this technique was later criticized for its imprecision (Barlow, 1963). In our study, retinal stabilization was achieved by controlling in real time the position of the stimulus on the monitor, a method that has been shown to yield highly accurate stabilization (Santini et al., 2007). Unlike the contact lens mirror system, our approach also enabled testing of naive and inexperienced subjects. By showing that the amplitudes and rates of microsaccades remained constant during stabilized trials, our results confirm and extend Cornsweet's findings.
Our finding that fixational eye movements were not affected by perceptual fading also cannot be attributed to changes in the frequency of blinks. Like microsaccades, blinks too cause sudden changes in the retinal image, which could counteract fading. However, blinks occurred quite rarely in our experiments (mean frequency: 0.05 ± 0.01 blinks/s), and no significant differences were observed in the frequency of blinks between experiments and conditions. That is, like for microsaccades, conditions that simulated or caused image fading did not lead to higher numbers of blinks. Furthermore, results identical to those described in this manuscript were also obtained when our analysis was restricted to the trials that did not contain blinks.
It is possible that the failure of visual fading to increase microsaccade rates in our experiments originated from the realization that, unlike during Troxler's fading, eye movements were not effective in improving visibility. Several considerations, however, suggest that this was not the case. First, one would expect many saccades to be necessary to extinguish an association consolidated through a lifetime of visual experience. Thus, if the realization that eye movements were ineffective in counteracting fading played a role in our results, changes in eye movements should occur as the experiments progressed. Yet no changes in the frequency of microsaccades that could be attributed to fading were visible in our data, nor during the course of trials, nor during the evolution of the experiments.
Secondly, fading and no fading trials were randomly intermixed in our experiments. Whereas visibility decreased in the fading trials, it monotonically increased during the course of the trial in the no fading condition of Experiments 1 and 2. Thus, in these trials, a saccade was always followed by a more visible image, a temporal relationship that would make extinction of the normal saccadic response hard to develop.
Third, because of the delay in rendering the stimulus, microsaccades could have actually been helpful in preventing visual fading under retinal stabilization. At the monitor refresh rate of 200 Hz used in our experiments, the average delay between measuring eye position and updating the stimulus on the display was 7.5 ms. While this delay guarantees excellent retinal stabilization during the periods of slow ocular drift, it led to an average error of 5′ during high-velocity microsaccades, when the stabilized stimulus lagged behind the current eye position. Furthermore, the post-saccadic overshoot generated by the DPI eye tracker (Deubel & Bridgeman, 1995) also displaced the retinal stimulus by a few minutes of arc and lasted on average for 15 ms. These changes in the retinal image could improve visibility of a faded stimulus. Yet microsaccades were even less frequent under retinal stabilization than during normal, unstabilized fixation. These considerations indicate that our results should extend to conditions in which eye movements have an immediate effect in counteracting fading.
If microsaccades were not caused by fading, what function did these eye movements serve in our experiments? A possible answer to this question comes from the comparison of the eye movements performed under the two different requirements of accurate and relaxed fixation in Experiments 1 and 3. As shown in Figures 4 and 9, microsaccades were significantly more frequent when subjects attempted to maintain accurate fixation on a cue than when they were instead instructed to keep their gaze at the center of the screen without a fixation marker. Analysis of the directions of fixational eye movements in these two viewing conditions also reveal that microsaccades had a higher probability of compensating for the preceding ocular drifts during accurate fixation than during relaxed fixation. Figure 10 shows levels of correlation in the directions of consecutive drifts and microsaccades. Whereas the directions of these movements were essentially uncorrelated during relaxed fixation, they were anti-correlated under the requirement of accurate fixation. These data are consistent with the proposal that, during sustained fixation on a cue, microsaccades and drifts tend to counterbalance each other in order to maintain the retinal slip of the fixation target within limits (Cornsweet, 1956; Nachmias, 1959). Although accurate fixation can be maintained by means of ocular drift alone (Skavenski & Steinman, 1970), both microsaccades and drifts are normally part of the strategy by which the eye reduces the fixation error (Engbert & Kliegl, 2004).
Figure 10.
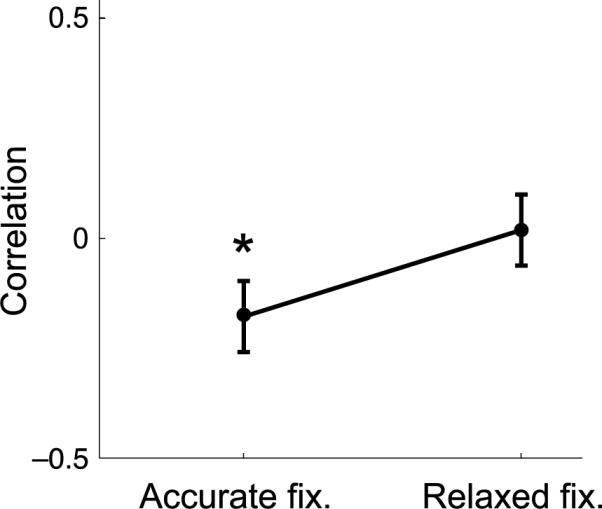
Correlation in the direction of consecutive drifts and microsaccades during fixation on a natural image with (Accurate Fixation) and without (Relaxed Fixation) a fixation marker. Error bars represent 95% confidence intervals. Asterisks mark a statistically significant difference between the two conditions (N = 8; t(7) = 3.26, p < 0.05).
An error-correcting function of microsaccades during fixation on a target would also explain the reduction in microsaccade rates measured in Experiment 3. During normal viewing, the fixation marker and the background image move together on the retina. This motion makes fixation errors easily detectable, as the visual system may rely not only on the displacement of the marker from the preferred retinal location but also on the way the entire image shifts on the retina. In Experiment 3, stabilized images were displayed together with an unstabilized fixation marker. Thus, the marker moved on the retina while the background remained immobile. In this case, it may be harder for the visual system to assess the offset between the current projection of the marker on the retina and the preferred retinal location. Only larger displacement may be detected and trigger microsaccades, therefore yielding lower microsaccade rates. In support of this proposal, (1) the span of ocular drift was larger in the Stabilized condition of Experiment 3 (Normal: 7′ ± 2′, Stabilized: 10′ ± 4′; t = 2.9, p < 0.05), and (2) the direction of a microsaccade was on average opposite to that of the preceding drift (r = −0.3). This proposal would also explain the further drop in microsaccade rates measured when stabilized images were displayed without an unstabilized fixation marker (Relaxed Fixation condition of Figure 9). In this condition, microsaccades may no longer be needed to correct for retinal displacements, because the projection of the target remains at the preferred retinal location.
In addition to an error-correcting function during accurate fixation, our results are also compatible with the possibility that microsaccades might be part of the strategy by which, under some circumstances, the visual system acquires information (Steinman, Haddad, Skavenski, & Wyman, 1973). An interesting hypothesis is that microsaccades might facilitate processing of peripheral stimuli in tasks in which it is necessary to maintain fixation and/or avoid macroscopic relocations of the line of sight. While the results of this study show that perceptual fading does not automatically lead to an increment in the microsaccade rate, microsaccades might still contribute to preventing fading in the visual periphery in tasks in which fixation is required and peripherally presented information needs to be processed. In the experiment of Figure 9, microsaccades were not affected by searching for an animal in a retinally stabilized image, even though most animals were located far from the fixation marker. However, further experiments with more demanding attentional tasks are needed to investigate this hypothesis.
An interesting phenomenon present in our data was a transient modulation in the characteristics of microsaccades and drift at trial onset. These effects were not related to visual fading, as their occurrence was independent of the direction of contrast and frequency changes. A reduction in the rate of microsaccades following the onset of the stimulus has already been reported in the literature (Engbert & Kliegl, 2003; Hafed & Clark, 2002) and attributed to attentional modulations. In our experiments, this initial reduction in microsaccadic rates was coupled with an increase in drift velocity. This modulation of drift velocity deserves further investigation, as it may challenge the common view of considering drift as the result of noise in the oculomotor system.
While the abrupt changes in retinal input resulting from microsaccades are certainly capable of reviving a faded percept, it has long been questioned whether the prevention of image fading represents a byproduct, rather than a fundamental function, of microsaccades (Nachmias, 1961). The results of this study reinforce this view. By showing that image fading does not affect the occurrence of microsaccades, our data argue against a causal link between stimulus visibility and microsaccade production. Recent studies have shown that microsaccades are modulated by attention (Engbert & Kliegl, 2003; Hafed & Clark, 2002), working memory (Valsecchi, Betta, & Turatto, 2007), the characteristics of the stimulus (Rucci et al., 2007), and the task (Ko, Poletti, & Rucci, 2009; Otero-Millan, Troncoso, Macknik, Serrano-Pedraza, & Martinez-Conde, 2008). Like other saccades, microsaccades are also under active control of the superior colliculus (Hafed, Goffart, & Krauzlis, 2009). These findings are contributing to portray a more complex scenario, in which microsaccades are, like larger saccades, an important component of the flexible strategy by which the visual system acquires information.
Supplementary Material
Acknowledgments
This work was supported by Grant EY18363 from the National Institute of Health and Grant BCS-0719849 from the National Science Foundation. The authors thank David Richters for his helpful comments on the manuscript.
Footnotes
Commercial relationships: none.
References
- Arend LE, Timberlake GT. What is psychophysically perfect image stabilization? Do perfectly stabilized images always disappear? Journal of the Optical Society of America A, Optics and Image Science. 1986;3:235–241. doi: 10.1364/josaa.3.000235. [DOI] [PubMed] [Google Scholar]
- Barlow HB. Slippage of contact lenses and other artefacts in relation to fading and regeneration of supposedly stable retinal images. Quarterly Journal of Experimental Psychology. 1963;15:36–51. [Google Scholar]
- Brady N, Field DJ. Local contrast in natural images: Normalisation and coding efficiency. Perception. 2000;29:1041–1055. doi: 10.1068/p2996. [DOI] [PubMed] [Google Scholar]
- Bridgeman B, Palca J. The role of microsaccades in high acuity observational tasks. Vision Research. 1980;20:813–817. doi: 10.1016/0042-6989(80)90013-9. [DOI] [PubMed] [Google Scholar]
- Burbeck CA, Kelly DH. Role of local adaptation in the fading of stabilized images. Journal of the Optical Society of America A, Optics and Image Science. 1984;1:216–220. doi: 10.1364/josaa.1.000216. [DOI] [PubMed] [Google Scholar]
- Clarke FJJ, Belcher SJ. On the localization of Troxler's effect in the visual pathway. Vision Research. 1962;2:53–68. [Google Scholar]
- Clowes MB. A note on colour discrimination under conditions of retinal image constraint. Journal of Modern Optics. 1962;9:65–68. doi: 10.1080/713826405. [DOI] [PubMed] [Google Scholar]
- Collewijn H, Kowler E. The significance of microsaccades for vision and oculomotor control. Journal of Vision. 2008;8(14):20, 1–21. doi: 10.1167/8.14.20. http://journalofvision.org/8/14/20/, doi:10.1167/8.14.20. [DOI] [PMC free article] [PubMed] [Google Scholar]
- Coppola D, Purves D. The extraordinarily rapid disappearance of entopic images. Proceedings of the National Academy of Sciences of the United States of America. 1996;93:8001–8004. doi: 10.1073/pnas.93.15.8001. [DOI] [PMC free article] [PubMed] [Google Scholar]
- Cornsweet TN. Determination of the stimuli for involuntary drifts and saccadic eye movements. Journal of the Optical Society of America. 1956;46:987–988. doi: 10.1364/josa.46.000987. [DOI] [PubMed] [Google Scholar]
- Crane HD, Steele C. Accurate three-dimensional eyetracker. Applied Optics. 1978;17:691–705. doi: 10.1364/AO.17.000691. [DOI] [PubMed] [Google Scholar]
- Crane HD, Steele C. Generation V dual Purkinje-Image eyetracker. Applied Optics. 1985;24:527–537. doi: 10.1364/ao.24.000527. [DOI] [PubMed] [Google Scholar]
- Deubel H, Bridgeman B. Fourth purkinje image signals reveal eye-lens deviations and retinal image distortions during saccades. Vision Research. 1995;35:529–538. doi: 10.1016/0042-6989(94)00146-d. [DOI] [PubMed] [Google Scholar]
- Ditchburn RW. What is psychophysically perfect image stabilization? Do perfectly stabilized images always disappear? Comment. Journal of the Optical Society of America. 1987;4:405–406. doi: 10.1364/josaa.4.000405. [DOI] [PubMed] [Google Scholar]
- Ditchburn RW, Fender DH, Mayne S. Vision with controlled movements of the retinal image. The Journal of Physiology. 1959;145:98–107. doi: 10.1113/jphysiol.1959.sp006130. [DOI] [PMC free article] [PubMed] [Google Scholar]
- Ditchburn RW, Ginsborg BL. Vision with a stabilized retinal image. Nature. 1952;170:36–37. doi: 10.1038/170036a0. [DOI] [PubMed] [Google Scholar]
- Engbert R, Kliegl R. Microsaccades uncover the orientation of covert attention. Vision Research. 2003;43:1035–1045. doi: 10.1016/s0042-6989(03)00084-1. [DOI] [PubMed] [Google Scholar]
- Engbert R, Kliegl R. Microsaccades keep the eyes' balance during fixation. Psychological Science. 2004;15:431–436. doi: 10.1111/j.0956-7976.2004.00697.x. [DOI] [PubMed] [Google Scholar]
- Field DJ. Relations between the statistics of natural images and the response properties of cortical cells. Journal of the Optical Society of America A, Optics and Image Science. 1987;4:2379–2394. doi: 10.1364/josaa.4.002379. [DOI] [PubMed] [Google Scholar]
- Gerrits HJ, Vendrik AJ. Artificial movements of a stabilized image. Vision Research. 1970;10:1443–1456. doi: 10.1016/0042-6989(70)90094-5. [DOI] [PubMed] [Google Scholar]
- Gonzalez EG, Weinstock M, Steinbach MJ. Peripheral fading with monocular and binocular viewing. Vision Research. 2007;47:136–144. doi: 10.1016/j.visres.2006.09.013. [DOI] [PubMed] [Google Scholar]
- Gur M. Color and brightness fade-out in the ganzfeld is wavelength dependent. Vision Research. 1989;29:1335–1341. doi: 10.1016/0042-6989(89)90190-9. [DOI] [PubMed] [Google Scholar]
- Hafed Z, Clark J. Microsaccades as an overt measure of covert attention shifts. Vision Research. 2002;42:2533–2545. doi: 10.1016/s0042-6989(02)00263-8. [DOI] [PubMed] [Google Scholar]
- Hafed Z, Goffart L, Krauzlis RJ. A neural mechanism for microsaccade generation in the primate superior colliculus. Science. 2009;323:940–943. doi: 10.1126/science.1166112. [DOI] [PMC free article] [PubMed] [Google Scholar]
- Kelly DH. Motion and vision. I. Stabilized images of stationary gratings. Journal of Optical Society of America. 1979;69:1266–1274. doi: 10.1364/josa.69.001266. [DOI] [PubMed] [Google Scholar]
- Ko H-K, Poletti M, Rucci M. Fixational eye movements in a high-acuity visual task [Abstract] Journal of Vision. 2009;9(8):430, 430a. http://journalofvision.org/9/8/430/, doi:10.1167/9.8.430. [Google Scholar]
- Koenderink JJ. Contrast enhancement and the negative afterimage. Journal of the Optical Society of America. 1972;62:685–689. doi: 10.1364/josa.62.000685. [DOI] [PubMed] [Google Scholar]
- Komatsu H. The neural mechanisms of perceptual filling-in. Nature Reviews Neuroscience. 2006;7:220–231. doi: 10.1038/nrn1869. [DOI] [PubMed] [Google Scholar]
- Kowler E, Steinman R. Small saccades serve no useful purpose. Vision Research. 1980;20:273–276. doi: 10.1016/0042-6989(80)90113-3. [DOI] [PubMed] [Google Scholar]
- Lou L. Selective peripheral fading: Evidence for inhibitory sensory effect of attention. Perception. 1999;28:519–526. doi: 10.1068/p2816. [DOI] [PubMed] [Google Scholar]
- Martinez-Conde S, Macknik SL, Troncoso XG, Dyar TA. Microsaccades counteract fading during fixation. Neuron. 2006;49:297–305. doi: 10.1016/j.neuron.2005.11.033. [DOI] [PubMed] [Google Scholar]
- Nachmias J. Two-dimensional motion of the retinal image during monocular fixation. Journal of the Optical Society of America. 1959;49:901–908. doi: 10.1364/josa.49.000901. [DOI] [PubMed] [Google Scholar]
- Nachmias J. Determiners of the drift of the eye during monocular fixation. Journal of the Optical Society of America. 1961;51:761–766. doi: 10.1364/josa.51.000761. [DOI] [PubMed] [Google Scholar]
- Otero-Millan J, Troncoso XG, Macknik SL, Serrano-Pedraza I, Martinez-Conde S. Saccades and microsaccades during visual fixation, exploration, and search: Foundations for a common saccadic generator. Journal of Vision. 2008;8(14):21, 1–18. doi: 10.1167/8.14.21. http://journalofvision.org/8/14/21/, doi:10.1167/8.14.21. [DOI] [PubMed] [Google Scholar]
- Riggs LA, Ratliff F. The effects of counteracting the normal movements of the eye. Journal of the Optical Society of America. 1952;42:872–873. [Google Scholar]
- Riggs LA, Ratliff F, Cornsweet JC, Cornsweet TN. The disappearance of steadily fixated visual test objects. Journal of the Optical Society of America. 1953;43:495–501. doi: 10.1364/josa.43.000495. [DOI] [PubMed] [Google Scholar]
- Rucci M, Iovin R, Poletti M, Santini F. Miniature eye movements enhance fine spatial detail. Nature. 2007;447:852–855. doi: 10.1038/nature05866. [DOI] [PubMed] [Google Scholar]
- Sakaguchi Y. Visual field anisotropy revealed by perceptual filling-in. Vision Research. 2003;43:2029–2038. doi: 10.1016/s0042-6989(03)00305-5. [DOI] [PubMed] [Google Scholar]
- Santini F, Redner G, Iovin R, Rucci M. EyeRIS: A general-purpose system for eye movement contingent display control. Behavioral Research Methods. 2007;39:350–364. doi: 10.3758/bf03193003. [DOI] [PubMed] [Google Scholar]
- Skavenski AA, Steinman RM. Control of eye position in the dark. Vision Research. 1970;10:193–203. doi: 10.1016/0042-6989(70)90115-x. [DOI] [PubMed] [Google Scholar]
- Spillman L, Kurtenbach A. Dynamic noise backgrounds facilitate target fading. Vision Research. 1992;32:1941–1946. doi: 10.1016/0042-6989(92)90053-l. [DOI] [PubMed] [Google Scholar]
- Steinman R, Cunitz R, Timberlake G, Herman M. Voluntary control of microsaccades during maintained monocular fixation. Science. 1967;155:1577–1579. doi: 10.1126/science.155.3769.1577. [DOI] [PubMed] [Google Scholar]
- Steinman RM, Haddad GM, Skavenski AA, Wyman D. Miniature eye movement. Science. 1973;181:810–819. doi: 10.1126/science.181.4102.810. [DOI] [PubMed] [Google Scholar]
- Steinman RM, Levinson JZ. The role of eye movements in the detection of contrast and spatial detail. In: Kowler E, editor. Eye movements and their role in visual and cognitive processes. chapter 3. The Netherlands: Elsevier Science Publisher BV; Amsterdam: 1990. pp. 115–212. [PubMed] [Google Scholar]
- Stevens JK, Emerson RC, Gerstein GL, Kallos T, Neufeld GR, Nichols CW, et al. Paralysis of the awake human: Visual perceptions. Vision Research. 1976;16:93–98. doi: 10.1016/0042-6989(76)90082-1. [DOI] [PubMed] [Google Scholar]
- Tulunay-Keesey U. Fading of stabilized retinal images. Journal of the Optical Society of America. 1982;72:440–447. doi: 10.1364/josa.72.000440. [DOI] [PubMed] [Google Scholar]
- Valsecchi M, Betta E, Turatto M. Visual oddballs induce prolonged microsaccadic inhibition. Experimental Brain Research. 2007;177:196–208. doi: 10.1007/s00221-006-0665-6. [DOI] [PubMed] [Google Scholar]
- van Hateren JH, Ruderman DL. Independent component analysis of natural image sequences yields spatio-temporal filters similar to simple cells in primary visual cortex. Proceedings of Biological Science. 1998;265:2315–2320. doi: 10.1098/rspb.1998.0577. [DOI] [PMC free article] [PubMed] [Google Scholar]
- Weerd PD, Smith E, Greenberg P. Effects of selective attention on perceptual filling-in. Journal of Cognitive Neuroscience. 2006;18:335–347. doi: 10.1162/089892906775990561. [DOI] [PubMed] [Google Scholar]
- Winterson B, Collewijn H. Microsaccades during finely guided visuomotor tasks. Vision Research. 1976;16:1387–1390. doi: 10.1016/0042-6989(76)90156-5. [DOI] [PubMed] [Google Scholar]
- Yarbus AL. Eye movements and vision. Plenum Press; New York: 1967. [Google Scholar]
Associated Data
This section collects any data citations, data availability statements, or supplementary materials included in this article.