

Abstract
Retinal ganglion cells that respond selectively to a dark spot on a brighter background (OFF cells) have smaller dendritic fields than their ON counterparts and are more numerous. OFF cells also branch more densely, and thus collect more synapses per visual angle. That the retina devotes more resources to processing dark contrasts predicts that natural images contain more dark information. We confirm this across a range of spatial scales and trace the origin of this phenomenon to the statistical structure of natural scenes. We show that the optimal mosaics for encoding natural images are also asymmetric, with OFF elements smaller and more numerous, matching retinal structure. Finally, the concentration of synapses within a dendritic field matches the information content, suggesting a simple principle to connect a concrete fact of neuroanatomy with the abstract concept of information: equal synapses for equal bits.
Keywords: ganglion cells, neural coding, vision
The brain separates light from dark unequally. Psychophysical studies and measurements of visually evoked potentials show greater sensitivity to light decrements and dark spots in images (1, 2). Also, more cortical cells respond to negative than positive contrasts (3). In fact, this asymmetry begins with the second order (bipolar) neurons in the retina, which rectify the local contrast signal from the cone array (Fig. 1A). OFF cone bipolar cells (responding mostly to negative contrasts) outnumber the ON cells (responding mostly to positive contrasts) by 2-fold (4); thus, right from the start, the brain provides more resources for signaling negative contrasts.
Fig. 1.

Retina expends more resources to encode negative contrasts. (A) Two classes of bipolar neuron sense the cone output—one depolarizes to negative contrasts (OFF cells) and the other depolarizes to positive contrasts (ON cells). At the bipolar-cell synaptic terminal, the calcium currents in both classes are rectified so that each class uses its full dynamic range to code one-half of the contrast range. The rectified signals are relayed forward to OFF and ON ganglion cells. (B) OFF dendritic arbors are smaller but more densely branched. ON and OFF ganglion cells (brisk-transient class) in flat view are shown. Neighboring cells were injected with fluorescent dye and photographed in a confocal microscope. (C) Dendritic-field area is smaller for the OFF than the ON cells, but total dendritic length is the same. Because synaptic density on the dendritic membrane is the same for both types (13), they receive similar numbers of bipolar synapses.
This aspect of retinal structure continues through the ganglion-cell level, where some ganglion-cell types have paired ON and OFF polarities (e.g., P and M in monkey, brisk-transient and brisk-sustained in rabbit and guinea pig, and X and Y in cat). Of these, the OFF cells have narrower dendritic fields and correspondingly narrower receptive-field centers than their ON partners [guinea pig (Fig. 1B), rat (5), rabbit (6), monkey (7), human (8), and smaller differences in cat (9)]. Thus, to cover the retina, OFF cells outnumber their ON partners. OFF arbors are narrower across cell classes with different spatiotemporal bandwidths (e.g., they are narrower for both midget and parasol cells in humans) (8). Specifically, whereas in fovea, midget cells are paired (one ON and one OFF per cone), beyond fovea, where midget cells collect from many bipolar cells and cones, OFF cells have smaller arbors and hence, are more numerous.
While OFF cells distribute more densely than their counterpart ON cells, both types have similar receptive-field overlap (spacing is about two times the SD of a Gaussian fit to the central receptive field) (6, 10, 11). Furthermore, OFF arbors (as we quantify here) branch more densely (5) and provide similar dendritic membrane areas as ON arbors. Because the membrane density of excitatory synapses (synapses/μm2) is constant across an arbor and across cell types (12, 13), OFF cells receive similar numbers of synapses as their counterpart ON cells but over a narrower visual angle. Thus, synapses are more densely devoted to the OFF array.
Because neural circuits allocate resources efficiently (14–17), we reasoned that the extra resources devoted to OFF arrays represent specific adaptations to the statistical structure of natural stimuli. We considered that a behavioral decision based on any stimulus is broadly limited by the amount of available information (18, 19). Thus, we reasoned that if negative contrasts contain more information about natural scenes, then this would justify the excess of OFF cells. Furthermore, if dark information is more concentrated spatially in natural scenes, this would justify the OFF cell's denser distribution of synapses. Thus, we hypothesized that (i) natural scenes contain more regions of negative than positive contrast, (ii) information in the dark regions is more concentrated, and (iii) the asymmetric organization of paired OFF and ON channels represents an adaptation to this predominance of dark information.
Retinal ganglion cells have spatially extended receptive fields of many different sizes and respond to both spatial and temporal contrast. Thus, to test our hypothesis, we measured spatial contrast in natural images using model center-surround receptive fields and temporal contrast in natural time series with model temporal filters. For temporal contrasts, there was no asymmetry, but for spatial contrasts, there was a marked asymmetry at all spatial scales—favoring negative contrasts. To explore this, we constructed artificial images with the same first- and second-order statistical structure as natural images. These also showed a predominance of negative contrasts. Computing the information represented by mosaics of OFF and ON elements, we found that information peaks when (i) OFF elements are smaller and more numerous, matching retinal structure, and (ii) individual OFF and ON elements represent equal amounts of information. This correlates with the equality in their numbers of synapses. Our results suggest that the retinal mosaic is not simply determined by the required spatial resolution, but by tradeoffs involving the efficient representation of the asymmetric distribution of information in the natural world.
Results
OFF Cells Predominate in Ganglion-Cell Arrays.
Differences between OFF and ON cells were known for dendritic-field diameter, cell spacing, and coverage (see Introduction). The difference in dendritic branching had not been quantified but was critical, because in retinal ganglion cells, membrane area sets the number of excitatory synapses received over a given retinal area (12, 13). These numbers, which we now report, could then be compared with the distributions of information across images. We also sought to compare these quantitative aspects of spatial structure to temporal structure of the same cell types. Thus, it was desirable to evaluate all of these parameters for one specific cell class in one particular species. We chose the brisk-transient (Y) class in guinea pig, which comprises both ON and OFF types.
Identified by their large cell bodies (>15 μm), brisk-transient ganglion cells were injected with fluorescent dye and imaged by confocal microscopy. OFF brisk-transient dendritic fields stratified at 25% depth in the inner synaptic layer, just beneath a different cell type (OFF δ) from which they were distinguished. ON brisk-transient dendritic fields stratified at ∼80% depth, overlapping another cell type (ON Direction Selective); however, the ON brisk-transient dendritic fields, being much larger, were easily distinguished.
Brisk-transient dendritic fields were delineated as polygons by connecting the dendritic tips. OFF fields were ∼1.7-fold smaller in area than the ON fields: 0.15 ± 0.02 mm2 vs. 0.26 ± 0.06 mm2 (Fig. 1C Upper). Because both arrays cover the retina independently, OFF cells must be closer together and thus, more numerous. Given similar ON and OFF dendritic overlap (10, 20, 21), the ratio of dendritic-field areas implies that OFF cells exceed ON cells by a factor of ∼1.7 ± 0.4. This agrees with receptive field measurements: OFF neighbors space more closely than ON neighbors, similarly implying numerical predominance of OFF cells (10).
The difference in dendritic branching of OFF and ON cells was obvious to inspection (Fig. 1B). Both types provided similar total dendritic length (7,300 ± 1,300 μm for ON vs. 6,700 ± 1,000 μm for OFF, ratio = 1.09 ± 0.2) (Fig. 1C Lower), but the ON cell covered more dendritic-field area with the same total dendritic length. Therefore, dendritic length per retinal area was greater for OFF vs. ON cells by a factor ∼1.6 ± 0.4. Because the dendritic calibers are similar, both types have similar areas of dendritic membrane, and because the densities of excitatory synapses on their membranes are similar, individual OFF and ON cells collect similar numbers of synapses. The predominance of OFF cells then implies that the OFF array uses on average ∼1.7-fold more excitatory synapses.
In summary, the OFF array, containing about 2-fold more cells and synapses than the ON array, allocates more total resources to encoding a scene. An individual OFF cell uses similar resources as an ON cell but concentrates them over a smaller region. On the broad principle that resources are invested according to the likely return, these asymmetries suggest asymmetrical structure in natural images.
Natural Images Contain More Negative Spatial Contrasts.
ON and OFF ganglion cells respond selectively to positive and negative spatial contrasts (locally bright and dark regions). Thus, we asked if the predominance of OFF cells in retinal mosaics might reflect an adaptation to an excess of negative spatial contrasts in natural images. To measure the distribution of dark and bright regions, we modeled the ganglion cell's center-surround receptive field as a divisively normalized difference of Gaussians filter (22). This filter measured contrast at an image point (x, y) as
Here, Ic, Is, and Id are intensities measured by unit-normalized center, surround, and divisive normalization Gaussian filters centered at (x, y). Center and surround were weighted equally so that a spatially uniform image evoked no response. Divisive normalization captured ganglion-cell adaptation to local mean intensity (23). Thus, the filter measured contrast as a percent difference in intensity between center and surround relative to a divisive adaptation pool. A positive response meant that the center was brighter than the surround.
From a standard set of calibrated monochrome natural images (24), we selected 50 rural images. Image resolution was 1 arc-min per pixel, corresponding to roughly two cone-receptive field diameters in the human fovea. We convolved these images with model receptive fields to measure contrast at every location (Fig. 2). The surround SD was taken to be 1.5 times the center SD, matching previous measurements (10), and the adaptation pool was taken to be of the same size as the surround (the SD of Id was set equal to the SD of Is). For each filter size (parameterized by center SD), we constructed a probability distribution of contrasts by convolution with the image ensemble. Here, we report the distribution of contrasts obtained after averaging over all images. To avoid edge artifacts, contrasts calculated within 100 pixels of an image edge were discarded.
Fig. 2.

Natural images contain more negative than positive contrasts at all scales. (A) Centers of difference of Gaussians filters superimposed on an image. (B) Image rectified into separate channels for positive (ON) and negative (OFF). Brighter pixels correspond to stronger contrasts. After rectification, dark leaf veins appear bright in the OFF image and dark in the ON image. (C) Contrast distributions at three scales; the distributions are skewed, and negative contrasts are more abundant. Contrast is the response of a difference of Gaussians filter, with a surround 1.5 times the size of the center, divisively normalized by the surround response. (Inset) Intensity distribution in natural images (skewed) vs. Gaussian normalized to the same height and full width at one-half maximum. (D) Proportion of negative, positive, and subthreshold (<1%) contrasts.
The distributions of local contrast peaked at 0, with sharper peaks for narrower filters (Fig. 2C). For all filter radii, negative contrasts (dark regions) were more numerous. To quantify this asymmetry, we measured the proportion of negative contrasts, setting response threshold to match measurements from ganglion cells (25–27). As filter width increased, the contrast distributions flattened, causing the number of subthreshold responses to decrease. However, at all spatial scales, negative contrasts were substantially more numerous (Fig. 2D). The excess of negative contrasts was independent of the adaptation pool size, the power of Id appearing in the denominator in Eq. 1 and the precise shape of the center-surround filter (SI Text). This is because divisive normalization by a positive number does not change the sign of the center response minus the surround response. Thus, the fraction of dark contrasts exceeded the fraction of bright contrasts even without divisive normalization. These findings extend early reports of specific instances of a skew to negative contrasts (15, 28, 29).
Excess Negative Contrasts Arise from Skewed Intensities and Spatial Correlations.
To determine what causes the dark/bright asymmetry in natural images, we constructed several types of artificial image. First, control images were established by drawing pixel intensities independently from a Gaussian distribution. Probing with the same filters used on natural images (Fig. 2), we found, across spatial scales, equal numbers of OFF and ON responses (Fig. 3 A and C). Next, images were created by drawing intensities from natural distributions, which are highly skewed (30). Probing these with the same filters, we found substantial asymmetries, with more OFF than ON responses (Fig. 3 B and D).
Fig. 3.

The predominance of negative contrasts is partly explained by the skewed-intensity distributions and approximate scale invariance of natural images. Contrast was the response of a difference of Gaussians filter, with a surround 1.5 times the size of the center, divisively normalized by the surround response. (A) Contrasts in images with pixel intensities drawn independently from a Gaussian distribution. (B) Contrasts in images with pixel intensities drawn independently from the skewed natural-intensity distribution. (C) Contrasts in images produced by convolving Gaussian noise (Fig. 4A) with a 1/f filter. (D) Contrasts in images produced by remapping intensities in C onto the natural-image intensity distribution.
Artificial images lacking the natural power-law correlations (1/f power spectrum) (31) showed more subthreshold responses with increasing filter size (Fig. 3 A and B). This results from averaging over more uncorrelated pixels, as expected from the central-limit theorem, and holds equally for images created from Gaussian- or skewed-intensity distributions. However, when images constructed from either intensity distribution included the natural power-law correlations, the fractions of negative, positive, and subthreshold contrast responses were constant at all spatial scales (Fig. 3 C and D). Thus, the artificial images that most closely mimicked the distribution of OFF and ON responses for natural images were those that combined the natural-intensity distribution and the natural power-law correlations (Fig. 3D).
Thus, the excess of negative contrasts arises from the skewed-intensity distribution in natural images (i.e., because the mean intensity is greater than the median). This excess is maintained across scales by the spatial correlations.
Temporal Contrasts Are About Equally Positive and Negative.
Besides spatial contrasts, ganglion cells also respond to temporal contrasts—caused by local increments or decrements in light intensity. Thus, we wondered whether the predominance of OFF cells might also indicate differences in the natural occurrence of increments and decrements. To test this, we first measured the statistics of light increments in 12 standard natural time series of intensities representing optic flow arising from viewer motion (32). We binned the intensities over a range of time intervals (0.8 ms to 1 s) and measured the probability of encountering an increase or decrease in intensity from one interval to the next. At each temporal scale, the distribution was symmetric around 0 (results for 100-ms bins in Fig. 4A), and the numbers of light increments and decrements were equal. To test whether this result was specific to optic flow, we constructed artificial time series by simulating fixational eye movements on static images (Materials and Methods). Again, at all temporal scales, the distribution of increments and decrements was symmetric (Fig. 4A).
Fig. 4.

Natural time series containing similar amounts of negative and positive temporal contrast at all time scales. (A) The distribution of light increments and decrements is symmetric for optic flow and fixational time series. (B) The temporal filter of brisk-transient ganglion cells is well-fit by a band-pass filter (ON brisk-transient cell shown). (C) The distribution of responses of the average ganglion-cell temporal filter is similar to the distributions of increments and decrements. (D) Over a range of temporal scales, the fraction of negative filter responses only modestly exceeds the fraction of positive responses by ∼3%.
Ganglion cells do not simply respond to light increments and decrements binned at some scale—rather they encode temporal contrast, understood as the response of temporal receptive fields that takes the form of a band-pass filter. Thus, we tested if there might be a predominance of negative temporal contrasts measured in this way. We constructed model temporal receptive fields as band-pass filters described by a difference of cascades of low-pass filters,  , where
  <
<  were time constants and n was the order of the two low-pass filters (7). Using a spatial binary white-noise stimulus, we measured temporal filters at the center of the spatial receptive field for a population of 77 brisk-transient cells (42 OFF and 35 ON) (Fig. 4B). We fit parameters to minimize root mean-squared error (RMSE). The mean RMSE was 0.027—comparable with noise fluctuations in the data. Mean values of n,
  , and
, and  were, respectively, 6, 67 ms, and 97 ms.
We found no significant difference in the fit parameters for ON vs. OFF cells. The mean time to peak of the measured ganglion cell filters—a primary measurement, not a fit—was 65 ms for OFF cells and 68 ms for ON cells. Thus, the temporal filters for ON and OFF brisk-transient cells are opposite in sign but otherwise approximately equal. This agrees with refs. 6 (ground squirrel), 33 (primate), and 34 (guinea pig). Slightly faster kinetics have been reported for ON parasol cells in primate (7) and for OFF cells in salamander (35).
To compute the distribution of temporal contrasts encountered by real ganglion cells, we convolved the natural and simulated time series of intensities described above with the average measured temporal filters. In both cases, the filter responses peaked at 0, were highly kurtotic (Fig. 4C), and showed a slight excess (1–3%) of negative responses (Fig. 3D). To test whether this result depended on the temporal kinetics of the receptive field, we computed the responses for a range of  while keeping the ratio
  /
/ fixed. The slight excess of negative responses persisted (Fig. 4D).
The excess in negative temporal contrast was small compared with the excess of negative spatial contrasts (10–15%) (Fig. 2 and SI Text). This suggests that the excess of OFF cells is driven by asymmetric spatial statistics. To test this, we studied model mosaics selective for negative and positive spatial contrasts.
Optimal Mosaics Have More OFF Elements.
Given the measured excess of negative spatial contrast in natural scenes, a simple argument suggests that a mosaic with more OFF elements would transmit the most contrast information. Consider a retina with a single ganglion cell: contrast information transmitted by this retina will be maximized if this is an OFF cell, because the excess of negative contrasts makes it more likely to respond when all other factors are equal. When the number of OFF ganglion cells is increased, the responses will have redundancies because of correlations in the natural visual input. This will decrease the relative advantage of OFF over ON cells. Eventually, adding ON cells will become equally useful, and therefore, the mosaic transmitting the most information should contain a mixture of OFF and ON cells but more OFF cells, as seen in the retina.
These considerations follow from considering OFF and ON cells to be selective for opposite contrasts but otherwise similar in their response properties. Because OFF and ON pathways are largely independent, differences in their dynamic ranges, noise properties, and receptive-field overlap could affect their optimal proportions. To test quantitatively how various factors influence the optimal ON/OFF balance, we constructed a simple model that captured general features of ganglion-cell contrast encoding that all detailed response models embody. These features were (i) limited dynamic response range, (ii) a rectifying, saturating nonlinearity that fills this response range, (iii) noise, which effectively discretizes the response levels, and (iv) fixed amount of overlap within ON and OFF mosaics (about 2 SDs of the receptive-field centers) (6, 10).
Information in a Mosaic of ON and OFF Elements.
We considered a mosaic of N = NON + NOFF retinal ganglion cells in spatially independent ON and OFF arrays, each covering area A. Elements were spaced evenly within each array and independently between arrays. The total information about a visual input conveyed by the array's responses is I = ION + IOFF − M, where ION and IOFF give the mutual information between the natural-scene input and the arrays and M is the mutual information between the OFF and ON arrays.
If ganglion cells were independent encoders, information in an array would equal the number of elements in the array multiplied by the information conveyed by a single element. Because contrast as measured by ganglion cells is uncorrelated, even at modest separations, ganglion-cell redundancy is largely a result of receptive-field overlap (10). Therefore, we can write 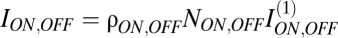 , where I(1) is the information in single cell responses and the coefficient 0 < ρ < 1 discounts for redundancy in information encoded by overlapping receptive fields (10). Thus, total information is
  Receptive overlap is constant across cell types, because cell spacing is about two times the SD of the central receptive field (6, 10). We scaled receptive-field sizes with array spacing to maintain this degree of overlap. Thus, redundancy caused by overlap (ρ) was constant, independent of the cell density.
We took I(1) to be information in the response of a balanced filter (i.e., center and surround with equal normalization so that uniform illumination did not produce a response). Measured with spatiotemporal white noise, the surround is reported to be somewhat weaker than the center (7). We omitted this, because the balanced center-surround (contrast) component of filter responses dominates the information content of large arrays (10).
Information in the single-cell response was modeled by recognizing that the limited dynamic range and response noise together lead to an effectively finite number of signaling levels (firing rates). Larger receptive fields sum over more cones, and hence, the signal to noise ratio should grow as the square root of the number of summed elements (i.e., square root of the receptive-field area) (10, 36, 37). Hence, we took the number of signaling levels in the ON and OFF channels to be lON, OFF = βON, OFF (AON, OFF)1/2, where AON, OFF is the receptive-field area and β is a measure of the intrinsic signal to noise ratio of the channel. Taking the ON and OFF arrays to be evenly spaced, lON, OFF = βON, OFF (A/NON, OFF)1/2, where A is the fixed area of the retinal patch being considered.
For simplicity, we took all signaling levels to be equally used. Similar results follow for any reasonable pattern of use (e.g., an exponential distribution of firing rates). With this simple encoding model, applying Shannon's formula for response entropy gave 
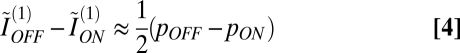
 and was similar for OFF cells, where pON is the probability of encountering a positive contrast in natural scenes and pOFF = 1 – pON is the probability of negative contrasts. We assumed that the model receptive field responded to its input so that the entropy of the output was informative about the input. Loss of information to noise was included in the discretization of the signaling levels. We assumed that noise in each response level is roughly the same, and therefore, the frequency of finding each equal noise-response level is given by pON/lON. Thus,
  measured the mutual information between the input and the ON receptive-field output.
The last step was to estimate mutual information M shared between ON and OFF arrays. To do this, we observed that ON and OFF cells with disjoint receptive fields have uncorrelated responses and hence, do not share any information (10). However, when ON and OFF receptive fields overlap, their responses are anticorrelated. Thus, to approximate the interaction of ON and OFF arrays, we supposed that if an ON cell fails to respond, the overlapping population of OFF cells will do so and vice versa. Thus, the entropy of nonresponse of ON cells (the pOFF log pOFF term in  duplicates information that is already conveyed by the OFF array and vice versa. Thus, the mutual information between the ON and OFF arrays could be subtracted by simply dropping this term. This gave
with  with lON, OFF as above. This simple expression captured the essential features of contrast encoding by retinal ganglion cells.
In the Optimal Mosaic, ON and OFF Elements Carry Similar Information.
The balance between OFF and ON elements that maximizes contrast information can be evaluated by maximizing I with respect to NON while holding the retinal area A and the number of mosaic elements N fixed: (∂I/∂NON)A,N = 0. This gave
 |
that characterized the optimal mosaic of OFF and ON elements.
To understand the meaning of this expression, observe that ON and OFF ganglion cells differ only slightly in their receptive-field overlap (6, 10), and as a consequence, the difference in their redundancy is negligible. Thus, taking ρON ≈ ρOFF,
 |
in the optimal mosaic. The left-hand side is the difference in independent information encoded by individual OFF and ON elements (∼1.5 bits each in the optimal mosaic with typical parameters) (Fig. 5A) when pOFF – pON ∼ 0.1 (Fig. 2D). Thus, the difference in information between an ON–OFF pair, divided by the total, is ∼0.05/3 = 1.5%. In other words, in the optimal mosaic, individual OFF and ON elements convey similar amounts of information.
Fig. 5.

The excess of OFF cells is robust to variations in receptive field and noise properties. (A) For a range of negative contrast excesses (pOFF − pON), the optimal mosaic has more OFF cells. Here, ON and OFF channels are taken to have the same intrinsic SNR and redundancy (μ = γ = 0), and the baseline number of signaling levels is l = 10. (B) For a range of negative contrast excesses (pOFF − pON) and number of signaling levels (l), the optimal mosaic has more OFF cells. Again, μ = γ = 0. (C) The optimal mosaic has more OFF cells across a range of relative differences in intrinsic SNR (dotted lines, x axis = μ) and redundancy (solid lines, x axis = γ). Here, we took l = 10.
Mosaics with More OFF Elements Maximize Contrast Information.
To evaluate the fraction of OFF elements in the optimal mosaic, we recalled that the signal-to-noise ratios (SNRs) of ON and OFF receptive fields and redundancies within their arrays are similar (10, 27). Thus, it was helpful to define parameters that characterized both the average of the number of signaling levels in ON and OFF channels, l = [(βON + βOFF)/2][A/(N/2)]1/2, and the fractional difference in their redundancy and intrinsic SNR, γ = (ρOFF – ρON)/(ρOFF + ρON) and μ = (βOFF – βON)/(βOFF + βON). Solving the optimization condition (3) to linear order in the small parameters γ and μ gave the optimal OFF fraction NOFF/N = (1/2) + (pOFF – pON) [log(2l) – 3/2] + μ + γ [log(2l) – 1/2]. Assuming similar intrinsic SNRs and redundancies in the ON and OFF pathways (μ ≈ 0; γ ≈ 0), ∼10 signaling levels (l ∼10) (27) and pOFF – pON ∼ 0.1 (Fig. 2) then gives
This ratio is in the measured range.
Receptive-field profiles and overlap, and noisiness of OFF and ON cells might vary between cell types and species. This could change the fraction of negative contrast responses (pOFF), the relative redundancy (γ), the relative SNR (μ), and the average numbers of signaling levels (l). Hence, we varied these parameters in the model and asked how they affect the optimal OFF fraction. We found that a significant excess of OFF elements persists in the optimal array over substantial variations of the parameters [5% ≤ pOFF ≤ 20%, 5 ≤ l ≤ 15, and 20% variations in relative redundancy (γ) and relative SNRs (μ) of OFF an ON cells] (Fig. 5).
Discussion
All vertebrate retinas rectify cone signals into OFF and ON circuits. An explanation for this architecture is that it doubles the dynamic range (38). It may also be metabolically efficient, because both types respond sensitively to small variations while maintaining low firing rates. Maintaining low rates is important, because information rates increase sublinearly with the spike rate (39) and energy cost and axonal volume increase supralinearly with firing rate (39–41). Thus, space and energy efficiency (bits/μm3; bits/ATP) improve when contrast signals are rectified into lower rate ON and OFF channels.
Our results suggest another reason to use separate OFF and ON mosaics: to allow structural adaptation to natural scenes. OFF arbors, being smaller, are nearly 2-fold more numerous than ON arbors (Fig. 1), a difference that holds across cell types of markedly different spatial and temporal bandwidths and across species. This hinted that OFF and ON arrays might be adapted to match an excess of dark contrasts in natural scenes. That is what we found (Figs. 2 and 3). Given that dark and bright contrasts in natural images distribute unequally, separate circuits matched to the characteristic distributions will use the retina's resources more efficiently (Fig. 5).
Because our concise model captures key general features of the ganglion-cell contrast response, these results should generalize to more detailed models also. We omitted the maintained firing rate and resulting gentler (i.e., less rectifying) nonlinearity reported for ON cells in some species [primate (7) and guinea pig (34)], because, although it imbues an ON cell with a small OFF response, we measured that this component contributes negligibly to contrast detection by an ideal observer (10). This occurred because the OFF response of ON cells, arising from a depression of the maintained firing rate, was noisy and largely redundant with the stronger response in the OFF array. Our model also omitted a firing threshold beyond ON/OFF rectification. Including it would have little effect, because the key result is driven by the excess of negative contrasts, and this persists even in the presence of a threshold (result for a 1% threshold shown in Fig. 2). Within our model, the predicted excess of OFF cells would be reversed if OFF cells had a substantially higher threshold than ON cells or if ON cells devoted a significant fraction of their bandwidth to OFF responses, but neither of these matches measurements.
We showed that optimal mosaics are organized so that individual OFF and ON elements transmit equal amounts of information. This correlates with our finding that OFF and ON dendritic arbors, despite a 2-fold difference in retinal area, collect equal numbers of excitatory synapses (Fig. 1 B and C). Perhaps a simple principle connects a concrete fact of neuroanatomy with the abstract concept of information: equal synapses for equal bits.
Materials and Methods
Anatomy.
Retinas were harvested from adult guinea pigs and prepared for anatomy in accordance with guidelines of the University of Pennsylvania and National Institutes of Health (13). Ganglion cells were identified by staining with Syto 13, and the larger somas were injected with DiI (1% dissolved in absolute ethanol). Injected cells were imaged by confocal microscopy (40× oil-immersion objective). To prevent shrinkage, retina was kept moist (0.1 M phosphate buffer), and to prevent compression, a spacer (∼200 μm) was placed between the slide and coverslip. ON brisk-transient cells had large somas (15–20 μm), which were multipolar because of dendrites exiting laterally, vs. OFF brisk-transient cells, which were smoothly rounded because of dendrites exiting vertically. Cell type was validated by dendritic morphology and stratification depth.
Physiology.
Extracellular spikes were obtained from brisk transient ganglion cells in vitro, responding to photopic white noise projected from a CRT monitor at 60 Hz (10). Cells were selected based on soma size (15–20 μm) and transient response to a light flash. White noise was a 16 × 16 checkerboard (75 × 75 μm per patch) in a gray background. The intensity of each patch was updated on alternate monitor frames according to a random binary sequence.
Setting Response Thresholds.
To set a k% contrast threshold (∼1% to model measurements) (25), we first measured a model ganglion-cell filter's center radius from its zero-crossing. Then, we made a spot of this radius that was k% brighter than background. The response of the divisively normalized filter centered on this spot was set as the threshold for model cell response.
Artificial Image Construction.
Gaussian noise images (Fig. 3A) had pixels drawn independently from a Gaussian (with an offset to avoid negative intensities). Natural noise images (Fig. 3B) had pixels drawn from the natural-intensity distribution (24). Pink noise (Fig. 3C) was constructed by convolving Gaussian noise with a 1/f filter. Natural pink noise (Fig. 3D) remapped intensities in pink noise to the natural-intensity distribution while preserving pink-noise correlations.
Naturalistic Time-Series Construction.
Fixational time series were random walks through natural images—at each time step, the nearest neighbor of the current pixel was randomly selected. To match the ∼0.5°/s velocity of fixational eye movements (42) and because image pixels were separated by 1/60°, we required the expected displacement of the random walk to be 30 pixels/s. A random walk of N steps has a mean displacement of  —thus, we required N ∼ 900 and took each time step to be 1/900 s.
Supplementary Material
Acknowledgments
We thank B. Backus and R. Smith for discussions and S. Fina for help with figures. We were supported by National Institutes of Health Grant RO1 EY08124 (to B.G.B., Y.-H.K., and P.S.), National Science Foundation Grant IBN-0344678 (C.P.R. and V.B.), and National Institutes of Health Training Grants T32-07035 and T32-07128 (to C.P.R.). During this work, V.B. was the Helen and Martin Chooljian Member at the Institute for Advanced Study, Princeton and visited the Aspen Center for Physics.
Footnotes
The authors declare no conflict of interest.
*This Direct Submission article had a prearranged editor.
This article contains supporting information online at www.pnas.org/lookup/suppl/doi:10.1073/pnas.1005846107/-/DCSupplemental.
References
- 1.Zemon V, Gordon J, Welch J. Asymmetries in ON and OFF visual pathways of humans revealed using contrast-evoked cortical potentials. Vis Neurosci. 1988;1:145–150. doi: 10.1017/s0952523800001085. [DOI] [PubMed] [Google Scholar]
- 2.Chubb C, Landy MS, Econopouly J. A visual mechanism tuned to black. Vision Res. 2004;44:3223–3232. doi: 10.1016/j.visres.2004.07.019. [DOI] [PubMed] [Google Scholar]
- 3.Jin JZ, et al. On and off domains of geniculate afferents in cat primary visual cortex. Nat Neurosci. 2008;11:88–94. doi: 10.1038/nn2029. [DOI] [PMC free article] [PubMed] [Google Scholar]
- 4.Ahmad KM, Klug K, Herr S, Sterling P, Schein S. Cell density ratios in a foveal patch in macaque retina. Vis Neurosci. 2003;20:189–209. doi: 10.1017/s0952523803202091. [DOI] [PubMed] [Google Scholar]
- 5.Morigiwa K, Tauchi M, Fukuda Y. Fractal analysis of ganglion cell dendritic branching patterns of the rat and cat retinae. Neurosci Res Suppl. 1989;10:S131–S139. doi: 10.1016/0921-8696(89)90015-7. [DOI] [PubMed] [Google Scholar]
- 6.Devries SH, Baylor DA. Mosaic arrangement of ganglion cell receptive fields in rabbit retina. J Neurophysiol. 1997;78:2048–2060. doi: 10.1152/jn.1997.78.4.2048. [DOI] [PubMed] [Google Scholar]
- 7.Chichilnisky EJ, Kalmar RS. Functional asymmetries in ON and OFF ganglion cells of primate retina. J Neurosci. 2002;22:2737–2747. doi: 10.1523/JNEUROSCI.22-07-02737.2002. [DOI] [PMC free article] [PubMed] [Google Scholar]
- 8.Dacey DM, Petersen MR. Dendritic field size and morphology of midget and parasol ganglion cells of the human retina. Proc Natl Acad Sci USA. 1992;89:9666–9670. doi: 10.1073/pnas.89.20.9666. [DOI] [PMC free article] [PubMed] [Google Scholar]
- 9.Wässle H, Peichl L, Boycott BB. Morphology and topography of on- and off-alpha cells in the cat retina. Proc R Soc Lond B Biol Sci. 1981a;212:157–175. doi: 10.1098/rspb.1981.0032. [DOI] [PubMed] [Google Scholar]
- 10.Borghuis BG, Ratliff CP, Smith RG, Sterling P, Balasubramanian V. Design of a neuronal array. J Neurosci. 2008;28:3178–3189. doi: 10.1523/JNEUROSCI.5259-07.2008. [DOI] [PMC free article] [PubMed] [Google Scholar]
- 11.Liu YS, Stevens CF, Sharpee TO. Predictable irregularities in retinal receptive fields. Proc Natl Acad Sci USA. 2009;106:16499–16504. doi: 10.1073/pnas.0908926106. [DOI] [PMC free article] [PubMed] [Google Scholar]
- 12.Kier CK, Buchsbaum G, Sterling P. How retinal microcircuits scale for ganglion cells of different size. J Neurosci. 1995;15:7673–7683. doi: 10.1523/JNEUROSCI.15-11-07673.1995. [DOI] [PMC free article] [PubMed] [Google Scholar]
- 13.Xu Y, Vasudeva V, Vardi N, Sterling P, Freed MA. Different types of ganglion cell share a synaptic pattern. J Comp Neurol. 2008;507:1871–1878. doi: 10.1002/cne.21644. [DOI] [PubMed] [Google Scholar]
- 14.Laughlin SB. A simple coding procedure enhances a neuron's information capacity. Z Naturforsch C. 1981;36:910–912. [PubMed] [Google Scholar]
- 15.Laughlin SB. Matching coding to scenes to enhance efficiency. In: Braddick OJ, Sleigh AC, editors. Physical and Biological Processing of Images. Berlin: Springer; 1983. [Google Scholar]
- 16.Atick JJ, Redlich AN. Towards a theory of early visual processing. Neural Comput. 1990;2:308–320. [Google Scholar]
- 17.Balasubramanian V, Sterling P. Receptive fields and functional architecture in the retina. J Physiol. 2009;587:2753–2767. doi: 10.1113/jphysiol.2009.170704. [DOI] [PMC free article] [PubMed] [Google Scholar]
- 18.Cover TM, Thomas JA. Elements of Information Theory. New York: Wiley; 1991. [Google Scholar]
- 19.Thomson EE, Kristan WB. Quantifying stimulus discriminability: A comparison of information theory and ideal observer analysis. Neural Comput. 2005;17:741–778. doi: 10.1162/0899766053429435. [DOI] [PubMed] [Google Scholar]
- 20.Dacey DM, Brace S. A coupled network for parasol but not midget ganglion cells in the primate retina. Vis Neurosci. 1992;9:279–290. doi: 10.1017/s0952523800010695. [DOI] [PubMed] [Google Scholar]
- 21.Lohmann C, Wong RO. Cell-type specific dendritic contacts between retinal ganglion cells during development. J Neurobiol. 2001;48:150–162. [PubMed] [Google Scholar]
- 22.Tadmor Y, Tolhurst DJ. Calculating the contrasts that retinal ganglion cells and LGN neurones encounter in natural scenes. Vision Res. 2000;40:3145–3157. doi: 10.1016/s0042-6989(00)00166-8. [DOI] [PubMed] [Google Scholar]
- 23.Troy JB, Oh JK, Enroth-Cugell C. Effect of ambient illumination on the spatial properties of the center and surround of Y-cell receptive fields. Vis Neurosci. 1993;10:753–764. doi: 10.1017/s0952523800005447. [DOI] [PubMed] [Google Scholar]
- 24.van Hateren JH, van der Schaaf A. Independent component filters of natural images compared with simple cells in primary visual cortex. Proc Biol Sci. 1998;265:359–366. doi: 10.1098/rspb.1998.0303. [DOI] [PMC free article] [PubMed] [Google Scholar]
- 25.Borghuis BG, Sterling P, Smith RG. Loss of sensitivity in an analog neural circuit. J Neurosci. 2009;29:3045–3058. doi: 10.1523/JNEUROSCI.5071-08.2009. [DOI] [PMC free article] [PubMed] [Google Scholar]
- 26.Dhingra NK, Kao YH, Sterling P, Smith RG. Contrast threshold of a brisk-transient ganglion cell in vitro. J Neurophysiol. 2003;89:2360–2369. doi: 10.1152/jn.01042.2002. [DOI] [PubMed] [Google Scholar]
- 27.Dhingra NK, Smith RG. Spike generator limits efficiency of information transfer in a retinal ganglion cell. J Neurosci. 2004;24:2914–2922. doi: 10.1523/JNEUROSCI.5346-03.2004. [DOI] [PMC free article] [PubMed] [Google Scholar]
- 28.Ratliff CP. Philadelphia, PA: University of Pennsylvania; 2007. Toward a theory of the functional organization of the retina. PhD dissertation. [Google Scholar]
- 29.Burkhardt DA, Fahey PK, Sikora MA. Natural images and contrast encoding in bipolar cells in the retina of the land- and aquatic-phase tiger salamander. Vis Neurosci. 2006;23:35–47. doi: 10.1017/S0952523806231043. [DOI] [PubMed] [Google Scholar]
- 30.Richards WA. Lightness scale from image intensity distributions. Appl Opt. 1982;21:2569–2582. doi: 10.1364/AO.21.002569. [DOI] [PubMed] [Google Scholar]
- 31.Field DJ. Relations between the statistics of natural images and the response properties of cortical cells. J Opt Soc Am A. 1987;4:2379–2394. doi: 10.1364/josaa.4.002379. [DOI] [PubMed] [Google Scholar]
- 32.van Hateren JH. Processing of natural time series of intensities by the visual system of the blowfly. Vision Res. 1997;37:3407–3416. doi: 10.1016/s0042-6989(97)00105-3. [DOI] [PubMed] [Google Scholar]
- 33.Benardete EA, Kaplan E. The dynamics of primate M retinal ganglion cells. Vis Neurosci. 1999;16:355–368. doi: 10.1017/s0952523899162151. [DOI] [PubMed] [Google Scholar]
- 34.Zaghloul KA, Boahen K, Demb JB. Different circuits for ON and OFF retinal ganglion cells cause different contrast sensitivities. J Neurosci. 2003;23:2645–2654. doi: 10.1523/JNEUROSCI.23-07-02645.2003. [DOI] [PMC free article] [PubMed] [Google Scholar]
- 35.Gollisch T, Meister M. Modeling convergent ON and OFF pathways in the early visual system. Biol Cybern. 2008;99:263–278. doi: 10.1007/s00422-008-0252-y. [DOI] [PMC free article] [PubMed] [Google Scholar]
- 36.Derrington AM, Lennie P. Spatial and temporal contrast sensitivities of neurones in lateral geniculate nucleus of macaque. J Physiol. 1984;357:219–240. doi: 10.1113/jphysiol.1984.sp015498. [DOI] [PMC free article] [PubMed] [Google Scholar]
- 37.Hemilä S, Lerber T, Donner K. Noise-equivalent and signal-equivalent visual summation of quantal events in space and time. Vis Neurosci. 1998;15:731–742. doi: 10.1017/s0952523898154123. [DOI] [PubMed] [Google Scholar]
- 38.Sterling P. How retinal circuits optimize the transfer of visual information. In: Chalupa LM, Werner JS, editors. The Visual Neurosciences. Cambridge, MA: MIT Press; 2004. pp. 234–259. [Google Scholar]
- 39.Koch K, et al. How much the eye tells the brain. Curr Biol. 2006;16:1428–1434. doi: 10.1016/j.cub.2006.05.056. [DOI] [PMC free article] [PubMed] [Google Scholar]
- 40.Attwell D, Laughlin SB. An energy budget for signaling in the grey matter of the brain. J Cereb Blood Flow Metab. 2001;21:1133–1145. doi: 10.1097/00004647-200110000-00001. [DOI] [PubMed] [Google Scholar]
- 41.Perge JA, Koch K, Miller R, Sterling P, Balasubramanian V. How the optic nerve allocates space, energy capacity, and information. J Neurosci. 2009;29:7917–7928. doi: 10.1523/JNEUROSCI.5200-08.2009. [DOI] [PMC free article] [PubMed] [Google Scholar]
- 42.Olveczky BP, Baccus SA, Meister M. Segregation of object and background motion in the retina. Nature. 2003;423:401–408. doi: 10.1038/nature01652. [DOI] [PubMed] [Google Scholar]
Associated Data
This section collects any data citations, data availability statements, or supplementary materials included in this article.