

Abstract
The development of epilepsy is often associated with marked changes in central nervous system cell structure and function. Along these lines, reactive gliosis and granule cell axonal sprouting within the dentate gyrus of the hippocampus are commonly observed in individuals with temporal lobe epilepsy (TLE). Here we used the pilocarpine model of TLE in mice to screen the proteome and phosphoproteome of the dentate gyrus to identify molecular events that are altered as part of the pathogenic process. Using a two‐dimensional gel electrophoresis‐based approach, followed by liquid chromatography‐tandem mass spectrometry, 24 differentially expressed proteins, including 9 phosphoproteins, were identified. Functionally, these proteins were organized into several classes, including synaptic physiology, cell structure, cell stress, metabolism and energetics. The altered expression of three proteins involved in synaptic physiology, actin, profilin 1 and α‐synuclein was validated by secondary methods. Interestingly, marked changes in protein expression were detected in the supragranular cell region, an area where robust mossy fibers sprouting occurs. Together, these data provide new molecular insights into the altered protein profile of the epileptogenic dentate gyrus and point to potential pathophysiologic mechanisms underlying epileptogenesis.
Keywords: dentate gyrus, epilepsy, granule cell, pilocarpine, status epilepticus
INTRODUCTION
Seizures are the result of hypersynchronous neuronal activity. If the seizures persist for an extended period (tens of minutes) it is commonly defined as status epilepticus (SE), a life‐threatening condition that can result in permanent pathological alterations in brain structure and function 15, 48. One potential result of SE is the development of temporal lobe epilepsy (TLE). In addition to spontaneous seizures, depression and learning and memory deficits are comorbid symptoms of TLE 7, 18.
One common and profound pathological feature of TLE is the formation of recurrent granule cell axonal collaterals. This aberrant form of synapse plasticity allows for excitatory synaptic drive between granule cell neurons of the dentate gyrus 25, 56. It has been suggested that these new recurrent connections recruit granule cells to partake in a synchronous firing pattern and thereby enhance their capacity to contribute to seizure activity (65). Indeed, electrophysiological studies have shown that mossy fiber synaptic reorganization facilitates epileptic discharges 19, 33. Hence, insights into the changes in protein expression patterns that underlie seizure‐induced structural remodeling may provide important information about the disease process. To this end, we endeavored to examine the protein profile (ie, proteome) of the epileptic dentate gyrus.
Proteomics, the large‐scale study of proteins, is a powerful state‐of‐the‐art tool for investigating the molecular mechanisms underlying neuronal physiology and pathophysiology 23, 42. For example, the use of proteomic approaches has identified novel biomarkers for monitoring the progression of a number of neurodegenerative disorders (23). Unlike genomics and transcriptomics, proteomics is capable of profiling posttranslational protein modifications such as phosphorylation, as well as splicing‐dependent alterations in protein expression patterns. These are important issues, given that many of the unique functional features that define a cell phenotype result from posttranslational mRNA and protein modifications. Given this, key insights into central nervous system (CNS) function and dysfunction may be markedly enhanced by proteomic‐based screening approaches. Indeed, a number of proteomic‐based studies using human tissue and animal models have profiled epilepsy‐associated changes in protein expression patterns 20, 39, 62, 73. However, there has yet to be proteomic‐based examination that specifically focuses on the epileptic dentate gyrus.
Here, we performed global protein analysis using two‐dimensional gel electrophoresis (2‐DE), coupled with liquid chromatography‐tandem mass spectrometry (LC‐MS/MS), to examine the changes in protein abundance and protein phosphorylation state in the epileptic dentate gyrus. The data presented here identify a large and functionally divergent set of proteins that are significantly altered by and may contribute to the epileptic process.
MATERIALS AND METHODS
Pilocarpine‐induced SE
Male C57Bl/6 mice (8–9 weeks, Harlan, Indinapolis, IN, USA) initially received an intraperitoneal (i.p.) injection of atropine methyl nitrate (1 mg/kg in saline, Sigma, St. Louis, MO, USA), then 30 minutes later, SE was elicited with an i.p. injection of pilocarpine (325 mg/kg in saline, Sigma). SE was defined as a continuous motor seizure persisting for greater than 3 h. Control animals were injected with atropine methyl nitrate (1 mg/kg) and then with saline, instead of pilocarpine. The Ohio State University Animal Care and Use Committee approved all animal procedures.
Electroencephalogram (EEG) recording
Mice were anesthetized with an i.p. injection of ketamine hydrochloride (91 mg/mL) and xylazine (9 mg/mL) and then placed in a stereotax (Kopf Instruments, Tujunga, CA, USA) and bipolar recording electrodes (Plastics One, Roanoke, VA, USA) were surgically implanted: one electrode was positioned in area CA1 of the hippocampus (coordinates: −1.8 mm posterior from bregma: +1.1 mm lateral from midline and −1.7 mm dorsoventral) and a reference electrode was positioned in the cortex (coordinates: −2.8 mm posterior from bregma: +1.1 mm lateral from midline and −1.2 mm dorsoventral). The grounding wire was anchored to the skull screw. After recovery for 10 days, pilocarpine‐induced SE was evoked as described above. EEG activity was recorded using the BIOPAC MP150 data acquisition and analysis system (Biopac Systems, Santa Barbara, CA, USA).
Timm staining
Four weeks after SE induction mice were anesthetized with a cocktail of ketamine (150 mg/kg)/xylazine (30 mg/kg) and then transcardially perfused with 4% paraformaldehyde in 0.1 M phosphate buffer. Brains were then quickly removed and then cut into 700‐µm coronal sections with an oscillating tissue slicer (OTS 2000; Electron Microscopy Sciences, Fort Washington, PA, USA). Sections were then incubated (30 minutes) in 0.1% sodium sulfide and then fixed (1 h) in 3% gluteraldehyde. After cryoprotection (overnight) with 30% sucrose in phosphate buffer saline (PBS), sections were frozen in OCT embedding media and cut into 30‐µm sections with a cryotome (Thermo Fisher Scientific, Waltham, MA, USA). After mounting onto gelatin‐coated slides, sections were submerged (45 minutes, 26°C) in citrate buffer (2.71 g of citric acid and 2.35 g of sodium citrate in 100 mL) containing 30% of arabic gum, 0.85% hydroquinone and 0.11% of silver lactate. After washing (45 minutes) in water, sections were dried and mounted with Permount (Fisher Scientific).
Immunohistochemistry
Mice were transcardially perfused as described above. Brains were then postfixed (4 h at 4°C) in 4% paraformaldehyde and cryoprotected with 30% sucrose. Coronal sections (30 µm) through the dorsal hippocampus (stereotaxic coordinate anterior/posterior: −1.40 ∼−2.20 mm) were prepared using a cryotome. For immunohistochemistry, sections were washed with PBS and incubated (20 minutes) with 0.3% hydrogen peroxide to eliminate endogenous peroxidase activity. Sections were then blocked with 10% normal goat serum in PBS, followed by overnight incubation at 4°C with the mouse anti‐NeuN antibody (1:2000, Millipore, Billerica, MA, USA), α‐synuclein (1:1000, Santa Cruz Biotechnology, CA, USA) or goat polyclonal antibody against profilin 1 (1:1000, Santa Cruz Biotechnology). Sections were then processed using the ABC staining method (Vector Laboratories, Burlingame, CA, USA), and nickel‐intensified diaminobenzidine (Vector Laboratories) was used to visualize the signal. Photomicrographs (20× magnification) were captured from two coronal sections through the hippocampus using a 16‐bit digital camera (Micromax YHS 1300; Princeton Instruments, Trenton, NJ, USA) mounted on a Leica DM IRB microscope (Leica, Nussloch, Germany).
Ratiometric densitometric analysis was used to quantify profilin 1 expression in the supragranular region of the molecular layer. To this end, 20× images of the dentate gyrus were imported into ImageJ software (http://rsb.info.nih.gov/ij) and digital circles (Φ50 pixels) were placed in the medial, mid, and lateral supragranular region and the mean labeling intensity was determined using a 0–255 unit, 8‐bit scale. Next, the three digital circles were moved dorsally to the outer third of the molecular layer, and the mean labeling intensity was determined. Intensity values were background corrected by subtracting the intensity values in the lateral ventricle, and ratiometric values were generated by dividing the intensity value within the supragranual region by the value in the outer molecular layer. Data are presented as the mean ± SEM (standard error of the mean), and significance was assessed using a two‐tailed Student's t‐test.
Fluoro‐Jade B
Fluoro‐Jade B staining was performed as described in Choi et al (17). Briefly, 40‐µm thick coronal sections were mounted onto gelatin‐coated slides, dried, and then treated to sequential 95% and 70% ethanol washes (2 minutes each). Tissue was then incubated (5 minutes) in 0.06% potassium permanganate solution and then incubated (10 minutes) with Fluoro‐Jade B solution (0.0004% in 0.1% acetic acid solution, Millipore). After washing with distilled water, sections were dried and covered with DPX (Electron Microscopy Sciences, Hatfield, PA, USA).
F‐actin labeling
Thirty‐µm thick tissue sections were prepared and fixed as described above, permeabilized (10 minutes) with 0.1% Triton X‐100 in PBS and incubated (15 minutes) with 15 nM rhodamine phalloidin (Molecular Probes, Eugene, OR, USA). Tissues were then incubated (1 h) with the nuclear stain DraQ (1 µM; BioStatus Limited, UK) and washed 3× in PBST. Sections were then air dried, mounted and coverslipped with Cytoseal™ (Richard‐Allan Scientific, Kalamazoo, MI, USA). Confocal images were acquired using a Zeiss (Oberkochen, Germany) 510 Meta confocal microscope. Quantitative analysis of actin polymerization was performed as described above for profilin 1.
Western blot analysis
Seven hundred‐µm thick coronal brain sections were prepared as described above. Sections containing the dorsal hippocampus were then frozen on dry ice and dentate gyri were microdissected. The outer molecular layer served as the dorsal, ventral and medial dissection boarders. For the lateral boarder, tissue was resected such that the medial CA3 excitatory cell layer was not included in the isolation (Figure 3). Tissue was homogenized in RIPA buffer [50 mM Tris–HCl pH7.4, 150 mM NaCl, 1% Triton X‐100, 0.1% SDS, 0.5% sodium deoxycholate, 2 mM EDTA, 50 mM sodium NaF, 200 µM sodium vanadate supplemented with protease inhibitor cocktail tablets (Roche, Mannheim, Germany)]. Fifteen micrograms of total protein per sample was loaded onto a 12% SDS‐PAGE gel, electrophoresed and then transferred to polyvinylidine difluoride membranes (Immobilon‐P, Millipore, Bedford, MA, USA) using standard procedures. Following blocking with 5% (w/v) powdered milk, membranes were incubated with a rabbit polyclonal antibody against α‐synuclein (1:1000, Santa Cruz Biotechnology) and then with a horseradish peroxidase‐conjugated secondary antibody. Labeling was detected using Western Lightning Chemiluminescence Reagent (Perkin‐Elmer, Wellesley, MA, USA). Digital densitometric analysis band intensity analysis was performed with ImageJ software. For this analysis, X‐ray film images were digitally converted to negatives, and the mean band density values were quantitated using a 0–255 8‐bit scale and averaged for each group. Three biologically independent samples for the control and SE‐treatment condition were analyzed, and significance was determined via a two‐tailed Student's t‐test.
Figure 3.
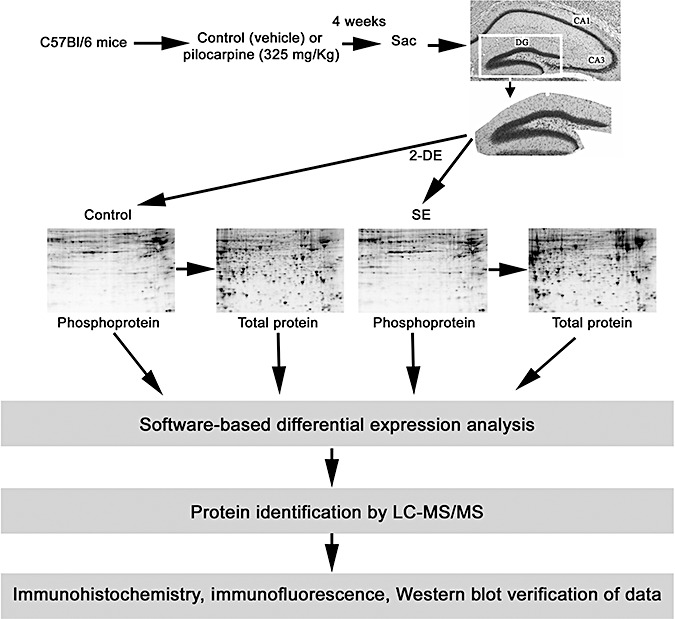
Schematic overview of the epileptogenesis paradigm and the tissue isolation and protein profiling methods. The isolated dentate gyrus (DG) was subjected to 2‐D electrophoresis and all gels were sequentially stained with Pro‐Q DPS, SYPRO Ruby and Coomassie Blue dye. PDQuest software was used to match spots and analyze expression patterns. Selected protein spots were identified by LC‐MS/MS and verified using immunohistochemical and Western blotting approaches. The representative brain section was stained with cresyl violet: CA3 and CA1 cell layers are noted.
Mass spectrometry: protein sample preparation
Dentate gyri were dissected from 700‐µm thick coronal brain sections as described above. Dentate gyri (n = 8 for the control and for the SE condition) were homogenized in 150 µL lysis buffer [40 mM Tris‐HCl, 8 M urea, 2% (w/v) CHAPS with complete protease inhibitor cocktail tablets (Roche)]. The homogenates were sonicated and centrifuged. Protein supernatants were purified using the ReadyPrep 2‐D cleanup kit (Bio‐Rad, Hercules, CA, USA) according to the manufacturer's instructions and resolved in rehydration buffer [8 M urea, 2% (w/v) CHAPS, 50 mM dithiothreitol (DTT), 0.2%(w/v) Bio‐Lyte 3/10 ampholyte, and 0.002% (w/v) bromophenol blue]. Protein concentrations were determined using an RC/DCTM protein assay (Bio‐Rad) prior to 2‐DE analysis. The experimental design for the proteomic analysis is schematically presented in Figure 3.
2‐DE and image analysis
Protein separation, detection and identification was performed as described (49) with slight modifications. Briefly, 11‐cm (pH 3‐10) IPG strips (Bio‐Rad) were rehydrated with approximately 250 µg of protein. Isoelectric focusing was carried out in a Protean Bio‐Rad IEF cell. The IEF running conditions were 400 V for 20 minutes, then ramping to 8000 V for 2.5 h and finally holding at 8000 V until reaching a total of 30 000 Vh. The strips were equilibrated and 2‐DE was then performed at 200 V for 1 h on an 8–16% polyacrylamide SDS gel. Four biologically independent 2‐D gels were run for each condition. All gels were sequentially stained with Pro‐Q diamond phosphoprotein stain (Pro‐Q DPS) (Molecular Probes‐Invitrogen, Eugene, OR, USA), and SYPRO Ruby dye (Molecular Probes‐Invitrogen) for total proteins, according to the manufacturer's instructions. Briefly, all fixed gels were washed with water (3 × 10 minutes), incubated with Pro‐Q DPS (90 minutes), destained with destaining solution (Molecular Probes‐Invitrogen) (3 × 30 minutes) and then washed again with water (2 × 5 minutes). Following image scanning, all Pro‐Q DPS stained gels were incubated (overnight) with SYPRO Ruby dye and then washed with water (30 minutes) to detect total proteins. We used PeppermintStick phosphoprotein molecular weight standards (Molecular Probes), that included two phosphorylated proteins (Ovalbumin: 45.0 kDa, and bovine β‐Casein: 23.6 kDa) and four nonphosphorylated proteins (β‐galactosidase: 116.25 kDa, bovine serum albumin: 66.2 kDa, avidin: 18.0 kDa and lysozyme: 14.4 kDa). Detected phosphoprotein spots were normalized using these two phosphorylated and four nonphosphorylated proteins. All gels were scanned using a Bio‐Rad VersaDoc imaging system, and images of the same gel scanned before and after poststaining were compared and processed using PDQuest software (version 8.0.1, Bio‐Rad) as described previously (49).
Data normalization was performed using the Local Regression Model, and the relative change in protein abundance for each protein spot was calculated by determining the mean spot intensity for each condition. To this end, the PDQuest software assigned each spot an integrated optical density value, and the quantity of each spot was expressed as parts per million of the total integrated optical density. Also, all gel images were visually/manually inspected to ensure the veracity of the automated spot detection. To compare across the experimental groups, the MatchSet Tool was used to generate a composite master image and mean spot values for each experimental condition. Data were averaged from quadruplicate determinations. Relative (control vs. 4 weeks post SE) protein spot intensity was assessed via a two‐tailed unpaired Student's t‐test using SPSS Statistics 17.0 software. P < 0.05 was deemed significant, and a subset of these spots were chosen for subsequent identification. To align gels stained for phosphoproteins and for total proteins, digital gel images were loaded into Photoshop 7.0 (Adobe Systems) and the layering option was used to overlay the gels. This approach provided a clear visualization of the overlapping phosphoprotein and total protein spots.
In‐gel tryptic digestion
Protein spots of interest were excised and digested with sequencing grade modified trypsin (Promega, Madison, WI, USA) using Multiscreen Solvinert Filter Plates (Millipore, Bedford, MA, USA). Gel spots were then washed in 50% methanol/5% acetic acid for 1 h. The gel spots were dehydrated in acetonitrile then rehydrated and incubated with DTT solution (5 mg/mL in 100 mM ammonium bicarbonate) for 30 minutes prior to the addition of 15 mg/mL Iodoacetamide in 100 mM ammonium bicarbonate. The gel spots were washed again with acetonitrile and ammonium bicarbonate. After the gels were dried, the protease was driven into the gel spots by rehydrating them in 50 µL of trypsin at 20 µg/mL in 50 mM ammonium bicarbonate for 10 minutes. Twenty microliters of 50 mM ammonium bicarbonate was added to the gel spots and the mixture was incubated at room temperature overnight. Peptides were extracted with 50% acetonitrile and 5% formic acid and concentrated in a speed vac to 25 µL.
LC/MS/MS‐Nanoscale capillary LC‐MS/MS
LC/MS/MS was performed on a Thermo Finnigan LTQ mass spectrometer equipped with a nanospray source operated in positive ion mode. The LC system was an UltiMate™ Plus from LC‐Packings A Dionex Co (Sunnyvale, CA) with a Famos autosampler and Switchos column switcher. Solvent A was water containing 50 mM acetic acid and solvent B was acetonitrile. Each sample (5 µL) was first injected into the trapping column (LC‐Packings A Dionex Co) and washed with 50 mM acetic acid. The injector port was switched to inject and the peptides were eluted off the trap onto the column. A 5‐cm, 75‐µm ID ProteoPep II C18 column (New Objective, Inc., Woburn, MA, USA) was used for chromatographic separations. Peptides were eluted directly off the column into the LTQ system using a gradient of 2%–80%B over 50 minutes, with a flow rate of 300 nl/minute. The total run time was 60 minutes. The MS/MS was acquired according to standard conditions established in the laboratory. Briefly, a nanospray source operated with a spray voltage of 3 KV and a capillary temperature of 200°C was used. The scan sequence of the mass spectrometer was based on the TopTen™ method, a Thermo Scientific pre‐programmed method in Excalibur. The analysis was programmed for a full scan recorded between 350 and 2000 Da, and a MS/MS scan to generate product ion spectra to determine amino acid sequences in consecutive instrument scans of the 10 most abundant peaks in the spectrum. The collision‐induced dissociation fragmentation energy was set to 35%. Dynamic exclusion was enabled with a repeat count of 2 within 10 s, a mass list size of 200, and an exclusion duration of 350 s, the low mass width was 0.5 Da, and the high mass width was 1.5 Da.
MS data analysis
Sequence information from the MS/MS data was processed by converting the.raw data files into mascot generic format (.mgf) using an in‐house program, RAW2MZXML_n_MGF_batch (merge.pl, a Perl script). The resulting mgf files were loaded into Mascot Daemon and searched using Mascot by Matrix Science version 2.2.1 (Boston, MA, USA) against NCBInr 20060402 (3525863 sequences; 1211011241 residues). The taxonomy was limited to Rodentia (215327 sequences). The mass accuracy of the precursor ions were set to 2.0 Da given that the data were acquired on an ion trap mass analyzer and the fragment mass accuracy was set to 0.5 Da. Considered modifications (variable) were methionine oxidation and carbamidomethyl cysteine. Two missed cleavages for the enzyme were permitted. A false discovery rate (FDR) estimation was performed in order to determine a threshold score for a chosen FDR. Only proteins with a Mascot score of 50 or higher (5% probability of protein identification is incorrect) with a minimum of two unique peptides from one protein having a −b or −y ion sequence tag of five residues or better and with a higher Mascot score than the threshold score were accepted. Identified peptides and protein were checked manually to confirm the identification.
RESULTS
Pilocarpine‐induced repetitive seizure activity
EEG recording from the hippocampus confirmed that the injection of the muscarinic acetylcholine receptor agonist pilocarpine evoked high‐voltage discharges within the hippocampus (Figure 1A). This robust electrical activity over the first several hours following pilocarpine injection was concordant with the motor manifestations of SE. Even at 24 h post SE, mice exhibited frequent moderate amplitude synaptic discharges. Pilocarpine‐evoked SE actuates epileptogenesis via a well‐characterized multistage process. Hence, following the initial SE insult, animals enter a quiescent, seizure‐silent period, which typically persisted for several weeks. This period is followed by the development of spontaneous bouts of motor seizure activity; on the EEG, these bouts manifest as robust high‐voltage spike discharges (Figure 1B). At a cellular/systems level, SE drives a stereotypical pattern of pathological alterations in the hippocampus 6, 29, 69. Along these lines, Fluoro‐Jade B (a marker of cell death and dying cells) labeling at 2 days post SE revealed marked cell death within areas CA1, CA3 and the hilus (Figure 2A). Similarly, immunohistochemical staining against the neuronal nuclear antigen (NeuN) at 1 week post SE indicated a selective loss of CA1, CA3 and hilar neurons (Figure 2B). Conversely, we consistently found that the granule cell layer of the dentate gyrus was resistant to the excitotoxic effects of SE, a result that is largely consistent with the work of several other groups 6, 26, 57.
Figure 1.
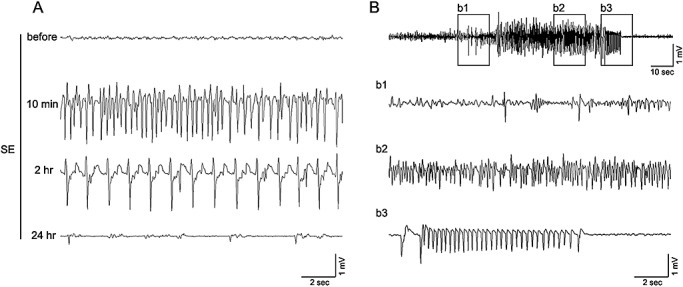
Electroencephalogram (EEG) recording from the CA1 area of the hippocampus. A. Representative EEG trace prior to the injection of pilocarpine (325 mg/kg: top trace) and 10 min, 2 h and 24 h following the onset of status epilepticus (SE). High‐voltage spike discharges can be observed at the 10 minutes and 2 h post‐SE time points; frequent lower amplitude discharges were observed at the 24 h time point. B. Representative EEG trace showing spontaneous epileptiform activity 4 weeks after pilocarpine‐evoked SE. Boxed regions (b1–b3) are presented on an expanded time scale.
Figure 2.
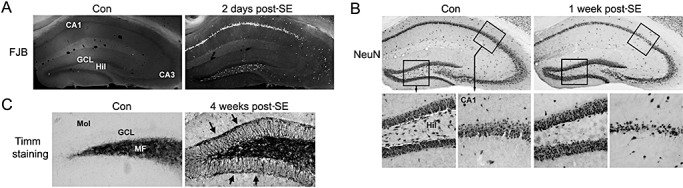
Hippocampal cell death and synaptic modification. A. Animals were sacrificed 2 days after injection with pilocarpine [2 days post status epilepticus (SE)] or saline (Con) and cell death was examined via Fluoro‐Jade B (FJB) staining. Coronal brain sections through the dorsal hippocampus revealed marked cell death within the CA1 and hilar (Hil) regions of the dentate gyrus. Limited cell death was observed in the CA3 region. Cell death was not detected in granule cell layer (GCL), nor was it detected in any hippocampal region in the control, saline‐injected, animal. MF = mossy fibers. B. Immunohistochemical staining against NeuN indicates marked loss of hippocampal CA1 neurons and hilar neurons. Mice were sacrificed 1 week post SE. C. At 4 weeks post SE, mossy fiber sprouting from the GCL was examined via Timm staining. Compared to control, saline‐injected mice, SE triggered marked synaptic outgrowth into the inner molecular layer (Mol). Arrows denote the molecular layer/GCL border (here referred to as the supragranular region).
Paralleling the development of repetitive seizure activity, prominent axonal sprouting of granule cell mossy fibers into the inner molecular layer is commonly observed 6, 13. This ∼25 micron wide band of “supragranular” mossy fibers lining the upper and lower blades of the granule cell layer is the site of new synapse formation, both between granule cells, and from granule cells to GABA‐immunoreactive interneuron dendrites (28). Consistent with this, Timm staining, which detects high levels of zinc accumulation (a marker of mossy fibers), revealed pronounced mossy fiber sprouting into this supragranular region at 4 weeks post SE (Figure 2C). Given the profound behavioral (eg, spontaneous seizure activity) and morphological (eg, mossy fiber sprouting) changes observed 4 weeks post SE, we selected this time point for our proteomic analysis. Further, given the robust morphological alterations and the limited neuronal cell loss (see the Discussion), our proteomic examination focused on the dentate gyrus.
Quantity analysis of the dentate gyrus proteome
As outlined in Figure 3, dentate tissue was isolated and then subject to 2‐D gel electrophoresis. Gels were then stained with Pro‐Q DPS, a sensitive fluorescent dye that binds noncovalently to phosphoproteins and is thus compatible with subsequent mass spectrometric analysis. Phosphoprotein spots were normalized using two phosphorylated and four unphosphorylated protein standards. Of note, this analysis cannot be used to determine the extent of protein phosphorylation (eg, single or multiple phosphorylation events). Of the approximately 440 spots detected by gel image analysis, 33 protein spots showed a significant (Student's t‐test: P < 0.05) change in phosphorylation levels. Of these, 18 spots in the SE group exhibited increased phosphorylation and 15 spots exhibited decreased phosphorylation relative to control levels. Among the 33 phosphoprotein spots, we selected 9 spots that showed a statistically significant difference in abundance between the control and epileptic tissue for identification by LC‐MS/MS (Figure 4A). Selection was based in part on the spatial isolation of the spot (thus allowing for “clear” coring) and on total protein expression (described below) that was not altered by epileptogenesis. For total protein analysis, the digital images of the gels stained for phosphoproteins and for total proteins were aligned using a digital overlay approach, which allowed for a clear visualization of overlapping phosphoprotein and total protein spots. Here, a note of caution is needed; we did not perform separate LC‐MS/MS analysis on corresponding phospho‐ and total protein spots; thus, we cannot be sure that the total and phosphoprotein spots represent the same protein. Of these nine spots, five showed enhanced phosphorylation and four showed decreased phosphorylation (Figure 5B).
Figure 4.
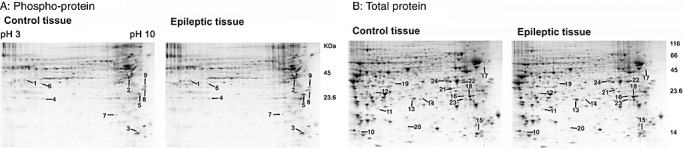
2‐DE analysis of the dentate gyrus. Representative gels from control tissue and from epileptic tissue [4 weeks post status epilepticus (SE)]. Gels were initially stained for phosphoproteins via Pro‐Q DPS (A) and then for total proteins via SYPRO ruby (B). Spots with significant changes (control vs. SE) in the phosphorylation level or total protein content were given a numerical label (noted), then isolated and sequenced. The annotated data set is presented in Table 1.
Figure 5.
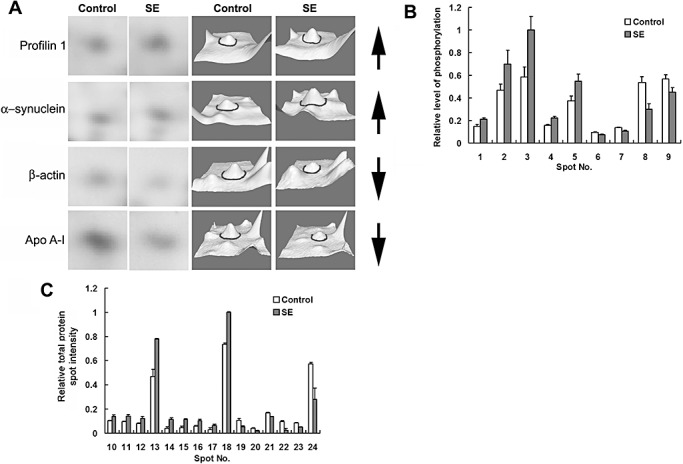
Comparative analysis of phosphoprotein and total protein levels. A. A subset of sequenced protein spots is presented in an expanded 2‐D gel view and as 3‐D surface renderings. Proteins spots of interest are centered in each panel and denoted by an encompassing circle in the renderings. Apo AI = Apolipoprotein A‐I. Arrows to the right of each row indicate whether the expression increased or decreased. B. Histograph of the relative intensity [control vs. status epilepticus (SE)] of phosphoprotein spots that exhibited significant (P < 0.05, ANOVA test) alterations in phosphorylation levels. Spot intensity values were normalized to the highest intensity spot (#3: SE), which was standardized to a value of 1. C. Histograph of the relative intensity (control vs. SE) of protein spots that exhibited a significant (P < 0.05, ANONA test) alteration in expression. Spot intensity values were normalized to the highest intensity spot (#18: SE), which was standardized to a value of 1. Data were averaged from quadruplicate determinations. Error bars denote the SEM.
Following phosphoprotein spots analysis, gels were stained with SYPRO Ruby to quantify changes in total protein levels (Figure 4B). Based on four independent tests, a total of 45 protein spots were differentially expressed (Student's t‐test: P < 0.05) between the control and the SE group. Fifteen relatively abundant and spatially resolved protein spots, including 9 of the 19 spots that increased and 6 of the 26 spots that decreased in response to SE, were selected for mass spectrometry analysis (4, 5). A change in the abundance of a subset of these spots is shown in an expanded view of the 2‐D gel images and in 3‐dimensional renderings generated via PDQuest software (Figure 5A).
Phosphoprotein and total protein identification
Bioinformatic analysis of the LC‐MS/MS data sets resulted in the identification of the 9 phosphoprotein spots and 15 total protein spots. The results are summarized in Table 1. Using the UniProt databases (http://www.uniprot.org), National Center for Biotechnology Information (http://www.ncbi.nlm.nih.gov) and a review of the primary literature, these proteins were classified into eight functional categories (Figure 6): metabolism (25%), synaptic (12.5%), energy (12.5%), structural (12.5%), stress response (12.5%), apoptosis (12.5%), transcription (8.3%) and growth (4.2%). The amino acid sequences of all constituent peptides for each protein are presented in Supplemental Table S1.
Table 1.
Identification (LC/MS/MS) of dentate gyrus proteins in the mice that changed 4 weeks post SE. Only relatively abundant proteins were selected for mass spectrometric analysis.
| Spot No. | Accession No. | Protein ID | Sequence coverage (%) | Unique Peptides† | Mowse Score‡ | % Change§ | P value | Functional category |
|---|---|---|---|---|---|---|---|---|
| Phosphoproteins more abundant 4 weeks post SE | ||||||||
| 1 | NP_080628 | Peptidylprolyl isomerase D | 52 | 2 | 779 | 42 | 0.028 | Apoptosis |
| 2 | NP_035193 | Phosphoprotein enriched in astrocytes 15 isoform 2 | 20 | 3 | 171 | 48 | 0.016 | Apoptosis |
| 3 | NP_038537 | Enolase 2, gamma neuronal | 33 | 5 | 875 | 72 | 0.030 | Energy |
| 4 | NP_033931 | Carbonic anhydrase II | 61 | 9 | 636 | 38 | 0.012 | Metabolism |
| 5 | NP_033931 | Carbonic anhydrase II | 28 | 3 | 300 | 47 | 0.036 | Metabolism |
| Phosphoproteins less abundant 4 weeks post SE | ||||||||
| 6 | NP_001028868 | Heterogeneous nuclear ribonucleoprotein D‐like | 21 | 3 | 186 | −5 | 0.031 | Transcription |
| 7 | NP_082138 | ATP synthase, H+ transporting, mitochondrial F0 complex, subunit d | 64 | 7 | 692 | −28 | 0.027 | Energy |
| 8 | NP_038636 | Nascent polypeptide‐associated complex alpha subunit isoform b | 44 | 5 | 628 | −80 | 0.015 | Transcription |
| 9 | AAA40869 | Clathryn light chain (LCA2) | 20 | 6 | 144 | −26 | 0.031 | Synaptic |
| Proteins more abundant 4 weeks post SE | ||||||||
| 10 | NP_035202 | Profilin 1 | 40 | 3 | 329 | 34 | 0.046 | Structural |
| 11 | NP_034094 | Crystallin, alpha B | 51 | 7 | 154 | 48 | 0.041 | Stress response |
| 12 | NP_033247 | Synuclein SYN2 | 22 | 2 | 400 | 56 | 0.033 | synaptic |
| 13 | NP_031479 | Peroxiredoxin 6 | 81 | 4 | 1344 | 66 | 0.007 | Stress response |
| 14 | AAA18335 | Heat shock protein HSP27 | 37 | 7 | 410 | 164 | 0.021 | Stress response |
| 15 | NP_034113 | Cathepsin D | 6 | 2 | 157 | 141 | 0.012 | Apoptosis |
| 16 | NP_081715 | ATPase, H+ transporting, lysosomal accessory protein 2 | 15 | 2 | 215 | 75 | 0.024 | Energy |
| 17 | CAA69019 | Vimentin | 52 | 2 | 1053 | 101 | 0.047 | Structural |
| 18 | EDL37773 | Ubiquitin carboxy‐terminal hydrolase L1, isoform CRA_b | 63 | 9 | 625 | 36 | 0.030 | Synaptic |
| AAH04732 | Rho GDP dissociation inhibitor (GDI) alpha* | 42 | 4 | 211 | 36 | 0.030 | Signaling | |
| Proteins less abundant 4 weeks post SE | ||||||||
| 19 | NP_525028 | Glyoxylate reductase/hydroxypyruvate reductase | 20 | 6 | 226 | −94 | 0.033 | Metabolism |
| 20 | BAB40316 | β‐actin FE‐3 | 50 | 4 | 389 | −108 | 0.020 | Structural |
| 21 | NP_064667 | Pyridoxal phosphatase | 50 | 10 | 1036 | −24 | 0.001 | Metabolism |
| 22 | NP_057878 | Crystallin, mu | 32 | 6 | 740 | −285 | 0.014 | Growth |
| 23 | NP_033822 | Apolipoprotein A‐I | 22 | 2 | 234 | −66 | 0.001 | Metabolism |
| 24 | NP_032518 | L‐lactate dehydrogenase B | 68 | 2 | 1405 | −105 | 0.048 | Metabolism |
This protein was excluded from functional category analysis (Figure 6) because another protein with a higher score had been assigned to the same spot.
The amino acid sequences of each peptide are provided in Supplemental Table 1.
Mowse score > 50 indicates identity or extensive homology (P < 0.05); higher scores indicate higher confidence of identity.
Percent change is (SE value‐control value)/control value * 100; + means an increase in protein abundance 4 weeks post SE; – means a decrease in protein abundance 4 weeks post SE.
Figure 6.
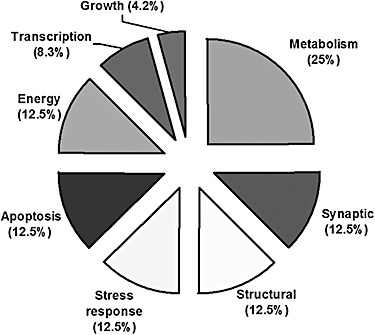
Functional classification of proteins that exhibited a significant change in expression or phosphorylation levels in the epileptic dentate gyrus (N = 24).
Validation of selected proteins
Given that one of the goals of this project was to identify proteins that may be contributing to the process of granule cell structural remodeling, we examined the expression of the synaptic/structural proteins profilin 1 and α ‐synuclein as well as the polymerization of actin. Further, analysis focused on the expression patterns within the supragranular region of the molecular layer, which is the location of robust axonal outgrowth.
We initially examined polymerized actin (ie, F‐actin) via rhodamine‐phalloidin labeling. Interestingly, relative to control mice, we noted a marked reduction in actin polymerization within the supragranule cell layer (Figure 7A). Further, compared to the outer molecular layer, the rhodamine‐phalloidin labeling within supragranule region was reduced by ∼40% in the animals rendered epileptic (Figure 7A). Together, these data suggest that the SE insult triggers a marked alteration in the polymerization state of actin within the actively remodeling supragranule region.
Figure 7.
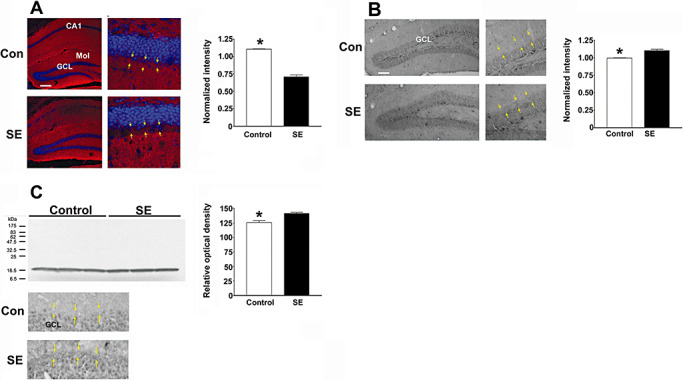
Protein validation. A. Status epilepticus (SE) causes depolymerization of F‐actin. Tissue was processed for polymerized actin via rhodamine‐phalloidin labeling (red) and for cellular nuclei with DraQ labeling (pseudocolored blue). Representative images of the dorsal hippocampus reveal a marked decreased in actin polymerization within the supragranule region of the dentate gyrus of the epileptic mouse (denoted SE). Yellow arrows in both the control and SE tissue denote the inner and outer boarders of the supragranule region. GCL = granule cell layer; Mol = molecular cell layer. Summarized data (right panel) showing the ratio of F‐actin labeling intensity in the supragranule layer vs. labeling within the outer molecular layer. The relative intensity of F‐actin was ∼30% lower in the supragranular region from mice sacrificed at 4 weeks post SE. **P < 0.001 by two‐tailed Student's t‐test. Error bars denote SEM. Scale bar: 100 µm. B. Representative immunohistochemical labeling for profilin 1. In control animals, profilin 1 expression is detected in the GCL; in mice rendered epileptic, increased profilin 1 expression is also visible within the supragranule cell region. Yellow arrows in both the control and SE animals denote the inner and outer boarders of the supragranule region. Quantitative analysis of profilin 1 expression in the supragranule region is shown to the right. Relative to control mice, the intensity of profilin 1 was elevated (∼11%) in mice sacrificed 4 weeks post SE. **P < 0.001 by two‐tailed Student's t‐test. Quantification was performed by determining the ratio of profilin 1 expression in the supragranular region to profilin 1 expression in the outer molecular cell layer. Error bars denote SEM Scale bar: 100 µm. C. Top. Western blot analysis of α‐synuclein expression in the dentate gyrus. Samples were prepared from three independent samples for each condition. Band density was digitized, and mean ± SEM optical density is presented in the panel to the right. * denotes a significant increase in α‐synuclein expression *P < 0.05. Error bars denote SEM. Please see the Methods section for a detailed description of the quantitation methods. C. Bottom. Representative immunohistochemical labeling for α‐synuclein. Relative to the control tissue (top) elevated α‐synuclein expression was observed within the supragranule regions of the mouse sacrificed 4 weeks post SE. Yellow arrows in both the control and SE animals denote the inner and outer boarders of the supragranule region.
Consistent with our proteome analysis, immunohistochemical labeling revealed that SE increased the expression of profilin 1 (Figure 7B). Profilin 1 has been shown to regulate neuronal plasticity via its effects on actin polymerization (5). An ∼11% increase in profilin 1 expression was observed in the supragranular layer of the dentate gyrus, corresponding with the location of decreased F‐actin expression (Figure 7B).
Lastly, we examined the expression of α‐synuclein in the epileptic dentate gyrus. α‐Synuclein is highly expressed in presynaptic nerve terminals and has been shown to regulate neurotransmitter release 10, 54. Western analysis of dentate lysates revealed that SE triggered a 12.8% increase in α‐synuclein expression. Further, immunohistochemical analysis detected an upregulation of α‐synuclein within the supragranule region of the dentate gyrus (Figure 7C). Together, these data lend support to our proteomic analysis and point to significant protein alterations resulting from mossy fiber sprouting.
DISCUSSION
The goal of this study was to begin to identify the protein profile of the epileptic dentate gyrus. There were two principal reasons why the examination was limited to the dentate gyrus. Firstly, the granule cell layer of the dentate gyrus is largely resistant to pilocarpine‐induced cell death. This contrasts with the other excitatory cell layers of the hippocampal trisynaptic circuit (ie, area CA3 and CA1), where extensive cell death occurs. Hence, if analysis were extended to the entire hippocampus, the loss of CA3 and CA1 neurons would markedly complicate data interpretation. However, it should be noted that SE does result in the loss of dentate hilar interneurons 9, 27. Given that the hilus was collected as part of our proteomic analysis of the dentate gyrus, one must interpret the protein data sets presented here (particularly those proteins whose signal decreased following SE) with caution. Secondly, granule cells of the dentate gyrus exhibit profuse axonal branching. This sprouting phenomenon is often associated with TLE and is thought to contribute to the epileptogenic process. Thus, we reasoned that an examination that focused on the synaptically reorganized dentate gyrus might provide important molecular insights into this aberrant form of synaptic plasticity. Below, we highlight the physiological role and potential significance of several of the identified proteins.
Cell structure proteins
Our proteomic analysis detected three structural proteins with altered expression: β‐actin, profilin 1 and vimentin. Given that structural remodeling was of particular interest, we decided to further our analysis of β‐actin by examining relative levels of actin polymerization. Using the rhodamine‐phalloidin method, our results showed that in the epileptic hippocampus, there was a significant decrease in polymerized actin within the supragranule region of the dentate gyrus. As noted, this is a principal locus of synaptic remodeling. There are several potential explanations for this marked reduction in actin polymerization. Hence, a decrease in actin polymerization may be the result of spontaneous seizure activity. Interestingly, recent work has shown that kainate‐evoked seizure activity triggers actin depolymerization in vivo (76). Another potential explanation is that the deafferentation of inner molecular layer (resulting from the SE‐induced hilar interneuron cell death) leads to a net of loss of dendritic input, and thus a decrease in actin expression/polymerization. However, using immunohisotchemical labeling, we did not detect a decrease in β‐actin expression specifically within the supragranule region (data not shown).
Profilin 1
Immunohistochemical analysis revealed that profilin 1 expression was significantly increased (∼11%) in the supragranule layer of the epileptic hippocampus. Profilin 1 is broadly expressed and essential for embryonic development 35, 72. Through its interactions with actin, and with proline‐rich cytoskeletal elements, profilin 1 has been shown to have complex and context‐specific effects on cell structure (5). Interestingly, profilin 1 expression within pre‐ and postsynaptic structures is regulated by neuronal activity (55). Our data showing elevated expression of profilin 1 in the supragranular region of the dentate gyrus raise the interesting prospect that profilin 1 may be enriched within the newly formed recurrent synaptic connections. It should also be noted that profilin 1 has been shown to regulate the migration of vascular endothelial cells (22). Given that enhanced angiogenesis is observed within the epileptic hippocampus 52, 60, this observation is of particular interest.
Synaptic activity: α‐synuclein and UCH‐L1
Western analysis revealed that α‐synuclein was increased 12.8% in the epileptic dentate gyrus. α‐Synuclein is enriched within the presynaptic nerve terminals (54) and has been shown to affect synaptic transmission via the regulation of neurotransmitter release and vesicle recycling 1, 30, 54. Although α‐synuclein dysregulation has been linked to a variety of neuropathological conditions, including Parkinson's disease 47, 53, to our knowledge, this is the first study showing that elevated α‐synuclein expression is associated with epileptogenesis.
Mass spectrometry also indicated that SE increased the expression of ubiquitin C‐terminal hydrolase L1 (UCH‐L1), a brain‐enriched member of the deubiquitinating family (UCH‐L1‐5) of enzymes by 36% (58). One of the principal functions of UCH‐L1 is to generate monomeric ubiquitin via the hydrolysis of C‐terminal ubiquityl esters: thus, UCH‐L1 plays a central role in recycling free ubiquitin from proteins that are targeted for degradation (45). UCH‐L1 has been implicated in an array of physiological and pathophysiological processes in the CNS. For example, UCH‐L1 has been shown to modulate neuronal plasticity via its ability to affect synaptic protein expression levels and in turn dendritic spine structure (11). Further, dysregulation of UCH‐L1 has been linked to a rare form of familial early‐onset Parkinson's disease, and UCH‐L1 expression is down‐regulated in idiopathic forms of Alzheimer's and Parkinson's disease (16). Interestingly, UCH‐L1 regulates the expression and thus neurotoxicity α‐synuclein 50, 75. Given the noted upregulation in α‐synuclein following SE, it is tempting to posit that the increase in UCH‐L1 levels may serve, in part, as a neuroprotective response that limits α‐synuclein‐mediated pathology.
Metabolisms
Our data also revealed that SE altered the expression of a large group of metabolic enzymes, including carbonic anhydrase II, pyridoxal phosphatase, glyoxylate reductase/hydroxypyruvate reductase (GRHPR) and gamma neuronal specific enolase 2 (NSE 2).
Carbonic anhydrase, which catalyzes the reversible hydration of carbon dioxide, plays numerous physiological roles in the central nervous systems (67), including the regulation of ion homeostasis (8), production of cerebrospinal fluid and the regulation of GABAergic signaling (61). Here, we found that carbonic anhydrase II phosphorylation was enhanced in the epileptic hippocampus. Interestingly, a number of studies have linked altered carbonic anhydrase activity with epilepsy 3, 71. In line with this, carbonic anhydrase inhibitors, such as acetazolamide, are used for the management of epilepsy; whether an increase of carbonic anhydrase II phosphorylation contributes to the epileptic process is not known. A final note, carbonic anhydrase II expression in the hippocampus (area CA1) has been shown to be acutely elevated following kaninic acid‐induced SE (32).
SE also led to an elevation in the phosphorylation of the glycolytic isoenzyme gamma NSE 2. NSE is a marker of neuronal damage following an array of pathological brain injuries, including SE 63, 74, and can be used as an index of neurologic insult severity (21). Our results raise the possibility that an increase in NSE phosphorylation may also be a biomarker of neuronal stress and cellular toxicity.
A 141% increase in the expression of the catabolic enzyme cathepsin D was also of significant interest. Cathepsin D is a lysosomal aspartic protease that plays a key role in macromolecular degradation via the autophagocytotic/lysosomal pathway. In addition, cathepsin D has been shown to interact with a diverse group of cellular signaling pathways, which regulate an array of physiological processes, including cytoskeletal organization and cell death 4, 68. Interestingly, dysregulation of cathepsin D has been associated with neurophysiological stress and neurodegenerative disorders including Alzheimer's disease and epilepsy 12, 36. With respect to our data set, the cause–effect relationship between increased cathepsin D expression and epileptogenesis is a matter of speculation. Within this context, enhanced demand for lysosomal processing of damaged proteins is one possible explanation for the SE‐induced upregulation cathepsin D expression.
Cell stress
SE has been shown to markedly elevate reactive oxygen species in the brain 44, 46, 66. As a protective response, cells rapidly upregulate the expression of an array of antioxidant genes (37).
Here, we noted a significant increase in the expression of peroxiredoxin 6, a potent cytosolic antioxidant that catalyzes the reduction of hydrogen peroxide and hydroperoxides moieties 34, 51. Our data are consistent with a recent study showing an increase in peroxiredoxin 6 expression in individuals suffering from mesial TLE (73).
We also identified a significant increase in the expression of two members of the small heat shock protein family: Hsp27 and alpha B crystallin. A large body of work has shown that seizure activity triggers a marked upregulation of Hsp27 2, 31, 41, 59; Hsp27 plays a key cellular defense role, acting as a molecular chaperone that binds denatured proteins and thus limits protein aggregation (24). Interestingly, overexpression of Hsp27 contributes to cell survival 2, 40, and significantly reduced kainic acid‐induced seizure severity and mortality (2). In addition to its expression in the eye lens (43) alpha B crystalline is also expressed in glial cells of the central nervous system (14). A number of studies have shown that alpha B crystalline expression is enhanced as a function of CNS pathology 38, 64, 71. Of note, Che et al (14) reported that kainic acid‐induced SE triggered a marked upregulation of alpha B crystalline expression in reactive glial cell populations throughout the hippocampus.
In conclusion, the data presented here identify a diverse set of proteins that are potential targets for therapeutic intervention. Whether these proteins contribute to epileptogenesis or are a reflection of this process is not known. Further, because of the characteristics of the technique employed here, we focused on changes in only the most abundant proteins; it is quite likely that changes (ie, expression or phosphorylation) in moderately expressed proteins may be of equal or greater importance to the epileptogenic process. Additional proteomic studies that subdivide the epileptic hippocampus into discrete cell layers or regions (eg, granule cell layer, supragranule region) will likely yield further insight into the pathogenic process.
Supporting information
Table S1. Peptides identified by LC‐MS/MS analysis of the dentate gyrus proteins in the mice that changed 4 weeks post SE.
Supporting info item
ACKNOWLEDGMENTS
This work was supported grants from the NIH (MH62335, NS067409) and the Ohio State Neuroscience Signature Program RFA (501300). We thank Michael Zianni in the Plant‐Microbe Genomics Facility at Ohio State University for technical assistance with image scanning and Kari Green‐Church, OSU Campus Chemical Instrument Center, for assistance with mass spectrometric identification of proteins.
REFERENCES
- 1. Abeliovich A, Schmitz Y, Farinas I, Choi‐Lundberg D, Ho WH, Castillo PE et al (2000) Mice lacking alpha‐synuclein display functional deficits in the nigrostriatal dopamine system. Neuron 25:239–252. [DOI] [PubMed] [Google Scholar]
- 2. Akbar MT, Lundberg AM, Liu K, Vidyadaran S, Wells KE, Dolatshad H et al (2003) The neuroprotective effects of heat shock protein 27 overexpression in transgenic animals against kainate‐induced seizures and hippocampal cell death. J Biol Chem 278:19956–19965. [DOI] [PubMed] [Google Scholar]
- 3. Anderson RE, Engstrom FL, Woodbury DM (1984) Localization of carbonic anhydrase in the cerebrum and cerebellum of normal and audiogenic seizure mice. Ann N Y Acad Sci 429:502–504. [DOI] [PubMed] [Google Scholar]
- 4. Benes P, Vetvicka V, Fusek M (2008) Cathepsin D—many functions of one aspartic protease. Crit Rev Oncol Hematol 68:12–28. [DOI] [PMC free article] [PubMed] [Google Scholar]
- 5. Birbach A (2008) Profilin, a multi‐modal regulator of neuronal plasticity. Bioessays 30:994–1002. [DOI] [PubMed] [Google Scholar]
- 6. Borges K, Gearing M, McDermott DL, Smith AB, Almonte AG, Wainer BH et al (2003) Neuronal and glial pathological changes during epileptogenesis in the mouse pilocarpine model. Exp Neurol 182:21–34. [DOI] [PubMed] [Google Scholar]
- 7. Boro A, Haut S (2003) Medical comorbidities in the treatment of epilepsy. Epilepsy Behav 4(Suppl. 2):S2–12. [DOI] [PubMed] [Google Scholar]
- 8. Brown PD, Davies SL, Speake T, Millar ID (2004) Molecular mechanisms of cerebrospinal fluid production. Neuroscience 129:957–970. [DOI] [PMC free article] [PubMed] [Google Scholar]
- 9. Buckmaster PS, Dudek FE (1997) Neuron loss, granule cell axon reorganization, and functional changes in the dentate gyrus of epileptic kainate‐treated rats. J Comp Neurol 385:385–404. [PubMed] [Google Scholar]
- 10. Cabin DE, Shimazu K, Murphy D, Cole NB, Gottschalk W, McIlwain KL et al (2002) Synaptic vesicle depletion correlates with attenuated synaptic responses to prolonged repetitive stimulation in mice lacking alpha‐synuclein. J Neurosci 22:8797–8807. [DOI] [PMC free article] [PubMed] [Google Scholar]
- 11. Cartier AE, Djakovic SN, Salehi A, Wilson SM, Masliah E, Patrick GN (2009) Regulation of synaptic structure by ubiquitin C‐terminal hydrolase L1. J Neurosci 29:7857–7868. [DOI] [PMC free article] [PubMed] [Google Scholar]
- 12. Cataldo AM, Barnett JL, Pieroni C, Nixon RA (1997) Increased neuronal endocytosis and protease delivery to early endosomes in sporadic Alzheimer's disease: neuropathologic evidence for a mechanism of increased beta‐amyloidogenesis. J Neurosci 17:6142–6151. [DOI] [PMC free article] [PubMed] [Google Scholar]
- 13. Cavalheiro EA, Santos NF, Priel MR (1996) The pilocarpine model of epilepsy in mice. Epilepsia 37:1015–1019. [DOI] [PubMed] [Google Scholar]
- 14. Che Y, Piao CS, Han PL, Lee JK (2001) Delayed induction of alpha B‐crystallin in activated glia cells of hippocampus in kainic acid‐treated mouse brain. J Neurosci Res 65:425–431. [DOI] [PubMed] [Google Scholar]
- 15. Chen JW, Wasterlain CG (2006) Status epilepticus: pathophysiology and management in adults. Lancet Neurol 5:246–256. [DOI] [PubMed] [Google Scholar]
- 16. Choi J, Levey AI, Weintraub ST, Rees HD, Gearing M, Chin LS et al (2004) Oxidative modifications and down‐regulation of ubiquitin carboxyl‐terminal hydrolase L1 associated with idiopathic Parkinson's and Alzheimer's diseases. J Biol Chem 279:13256–13264. [DOI] [PubMed] [Google Scholar]
- 17. Choi YS, Lin SL, Lee B, Kurup P, Cho HY, Naegele JR et al (2007) Status epilepticus‐induced somatostatinergic hilar interneuron degeneration is regulated by striatal enriched protein tyrosine phosphatase. J Neurosci 27:2999–3009. [DOI] [PMC free article] [PubMed] [Google Scholar]
- 18. Cornaggia CM, Beghi M, Provenzi M, Beghi E (2006) Correlation between cognition and behavior in epilepsy. Epilepsia 47(Suppl. 2):34–39. [DOI] [PubMed] [Google Scholar]
- 19. Cronin J, Dudek FE (1988) Chronic seizures and collateral sprouting of dentate mossy fibers after kainic acid treatment in rats. Brain Res 474:181–184. [DOI] [PubMed] [Google Scholar]
- 20. Czech T, Yang JW, Csaszar E, Kappler J, Baumgartner C, Lubec G (2004) Reduction of hippocampal collapsin response mediated protein‐2 in patients with mesial temporal lobe epilepsy. Neurochem Res 29:2189–2196. [DOI] [PubMed] [Google Scholar]
- 21. DeGiorgio CM, Heck CN, Rabinowicz AL, Gott PS, Smith T, Correale J (1999) Serum neuron‐specific enolase in the major subtypes of status epilepticus. Neurology 52:746–749. [DOI] [PubMed] [Google Scholar]
- 22. Ding Z, Gau D, Deasy B, Wells A, Roy P (2009) Both actin and polyproline interactions of profilin‐1 are required for migration, invasion and capillary morphogenesis of vascular endothelial cells. Exp Cell Res 315:2963–2973. [DOI] [PMC free article] [PubMed] [Google Scholar]
- 23. Drabik A, Bierczynska‐Krzysik A, Bodzon‐Kulakowska A, Suder P, Kotlinska J, Silberring J (2007) Proteomics in neurosciences. Mass Spectrom Rev 26:432–450. [DOI] [PubMed] [Google Scholar]
- 24. Feder ME, Hofmann GE (1999) Heat‐shock proteins, molecular chaperones, and the stress response: evolutionary and ecological physiology. Annu Rev Physiol 61:243–282. [DOI] [PubMed] [Google Scholar]
- 25. Franck JE, Pokorny J, Kunkel DD, Schwartzkroin PA (1995) Physiologic and morphologic characteristics of granule cell circuitry in human epileptic hippocampus. Epilepsia 36:543–558. [DOI] [PubMed] [Google Scholar]
- 26. Freund TF, Ylinen A, Miettinen R, Pitkanen A, Lahtinen H, Baimbridge KG et al (1992) Pattern of neuronal death in the rat hippocampus after status epilepticus. Relationship to calcium binding protein content and ischemic vulnerability. Brain Res Bull 28:27–38. [DOI] [PubMed] [Google Scholar]
- 27. Fritschy JM, Kiener T, Bouilleret V, Loup F (1999) GABAergic neurons and GABA(A)‐receptors in temporal lobe epilepsy. Neurochem Int 34:435–445. [DOI] [PubMed] [Google Scholar]
- 28. Frotscher M, Jonas P, Sloviter RS (2006) Synapses formed by normal and abnormal hippocampal mossy fibers. Cell Tissue Res 326:361–367. [DOI] [PubMed] [Google Scholar]
- 29. Fujikawa DG (1996) The temporal evolution of neuronal damage from pilocarpine‐induced status epilepticus. Brain Res 725:11–22. [DOI] [PubMed] [Google Scholar]
- 30. George JM, Jin H, Woods WS, Clayton DF (1995) Characterization of a novel protein regulated during the critical period for song learning in the zebra finch. Neuron 15:361–372. [DOI] [PubMed] [Google Scholar]
- 31. Greene ND, Bamidele A, Choy M, De Castro SC, Wait R, Leung KY et al (2007) Proteome changes associated with hippocampal MRI abnormalities in the lithium pilocarpine‐induced model of convulsive status epilepticus. Proteomics 7:1336–1344. [DOI] [PubMed] [Google Scholar]
- 32. Halmi P, Parkkila S, Honkaniemi J (2006) Expression of carbonic anhydrases II, IV, VII, VIII and XII in rat brain after kainic acid induced status epilepticus. Neurochem Int 48:24–30. [DOI] [PubMed] [Google Scholar]
- 33. Hardison JL, Okazaki MM, Nadler JV (2000) Modest increase in extracellular potassium unmasks effect of recurrent mossy fiber growth. J Neurophysiol 84:2380–2389. [DOI] [PubMed] [Google Scholar]
- 34. Hattori F, Oikawa S (2007) Peroxiredoxins in the central nervous system. Subcell Biochem 44:357–374. [DOI] [PubMed] [Google Scholar]
- 35. Honore B, Madsen P, Andersen AH, Leffers H (1993) Cloning and expression of a novel human profilin variant, profilin II. FEBS Lett 330:151–155. [DOI] [PubMed] [Google Scholar]
- 36. Houseweart MK, Pennacchio LA, Vilaythong A, Peters C, Noebels JL, Myers RM (2003) Cathepsin B but not cathepsins L or S contributes to the pathogenesis of Unverricht‐Lundborg progressive myoclonus epilepsy (EPM1). J Neurobiol 56:315–327. [DOI] [PubMed] [Google Scholar]
- 37. Itoh K, Ishii T, Wakabayashi N, Yamamoto M (1999) Regulatory mechanisms of cellular response to oxidative stress. Free Radic Res 31:319–324. [DOI] [PubMed] [Google Scholar]
- 38. Iwaki T, Wisniewski T, Iwaki A, Corbin E, Tomokane N, Tateishi J et al (1992) Accumulation of alpha B‐crystallin in central nervous system glia and neurons in pathologic conditions. Am J Pathol 140:345–356. [PMC free article] [PubMed] [Google Scholar]
- 39. Junker H, Spate K, Suofu Y, Walther R, Schwarz G, Kammer W et al (2005) Proteomic identification of the involvement of the mitochondrial rieske protein in epilepsy. Epilepsia 46:339–343. [DOI] [PubMed] [Google Scholar]
- 40. Kalwy SA, Akbar MT, Coffin RS, De Belleroche J, Latchman DS (2003) Heat shock protein 27 delivered via a herpes simplex virus vector can protect neurons of the hippocampus against kainic‐acid‐induced cell loss. Brain Res Mol Brain Res 111:91–103. [DOI] [PubMed] [Google Scholar]
- 41. Kato K, Katoh‐Semba R, Takeuchi IK, Ito H, Kamei K (1999) Responses of heat shock proteins hsp27, alphaB‐crystallin, and hsp70 in rat brain after kainic acid‐induced seizure activity. J Neurochem 73:229–236. [DOI] [PubMed] [Google Scholar]
- 42. Kim SI, Voshol H, Van Oostrum J, Hastings TG, Cascio M, Glucksman MJ (2004) Neuroproteomics: expression profiling of the brain's proteomes in health and disease. Neurochem Res 29:1317–1331. [DOI] [PubMed] [Google Scholar]
- 43. Klemenz R, Frohli E, Steiger RH, Schafer R, Aoyama A (1991) Alpha B‐crystallin is a small heat shock protein. Proc Natl Acad Sci U S A 88:3652–3656. [DOI] [PMC free article] [PubMed] [Google Scholar]
- 44. Kovacs R, Schuchmann S, Gabriel S, Kann O, Kardos J, Heinemann U (2002) Free radical‐mediated cell damage after experimental status epilepticus in hippocampal slice cultures. J Neurophysiol 88:2909–2918. [DOI] [PubMed] [Google Scholar]
- 45. Larsen CN, Krantz BA, Wilkinson KD (1998) Substrate specificity of deubiquitinating enzymes: ubiquitin C‐terminal hydrolases. Biochemistry 37:3358–3368. [DOI] [PubMed] [Google Scholar]
- 46. Lee B, Cao R, Choi YS, Cho HY, Rhee AD, Hah CK et al (2009) The CREB/CRE transcriptional pathway: protection against oxidative stress‐mediated neuronal cell death. J Neurochem 108:1251–1265. [DOI] [PMC free article] [PubMed] [Google Scholar]
- 47. Lees AJ, Hardy J, Revesz T (2009) Parkinson's disease. Lancet 373:2055–2066. [DOI] [PubMed] [Google Scholar]
- 48. Leite JP, Garcia‐Cairasco N, Cavalheiro EA (2002) New insights from the use of pilocarpine and kainate models. Epilepsy Res 50:93–103. [DOI] [PubMed] [Google Scholar]
- 49. Li A, Benoit JB, Lopez‐Martinez G, Elnitsky MA, Lee RE Jr, Denlinger DL (2009) Distinct contractile and cytoskeletal protein patterns in the Antarctic midge are elicited by desiccation and rehydration. Proteomics 9:2788–2798. [DOI] [PubMed] [Google Scholar]
- 50. Liu Z, Meray RK, Grammatopoulos TN, Fredenburg RA, Cookson MR, Liu Y et al (2009) Membrane‐associated farnesylated UCH‐L1 promotes alpha‐synuclein neurotoxicity and is a therapeutic target for Parkinson's disease. Proc Natl Acad Sci U S A 106:4635–4640. [DOI] [PMC free article] [PubMed] [Google Scholar]
- 51. Manevich Y, Fisher AB (2005) Peroxiredoxin 6, a 1‐Cys peroxiredoxin, functions in antioxidant defense and lung phospholipid metabolism. Free Radic Biol Med 38:1422–1432. [DOI] [PubMed] [Google Scholar]
- 52. Marcon J, Gagliardi B, Balosso S, Maroso M, Noe F, Morin M et al (2009) Age‐dependent vascular changes induced by status epilepticus in rat forebrain: implications for epileptogenesis. Neurobiol Dis 34:121–132. [DOI] [PubMed] [Google Scholar]
- 53. Mezey E, Dehejia A, Harta G, Papp MI, Polymeropoulos MH, Brownstein MJ (1998) Alpha synuclein in neurodegenerative disorders: murderer or accomplice? Nat Med 4:755–757. [DOI] [PubMed] [Google Scholar]
- 54. Murphy DD, Rueter SM, Trojanowski JQ, Lee VM (2000) Synucleins are developmentally expressed, and alpha‐synuclein regulates the size of the presynaptic vesicular pool in primary hippocampal neurons. J Neurosci 20:3214–3220. [DOI] [PMC free article] [PubMed] [Google Scholar]
- 55. Neuhoff H, Sassoe‐Pognetto M, Panzanelli P, Maas C, Witke W, Kneussel M (2005) The actin‐binding protein profilin I is localized at synaptic sites in an activity‐regulated manner. Eur J Neurosci 21:15–25. [DOI] [PubMed] [Google Scholar]
- 56. Okazaki MM, Molnar P, Nadler JV (1999) Recurrent mossy fiber pathway in rat dentate gyrus: synaptic currents evoked in presence and absence of seizure‐induced growth. J Neurophysiol 81:1645–1660. [DOI] [PubMed] [Google Scholar]
- 57. Olney JW, De Gubareff T, Labruyere J (1983) Seizure‐related brain damage induced by cholinergic agents. Nature 301:520–522. [DOI] [PubMed] [Google Scholar]
- 58. Patrick GN (2006) Synapse formation and plasticity: recent insights from the perspective of the ubiquitin proteasome system. Curr Opin Neurobiol 16:90–94. [DOI] [PubMed] [Google Scholar]
- 59. Plumier JC, Armstrong JN, Landry J, Babity JM, Robertson HA, Currie RW (1996) Expression of the 27,000 mol. wt heat shock protein following kainic acid‐induced status epilepticus in the rat. Neuroscience 75:849–856. [DOI] [PubMed] [Google Scholar]
- 60. Rigau V, Morin M, Rousset MC, De Bock F, Lebrun A, Coubes P et al (2007) Angiogenesis is associated with blood‐brain barrier permeability in temporal lobe epilepsy. Brain 130:1942–1956. [DOI] [PubMed] [Google Scholar]
- 61. Ruusuvuori E, Li H, Huttu K, Palva JM, Smirnov S, Rivera C et al (2004) Carbonic anhydrase isoform VII acts as a molecular switch in the development of synchronous gamma‐frequency firing of hippocampal CA1 pyramidal cells. J Neurosci 24:2699–2707. [DOI] [PMC free article] [PubMed] [Google Scholar]
- 62. Ryu MJ, Lee C, Kim J, Shin HS, Yu MH (2008) Proteomic analysis of stargazer mutant mouse neuronal proteins involved in absence seizure. J Neurochem 104:1260–1270. [DOI] [PubMed] [Google Scholar]
- 63. Sankar R, Shin DH, Wasterlain CG (1997) Serum neuron‐specific enolase is a marker for neuronal damage following status epilepticus in the rat. Epilepsy Res 28:129–136. [DOI] [PubMed] [Google Scholar]
- 64. Shinohara H, Inaguma Y, Goto S, Inagaki T, Kato K (1993) Alpha B crystallin and HSP28 are enhanced in the cerebral cortex of patients with Alzheimer's disease. J Neurol Sci 119:203–208. [DOI] [PubMed] [Google Scholar]
- 65. Tauck DL, Nadler JV (1985) Evidence of functional mossy fiber sprouting in hippocampal formation of kainic acid‐treated rats. J Neurosci 5:1016–1022. [DOI] [PMC free article] [PubMed] [Google Scholar]
- 66. Tejada S, Sureda A, Roca C, Gamundi A, Esteban S (2007) Antioxidant response and oxidative damage in brain cortex after high dose of pilocarpine. Brain Res Bull 71:372–375. [DOI] [PubMed] [Google Scholar]
- 67. Thiry A, Dogne JM, Supuran CT, Masereel B (2007) Carbonic anhydrase inhibitors as anticonvulsant agents. Curr Top Med Chem 7:855–864. [DOI] [PubMed] [Google Scholar]
- 68. Tsukuba T, Okamoto K, Yasuda Y, Morikawa W, Nakanishi H, Yamamoto K (2000) New functional aspects of cathepsin D and cathepsin E. Mol Cells 10:601–611. [DOI] [PubMed] [Google Scholar]
- 69. Turski WA, Cavalheiro EA, Bortolotto ZA, Mello LM, Schwarz M, Turski L (1984) Seizures produced by pilocarpine in mice: a behavioral, electroencephalographic and morphological analysis. Brain Res 321:237–253. [DOI] [PubMed] [Google Scholar]
- 70. Van Noort JM, Van Sechel AC, Bajramovic JJ, El Ouagmiri M, Polman CH, Lassmann H et al (1995) The small heat‐shock protein alpha B‐crystallin as candidate autoantigen in multiple sclerosis. Nature 375:798–801. [DOI] [PubMed] [Google Scholar]
- 71. Velisek L, Moshe SL, Cammer W (1993) Developmental changes in seizure susceptibility in carbonic anhydrase II‐deficient mice and normal littermates. Brain Res Dev Brain Res 72:321–324. [DOI] [PubMed] [Google Scholar]
- 72. Witke W, Sutherland JD, Sharpe A, Arai M, Kwiatkowski DJ (2001) Profilin I is essential for cell survival and cell division in early mouse development. Proc Natl Acad Sci U S A 98:3832–3836. [DOI] [PMC free article] [PubMed] [Google Scholar]
- 73. Yang JW, Czech T, Felizardo M, Baumgartner C, Lubec G (2006) Aberrant expression of cytoskeleton proteins in hippocampus from patients with mesial temporal lobe epilepsy. Amino Acids 30:477–493. [DOI] [PubMed] [Google Scholar]
- 74. Yardimoglu M, Ilbay G, Dalcik C, Dalcik H, Sahin D, Ates N (2008) Immunocytochemistry of neuron specific enolase (NSE) in the rat brain after single and repeated epileptic seizures. Int J Neurosci 118:981–993. [DOI] [PubMed] [Google Scholar]
- 75. Yasuda T, Nihira T, Ren YR, Cao XQ, Wada K, Setsuie R et al (2009) Effects of UCH‐L1 on alpha‐synuclein over‐expression mouse model of Parkinson's disease. J Neurochem 108:932–944. [DOI] [PubMed] [Google Scholar]
- 76. Zeng LH, Xu L, Rensing NR, Sinatra PM, Rothman SM, Wong M (2007) Kainate seizures cause acute dendritic injury and actin depolymerization in vivo . J Neurosci 27:11604–11613. [DOI] [PMC free article] [PubMed] [Google Scholar]
Associated Data
This section collects any data citations, data availability statements, or supplementary materials included in this article.
Supplementary Materials
Table S1. Peptides identified by LC‐MS/MS analysis of the dentate gyrus proteins in the mice that changed 4 weeks post SE.
Supporting info item