

Abstract

A europium(III) DO3A-tris(amide) complex is reported for imaging pH by MRI using ratiometric CEST principles. Deprotonation of a single phenolic proton between pH 6 and 7.6 results in an ~5 ppm shift in the water exchange CEST peak that is easily detected by MRI. Collection of two CEST images at two slightly different activation frequencies provides a direct readout of solution pH without the need of a concentration marker.
Magnetic resonance imaging (MRI) is one of the most widely used, noninvasive imaging modalities in clinical medicine.1 One reason for its popularity is that image contrast arises from inherent differences in water proton densities and relaxation rates between various tissue components. Even with these natural contrast differences between tissues, exogenous contrast agents that alter proton relaxation times (T1, T2, or T2*) are still widely used to enhance contrast between various tissue compartments.2
A new type of image contrast based on a chemical exchange saturation transfer (CEST) mechanism was recently introduced.3 Paramagnetic versions of CEST agents have the potential of offering two major advantages over Gd3+-based imaging agents.4 First, image contrast produced by a PARACEST agent can be switched “on” or “off” by application of a frequency-selective radio frequency pulse. This feature allows potential multiplexing of agents in a single study. Second, since contrast in these systems is based on chemical exchange of either liable protons or water molecules, the agents are extremely sensitive to exchange rates (kex). This feature makes them attractive for developing biologically responsive sensors. PARACEST sensors using a variety of design platforms have been reported for measuring pH,5,6 temperature,7 Zn2+,8 glucose,9 nitric oxide,10 phosphate esters,11 and enzyme activity.12,13
Most PARACEST sensors reported to date have a CEST signal that changes intensity in response to external stimuli. This of course requires a separate measure of agent concentration to obtain quantitative results. Some exceptions include agents that use either a cocktail of agents5 or single agents having multiple weakly shifted −NH exchangeable protons for ratiometric imaging.6 The later design feature has the disadvantage of relying on exchange sites that are relatively close to the bulk water frequency (typically < 15 ppm). Here, we address this problem by presenting a novel europium(III) DOTA-monoketonetris(amide) complex that has a single highly shifted water exchange peak whose frequency varies as a function of solution pH. We demonstrate that this single agent is nearly ideal for measuring pH by use of ratiometric CEST imaging without the need of a second concentration marker.
Previously reported Eu3+-based PARACEST agents have a highly shifted water exchange peak that is independent of pH between 5 and 8.5 More recently, we discovered that the chemical shift of the Eu3+-bound water exchange peak can be altered considerably by varying the electron density on a single amide oxygen donor in these DOTA-tetraamide systems.14 This observation was later expanded to multi-frequency PARACEST agents15 but again none of those were pH sensitive. Given these prior observations, we envisioned a new type of complex, Eu-1, wherein one of the amide side chains is replaced by ketone oxygen donor that is directly conjugated to an ionizable group, in this case a phenol unit (Figure 1).
Figure 1.
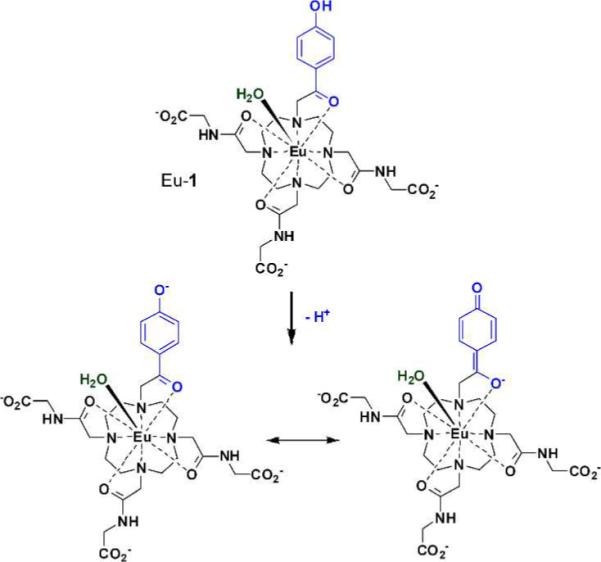
The structure of the pH-responsive PARACEST agent, Eu-1. Deprotonation of the phenolic proton results in conjugation of the resulting quinone-like structure with the acetyl oxygen atom coordinated to the Eu3+ ion (bottom).
The absorption spectrum of Eu-1 displays a bathochromic shift from 310 nm to 360 nm as the phenolic proton is removed (Figure 2), consistent with extended delocalization of the phenolate anion through the π system to form the quinone-like structure. This would place more negative charge on the carbonyl oxygen atom coordinated to the Eu3+ ion (Figure 1). The pKa derived from these optical data (6.7 ± 0.1) is nearly ideal for pH measurements in biological systems. One would predict a priori that such a resonance structure would also alter the water exchange rate and potentially the frequency of the exchanging water molecule.15 The CEST spectra of Eu-1 recorded at five different pH values (Figure 3) showed a surprisingly large change in exchange frequency over this same pH range. The pKa of Eu-1 derived from the CEST data was 6.5 ± 0.1 (Figure S2), nearly identical to the value determined optically.
Figure 2.
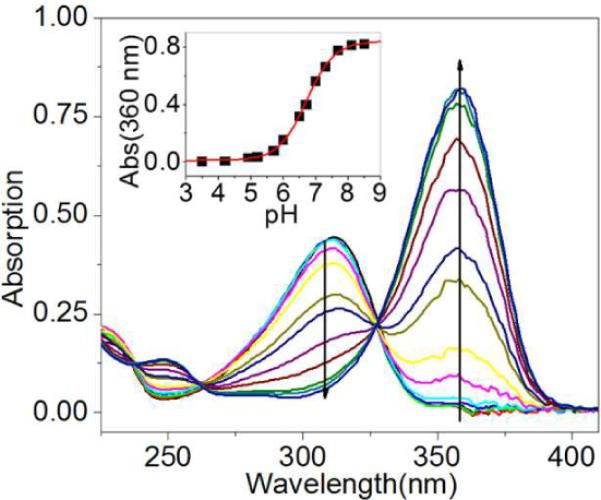
UV-vis spectra of Eu-1 (20 μM) recorded as a function of solution pH. The arrow indicates the direction of the absorbance changes with increasing pH. Insert: titration curve showing the increase in absorbance at 360 nm as a function of pH.
Figure 3.
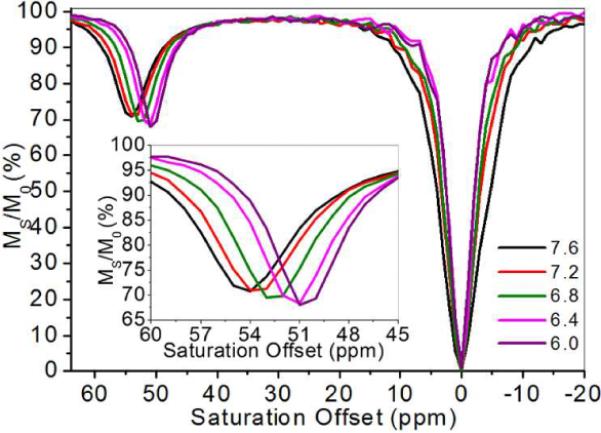
pH dependence of CEST spectra for Eu-1 recorded at 9.4 T and 298 K. Insert: expanded view of the water exchange peak as a function of pH. [Eu3+] = 10 mM, B1 = 14.1 μT, and sat. time = 2 s.
This unusual CEST feature suggests it may be possible to image pH directly using Eu-1 and ratiometric CEST imaging. For example, the ratio of CEST intensities after activation of Eu-1 at 55 versus 49 ppm was found to be nearly linear between pH 6.0 and 7.6, and, more importantly, independent of Eu-1 concentration (Figure S5). Other combinations of activation frequencies gave similar results. Thus, Eu-1 offers several advantages over previously reported ratiometric pH indicators. First, the pH measurement can be made using a single reagent rather than a cocktail of agents5 and, second, the exchange peak in Eu-1 is shifted well away from the frequency of solvent protons so it can be activated without concern about partial off-resonance saturation of bulk water protons.6,16,17
To demonstrate the simplicity of using this agent for imaging pH by MRI, CEST images of a phantom prepared from five Eu-1 samples adjusted to different pH values (plus a control sample lacking Eu-1) were collected at two presaturation frequencies, 54 and 47 ppm. The CEST intensity ratio in these two images is shown in Figure 4b as a color map. The sample containing water alone showed nearly perfect cancellation while the CEST ratio in samples of Eu-1 varied from 0.43 (sample at pH 6.0) to 2.32 (sample at pH 7.6), a substantial dynamic range. Using these ratios and the calibration curve of Figure S6, the pH values derived from the CEST images (Figure 4c) perfectly matched those measured by use of a pH electrode (Figure 4a).
Figure 4.
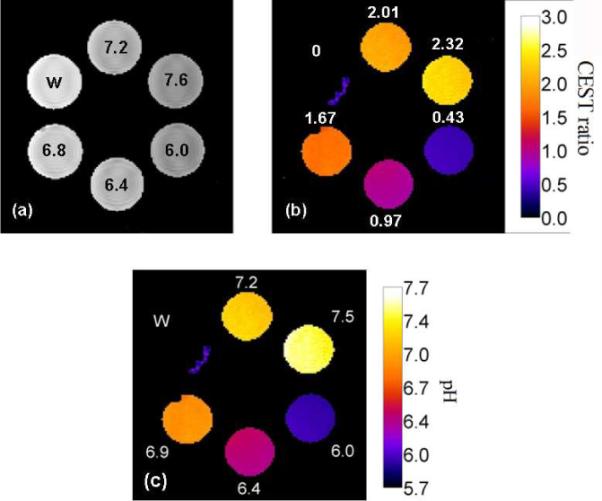
Images of a phantom containing either water (w) or 10 mM Eu-1 adjusted to the indicated pH (9.4 T, 298 K). (a) Proton density images, (b) ratio water intensities after activation at 54 versus 47 ppm, and (c) calculated pH values as determined by ratiometric CEST imaging.
The bound water lifetimes (τM) of the protonated and deprotonated Eu-1 species were determined by fitting CEST spectra recorded at pH 5.0 and 8.0, respectively, (Figure S7) to the Bloch equations using previously published methods.18 That fitting procedure gave τM values of 239 μs at pH 5.0 and 120 μs at pH 8.0. This result is consistent with the expected increase in water exchange rate as the acetyl oxygen donor atom gains more negative charge at the higher pH value. The width of the water exchange peak in Eu-1 does broaden somewhat at high pH values, again consistent with faster water exchange. Water exchange in Eu-1 is even faster at 310 K as expected (τM was found to be 123 μs and 45 μs for the protonated versus deprotonated species at these same two pH values) while the frequency shifts in the bound water exchange peak were similar to those found at 298 K. This indicates that Eu-1 will also be effective for ratiometric CEST imaging of pH at physiological temperatures as well (Figure S8).
In summary, a novel Eu3+-based PARACEST agent is reported that provides a concentration independent measure of pH by ratiometric CEST imaging. A unique aspect of this agent is that the ratiometric image data can be collected at CEST activation frequencies widely separated from the bulk water frequency and the pKa of the sensor is nearly ideal for imaging pH over a range of interest for detecting abnormal physiology. The basic platform technology reported here will likely prove useful in the design of other types of responsive imaging agents as well.
Supplementary Material
Acknowledgments
Financial support from the National Institutes of Health (CA115531, RR02584, and EB004582) and the Robert A. Welch Foundation (AT-584) is gratefully acknowledged.
Supporting Information: Complete synthetic details, CEST results and ratiometric plots are provided. This material is available free of charge via the Internet at http://pubs.acs.org.
References
- (1).Kuperman V. Magnetic resonance imaging: physical principles and applications. Academic Press; San Diego, CA: 2000. [Google Scholar]
- (2).Merbach AE, Toth E, editors. The Chemistry of Contrast Agents in Medical Magnetic Resonance Imaging. John Wiley & Son; Chichester, UK: 2001. [Google Scholar]
- (3).Ward KM, Aletras AH, Balaban RS. J. Magn. Reson. 2000;143:79–87. doi: 10.1006/jmre.1999.1956. [DOI] [PubMed] [Google Scholar]
- (4).Sherry AD, Woods M. Annu. Rev. Biomed. Eng. 2008;10:391–411. doi: 10.1146/annurev.bioeng.9.060906.151929. [DOI] [PMC free article] [PubMed] [Google Scholar]
- (5).Aime S, Barge A, Delli Castelli D, Fedeli F, Mortillaro A, Nielsen FU, Terreno E. Magn. Reson. Med. 2002;47:639–648. doi: 10.1002/mrm.10106. [DOI] [PubMed] [Google Scholar]
- (6).Aime S, Delli Castelli D, Terreno E. Angew. Chem. Int. Ed. 2002;41:4334–4336. doi: 10.1002/1521-3773(20021115)41:22<4334::AID-ANIE4334>3.0.CO;2-1. [DOI] [PubMed] [Google Scholar]
- (7).Zhang SR, Malloy CR, Sherry AD. J. Am. Chem. Soc. 2005;127:17572–17573. doi: 10.1021/ja053799t. [DOI] [PMC free article] [PubMed] [Google Scholar]
- (8).Trokowski R, Ren JM, Kalman FK, Sherry AD. Angew. Chem. Int. Ed. 2005;44:6920–6923. doi: 10.1002/anie.200502173. [DOI] [PubMed] [Google Scholar]
- (9).Zhang SR, Trokowski R, Sherry AD. J. Am. Chem. Soc. 2003;125:15288–15289. doi: 10.1021/ja038345f. [DOI] [PubMed] [Google Scholar]
- (10).Liu GS, Li YG, Pagel MD. Magn. Reson. Med. 2007;58:1249–1256. doi: 10.1002/mrm.21428. [DOI] [PubMed] [Google Scholar]
- (11).Huang CH, Morrow JR. J. Am. Chem. Soc. 2009;131:4206–4207. doi: 10.1021/ja900290z. [DOI] [PMC free article] [PubMed] [Google Scholar]
- (12).Yoo B, Pagel MD. J. Am. Chem. Soc. 2006;128:14032–14033. doi: 10.1021/ja063874f. [DOI] [PubMed] [Google Scholar]
- (13).Chauvin T, Durand P, Bernier M, Meudal H, Doan BT, Noury F, Badet B, Beloeil JC, Toth E. Angew. Chem. Int. Ed. 2008;47:4370–4372. doi: 10.1002/anie.200800809. [DOI] [PubMed] [Google Scholar]
- (14).Ratnakar SJ, Woods M, Lubag AJM, Kovacst Z, Sherry AD. J. Am. Chem. Soc. 2008;130:6–7. doi: 10.1021/ja076325y. [DOI] [PMC free article] [PubMed] [Google Scholar]
- (15).Viswanathan S, Ratnakar SJ, Green KN, Kovacs Z, De Leon-Rodriguez LM, Sherry AD. Angew. Chem. Int. Ed. 2009;48:9330–9333. doi: 10.1002/anie.200904649. [DOI] [PMC free article] [PubMed] [Google Scholar]
- (16).Pikkemaat JA, Wegh RT, Lamerichs R, van de Molengraaf RA, Langereis S, Burdinski D, Raymond AYF, Janssen HM, de Waal BFM, Willard NP, Meijer EW, Grull H. Contrast Media Mol. Imaging. 2007;2:229–239. doi: 10.1002/cmmi.149. [DOI] [PubMed] [Google Scholar]
- (17).Ali MM, Yoo B, Pagel MD. Mol. Pharmaceutics. 2009;6:1409–1416. doi: 10.1021/mp900040u. [DOI] [PMC free article] [PubMed] [Google Scholar]
- (18).Woessner DE, Zhang SR, Merritt ME, Sherry AD. Magn. Reson. Med. 2005;53:790–799. doi: 10.1002/mrm.20408. [DOI] [PubMed] [Google Scholar]
Associated Data
This section collects any data citations, data availability statements, or supplementary materials included in this article.