Abstract
Metergoline, a serotonin receptor antagonist, was labeled with carbon-11 in order to evaluate pharmacokinetics and distribution in non-human primates using positron emission tomography. [11C]Metergoline had moderate brain uptake and exhibited heterogeneous specific binding which was blocked by pretreatment with metergoline and altanserin throughout the cortex. Nonspecific binding and insensitivity to changes in synaptic serotonin using citalopram limit its potential as a PET radiotracer. However, the characterization of [11C]metergoline pharmacokinetics and binding in the brain and peripheral organs using PET improves our understanding of metergoline drug pharmacology.
Keywords: Metergoline, carbon-11, PET, serotonin, altanserin
1. Introduction
Metergoline is a relatively old ergot-derived drug that has been explored in a variety of medical applications,1 including seasonal depression2 and prolactin hormone regulation.3 It has also been used in veterinary medicine as a pregnancy termination drug for dogs.4 The pharmacological effects of metergoline have been primarily attributed to its interactions with the serotonin (5-hydroxytryptamine, (5HT)) system. Metergoline acts as an antagonist at many of the 5HT receptor subtypes (with binding affinities reported as low as 120 pM) and has also been shown to interact with certain dopamine receptors albeit with lower potency.5 Since initially reported in 1965,6 metergoline has been used in hundreds of behavioral pharmacology experiments as a probe for 5HT receptor function.7
We were initially attracted to metergoline during the development of a new method to label compounds with carbon-11, a positron-emitting isotope with a 20.4 min half life.8 During the course of these studies, which were aimed at direct fixation of 11CO2 in carbamates, we were able to synthesize [11C]metergoline with high efficiency and relative ease. Because of the interesting pharmacology associated with the use of metergoline as a serotonergic drug, we decided to characterize [11C]metergoline binding in the non-human primate brain using positron emission tomography (PET). This was in part prompted by an earlier in vitro characterization of tritium labeled metergoline.9
Nearly three decades ago, [3H]metergoline was explored as a ligand for serotonin receptor autoradiography and showed specific binding for serotonin receptors 10–400 times more sensitive to serotonin- than dopamine- receptor antagonists, depending on the brain region and blocking drug used. Although [3H]metergoline displayed suitable characteristics as a radioligand for 5HT receptors, it was never subsequently used for this purpose (perhaps due to the development of more sub-type specific radioligands).
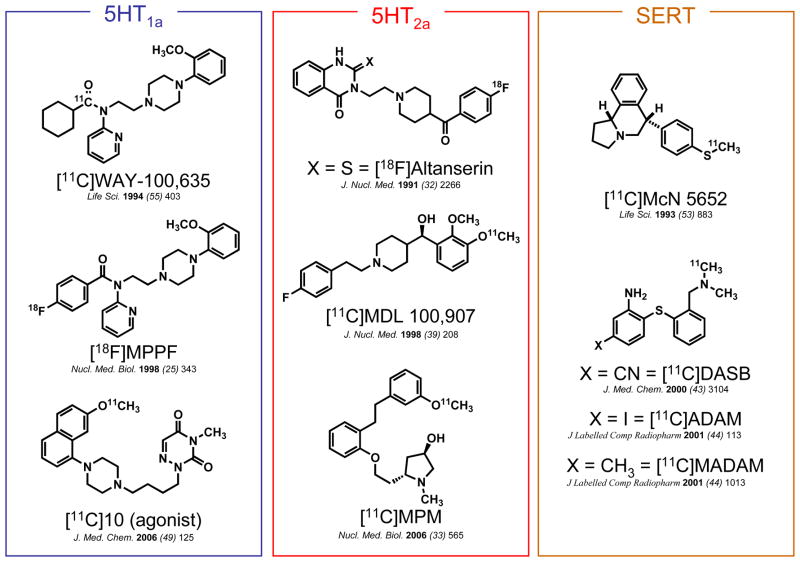
While several serotonin ligands have been developed as PET radiotracers for various receptor subtypes (see Figure 1 for examples), there remain limitations in the ability to probe the serotonin system using PET, primary among them being radiotracer sensitivity to synaptic serotonin concentration. 10 In order to determine the potential of [11C]metergoline as a serotonin radiotracer and to characterize its binding in vivo, we examined its baseline pharmacokinetics and distribution in both the brain and peripheral organs as well changes in binding after pretreatment with unlabeled metergoline, altanserin, and citalopram.
Figure 1.
Examples of 11C- and 18F-labeled 5HT imaging agents
2. Results and Discussion
2.1 Chemistry
Synthesis of a labeling precursor was accomplished by hydrogenolysis of metergoline, Scheme 1. The resulting amine (2) was isolated in nearly quantitative yield without chromatographic separation. Less than 0.1% of the starting material remained, an important consideration for PET imaging given that contaminating starting material would have a direct impact on radiotracer specific activity. The facile “deprotection” of metergoline highlights one key advantage of using a carbon-11 carbamate labeling approach when compared to, for example, demethylation to form a labeling precursor.
Scheme 1.
aConditions: (i) H2, Pd/C, MeOH, 25°C, 12 h, 98%. (ii) 11CO2, DBU, BnCl, DMF, 75°C, 10 min 35% RCY
Carbon-11 labeling was carried out using DBU-mediated direct fixation of 11CO2. In one pot, a solution the amine precursor (2), benzyl chloride, and DBU in DMF were combined and treated with high specific activity 11CO2. The sealed vessel was heated for 5–6 min. Unreacted 11CO2 was removed by acidification of the reaction solution followed sparging with helium. Purification of [11C]metergoline (3) was accomplished using reversed phase HPLC. Of the radioactivity loaded on the column, >75% was [11C]metergoline with almost the entire balance being incorporated into a single, slightly more polar compound. Byproduct formation and yield was batch dependant and we are interested in determining the structure of this side product in order to learn about other direct reaction modes for 11CO2 under these conditions, but to date have not been able to isolate the byproduct in sufficient quantities for characterization.
After purification and formulation, the radiochemical yield of [11C]metergoline was ~35% and the specific activity was consistently >3 Ci/μmol.
2.2 Lipophilicity and Plasma Protein Binding
Before performing in vivo PET studies, we examined the lipophilicity and plasma protein binding of [11C]metergoline in vitro. The lipophilicity (logD, 3.30 ± 0.32, n = 6) of [11C]metergoline was within the range of values predicted to facilitate good BBB penetration.11 However, we noted >99% of [11C]metergoline was bound to plasma proteins (0.55% unbound, n =2), which we surmised would limit the overall uptake of the labeled compound in the brain.
2.3 Pharmacokinetics and Distribution (Brain)
[11C]Metergoline was introduced intravenously to anesthetized, otherwise drug naive, baboons to determine its level of uptake and distribution in various tissues. Given its use as a tool in pharmacological neuroscience, we were particularly interested in the binding characteristics of [11C]metergoline in the brain, but we have also examined [11C]metergoline binding in peripheral tissues.
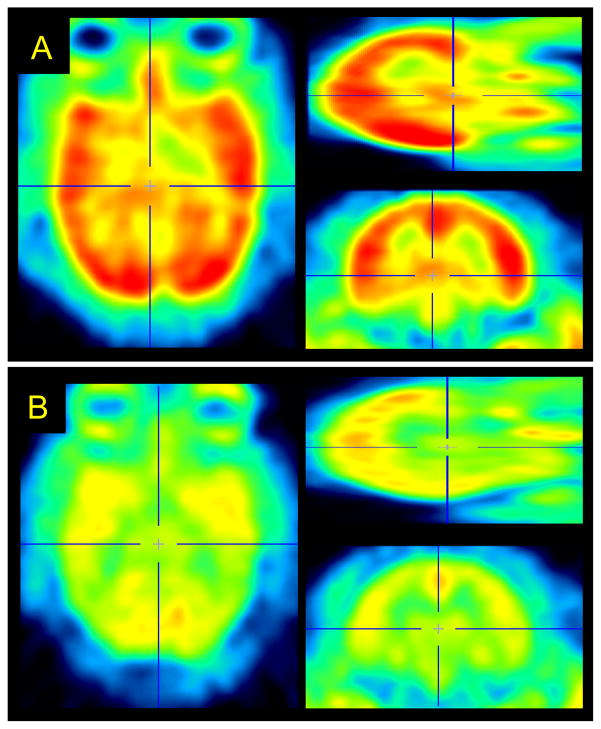
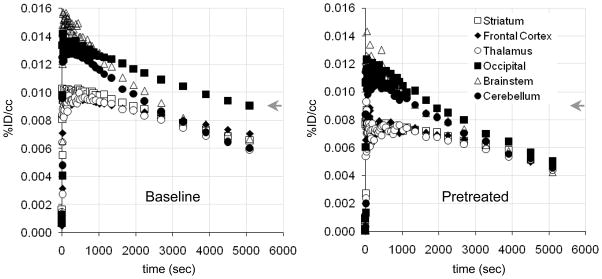
[11C]Metergoline exhibited heterogeneous binding throughout the brain with the greatest concentration observed in the cortex, particularly in the occipital cortex, Figure 2a. The average concentration of [11C]metergoline in the brain during early time points was 0.01 %ID/cc (2–10 min), which corresponds to ~1.5% of the total injected dose. This is roughly 1/3 of the uptake observed for highly brain penetrate compounds, such as [11C]cocaine, which was unexpectedly high given the high degree of plasma protein being for [11C]metergoline. The time-activity curves for specific brain regions also exhibited heterogeneous profiles with various rates of clearance, Figure 3a. The initial imaging data was consistent with the known distribution of serotonin receptors in the brain and similar to other PET radiotracers, most notably [18F]altanserin, which is currently one of the most common agents for human 5HT2a characterization.12
Figure 2.
Representative [11C]metergoline PET images from a baseline (a) and blocking (b) study carried out in the same baboon. Images were summed 30–90 min and dose corrected (3.04 and 3.17 mCi, respectively) after spatial co-registration.
Figure 3.
Representative time-activity curves (TACs) for baboon brain regions of interest: (left) averaged [11C]metergoline baseline TACs (n = 7); (right) averaged TACs from blocking studies with cold metergoline (n = 3).
2.3.1 Pharmacological Blocking Studies
To further characterize the binding of [11C]metergoline in the brain, we performed a series of preliminary blocking studies. Pretreatment with non-radioactive metergoline (1 mg i.v., 5 min prior to radiotracer) was used to discriminate specific from nonspecific binding. Dose corrected images indicated that pretreatment had a marked impact on [11C]metergoline binding, particularly in the cortex, which was also evident from changes in the brain region time-activity curves, Figure 3b. However, ~50% of the signal relative to baseline was observed at this dose. We attribute this primarily to the nonspecific binding component; however it may be an overestimate. For safety, we did not examine higher blocking doses with metergoline. Instead, we determined the effects of pretreatment with altanserin (0.5 mg/kg i.v.) and citolopram (5.0 mg/kg i.v.).
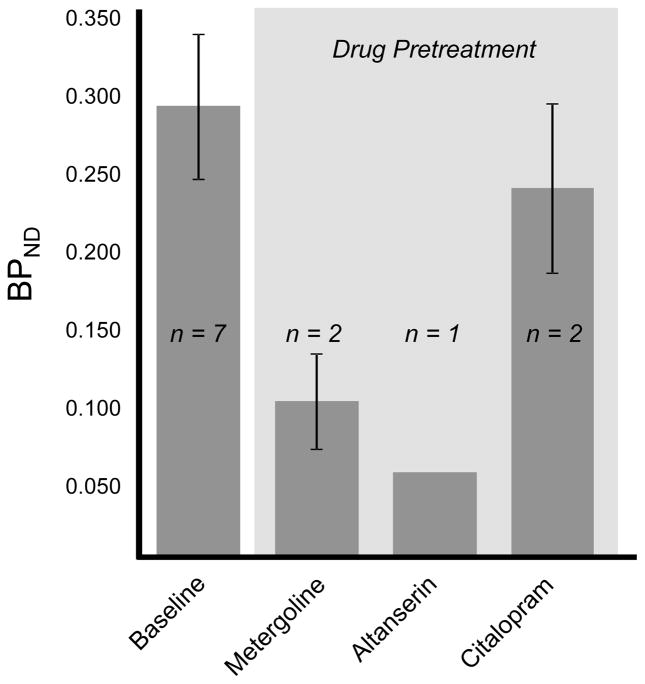
Quantification of [11C]metergoline binding was accomplished by Logan graphical analysis using a metabolite corrected plasma input curve. This analysis was performed for all brain regions however only occipital cortex binding data are given for clarity. We used this method to assess the change in binding after pretreatment with altanserin and citalopram. The distribution volumes (VT) using this method ranged from 10–18ml/ml with moderate test-retest variability. Using the cerebellum as a reference region, we calculated BPND which appeared to be a more stable measurement (i.e. lower standard deviation) for both intra-subject and inter-subject scans. Cerebellum is commonly used as reference region for 5HT receptor binding. However, in our case the cerebellum is not an ideal reference region because we did observe some specific binding (albeit small) in this region during the metergoline challenge experiments. Nonetheless, this estimate was sufficient for a preliminary comparison of baseline scans to those following a pharmacological challenge.
Baseline BPND in the occipital cortex was 0.3 and was considerably reduced by pretreatment with metergoline and altanserin, but not with citalopram. For comparison, baseline BPND for [18F]altanserin in the occipital cortex is approximately 3. Blockade of [11C]metergoline binding with altanserin suggests 5HT2a binding dominates when metergoline is administered at these low tracer concentrations. Unfortunately, the high degree of non-specific binding clearly limits the dynamic range for BPND and the potential utility of [11C]metergoline as a PET radiotracer.
2.3.1 PDSP Receptor Binding Analysis
We also submitted metergoline to the Psychoactive Drug Screening Program (PDSP) for full in vitro binding characterization, Table 1. As expected, metergoline inhibited many of the 5HT receptor subtypes at low nanomolar concentrations. Consistent with other reports, metergoline showed high affinity in the screen for dopamine receptors, particularly D1 and D4, as well as muscarinic receptors. We also observed nanomolar interactions with norepinephrine and opioid receptors.
Table 1.
*. NIMH Psychoactive Drug Screening Program (PDSP) data for metergoline.
| Receptor | Ki, IC50, Kd (nM) | Receptor | Ki, IC50, Kd (nM) | Receptor | Ki, IC50, Kd (nM) |
|---|---|---|---|---|---|
| 5HT1a | 10 | ||||
| 5HT1b | 28 | D1 | 9 | α1a | 30/97.7** |
| 5HT1d | 0.9 | D2 | 74 | α1b | 123 |
| 5HT1e | 1659 | D3 | 14 | α1d | 91 |
| 5HT2a | 7.1 | D4 | 4.9 | α2a | 31 |
| 5HT2b | 2.6 | α2b | 41 | ||
| 5HT2c | 9.5 | H1 | 98.2** | α2c | 30 |
| 5HT3 | >10,000 | H2 | 110/104** | ||
| 5HT4 | 1274 | H4 | 12.7* | DOR | 18.9* |
| 5HT5a | 562 | KOR | 63.2* | ||
| 5HT6 | 91 | ||||
| 5HT7 | 18 | EP3 | 21.7** | M1 | 1.2** |
| SERT | 89.7** | EP4 | 15.2** | M2 | 17.7** |
| NET | 1132 | M3 | 3.8** | ||
| M4 | 36.9** |
See PDSP website for experimental details for each assay.
denotes primary binding assay.
The high affinity promiscuity of metergoline obviously limits our ability to interpret PET imaging data for [11C]metergoline even though we noted large reductions in specific binding with a 5HT2a selective drug pretreatment.
2.4 Pharmacokinetics and Distribution (Peripheral)
Dynamic PET imaging was also performed with the baboon torso in the field of view to examine peripheral organ pharmacokinetics and distribution. Representative time-activity curves for [11C]metergoline and its radioactive metabolites are given in Figure 5. Gall-bladder was primary site of accumulation reaching 0.3–0.5%ID/cc.
Figure 5.
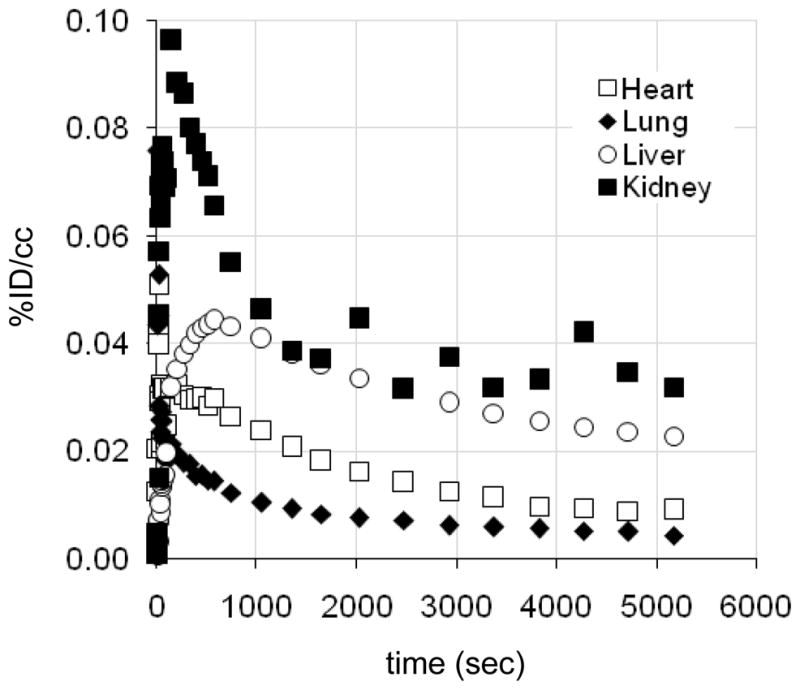
Representative time-activity curves (TACs) for baboon peripheral organs. (Gall bladder omitted).
Serotonin receptors are found throughout the periphery with high concentration in the gut, smooth muscle, and on platelets. Thus, we wanted to determine if [11C]metergoline would exhibit specific binding to peripheral 5HT receptors, which have been targets for appetite suppression.13 We were also interested in examining heart uptake, given that several ergot (and related) drugs targeting 5HT receptors (particularly 5HT2b) have been associated with cardiac fibrosis and pulmonary hypertension.14 From baseline PET scans, we were intrigued by uptake of carbon-11 in the heart wall, Figure 6. This uptake was not affected pretreatment with unlabeled metergoline and does not likely represent a specific receptor interaction.
Figure 6.
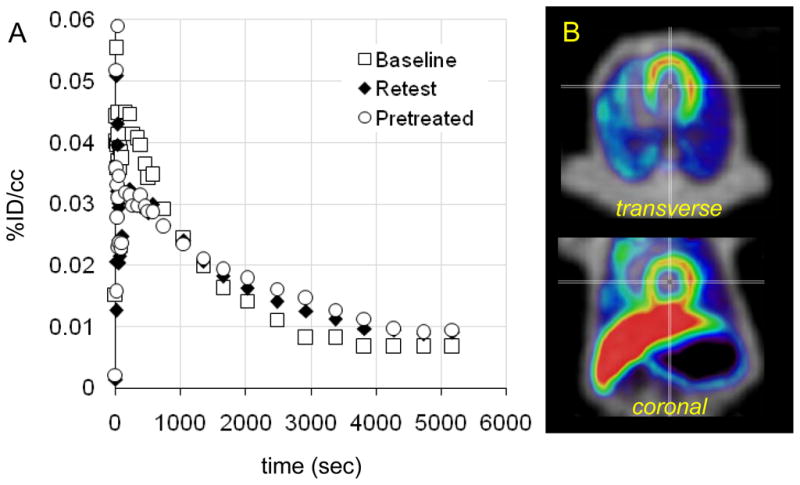
Preliminary assessment of [11C]metergoline uptake in the baboon heart. (a) Time-activity curves for a region of interest placed on the heart wall during three PET scans. Pretreatment with cold metergoline (1 mg i.v., 10 min prior to radiotracer administration) was used to assess binding saturability. (b) Representative images showing heart uptake (PET data summed from 5–20 min, NIH color scale) overlaid on transmission data (grayscale).
3. Conclusions
Metergoline can be efficiently and reproducibly labeled with carbon-11 using a DBU-mediated direct fixation of high specific activity 11CO2. [11C]Metergoline has good brain penetration and uptake in non-human primates, with kinetics suitable for quantitative analysis; however blocking studies revealed that [11C]metergoline exhibits a mixture of specific and non-specific binding which limits its usefulness as a radiotracer. [11C]Metergoline binding was not sensitive to pre-synaptic SERT blockade and the resulting increase in synaptic serotonin with citalopram. PET imaging studies revealed non-saturable accumulation of [11C]metergoline and/or its metabolites in the heart. Given the past and likely continued use of metergoline, the characterization of [11C]metergoline pharmacokinetics and binding in vivo should improve of interpretation behavioral pharmacology experiments.
4. Methods
4.1. General
[11C]Carbon dioxide was generated from a nitrogen/oxygen (1000 ppm) target (14N(p,α)11C) using an EBCO TR 19 cyclotron (Advanced Cyclotron Systems INC. Richmond, Canada). High performance liquid chromatography (HPLC) purification was performed by a Knauer HPLC system (Sonntek Inc., Woodcliff Lake, NJ, USA) with a model K-5000 pump, a Rheodyne 7125 injector, a model 87 variable wavelength monitor, and a NaI radioactivity detector.
Specific activity was determined by measuring the radioactivity and the mass; the latter was derived from a standard curve (UV absorbance at 254 nm by peak area) after HPLC injection of different quantities of the authentic reference compound. Radiochemical purity was determined by HPLC and verified by thin-layer chromatography (TLC) using and measuring radioactivity distribution on Macherey–Nagel polygram sil G/UV254 plastic-backed TLC plates with a Bioscan system 200 imaging scanner (Bioscan Inc., Washington, DC). 11C-Radioactivity was measured by a MINAXI γ 5000 automated gamma counter (Packard Instrument, Meriden, CT). All measurements were decay corrected. All chemicals were purchased from Sigma-Aldrich, with the exception of anhydrous DMF, which was obtained from Acros Organics (USA).
4.2 Chemistry
4.2.1. Synthesis of Labeling Precursor (2)
Metergoline (300 mg, 0.74 mmol) was dissolved in 15 ml of MeOH and 50 mg of palladium on activated charcoal (10% wt) was added. While stirring, the mixture was sparged with a slow stream of hydrogen gas for 20 minutes. The reaction flask was sealed under an atmosphere of H2 (using a H2 filled balloon) and stirred at room temperature. Reaction progress was monitored by TLC (MeOH as the eluent) until no metergoline remained (typically 12–16h). At this point, the reaction mixture was filtered through celite to remove the activated charcoal and the solvent was removed under reduced pressure. The resulting residue was dissolved in a small volume of ethyl acetate and concentrated under reduced pressure. This process was repeated until a white solid remained (60 mg, 0.22 mmol, 30%), which required no additional purification. 1H NMR (400 MHz, CDCl3), δ: 7.20 (t, J = 8 Hz, 1H), 7.12 (d, J = 8 Hz, 1H), 6.93 (d, J = 4 Hz, 1H), 6.74 (s, 1H), 3.76 (s, 3H), 3.43–3.38 (dd, J =16 Hz, 4 Hz, 1H), 3.13 (d, J = 8 Hz, 1H), 2.98 (m, 1H), 2.76–2.66 (m, 4H), 2.49 (s, 3H), 2.18–2.12 (m, 1H), 1.96–1.91 (m, 2H), 1.15–1.06 (q, J = 12 Hz, 1H). 13C NMR (125 MHz, CDCl3), δ: 134.6, 133.8, 126.7, 122.9, 122.7, 112.8, 111.0, 106.9, 67.8, 62.0, 46.8, 43.6, 40.8, 39.6, 33.0, 32.4, 27.2.
4.2.2. Synthesis of [11C]Metergoline (3)
Labeling precursor 2 (1 mg) dissolved in 100 μL of DMF was combined with 100 μL of a solution of DBU (300 mM in DMF) and then treated with a 100 μL aliquot of benzyl chloride (300 mM in DMF) in a cone-bottom 5 mL reaction vessel equipped with a septum and screw cap. The resulting solution was sparged with helium for 15 min. At the end-of-bombardment, the target gas from the cyclotron was passed through the solution and 11CO2 was captured. The expansion of the target gas through the reaction solution required ~2.5 min. During some syntheses,11CO2 from the target was captured on Alltech 4Å, 50–80 mesh crushed mol. sieves (330 mg packed in a ¼” ID SS tube) using a custom built trap and release module. The 11CO2 was released from the mol. sieves at 250–300°C in a stream of helium (~50 mL/min) and captured in the precursor/DBU solution as detailed above. This process required 5–6 min.
After 11CO2 was captured in the reaction solution (using either method), the vessel was then heated to 75°C for 7.5 min at which time 100 μL of trifluoroacetic acid was added. The volatile activity was removed by sparging the solution with He. (This required ~0.5 min). The solution was diluted with 1.0 ml of water and purified by HPLC (Luna C18(2) column (250 × 10 mm, 5 μm particles) using a two solvent (A:B) gradient elution at 5mL/min: Solvent A: 0.1M (aq) ammonium formate, Solvent B: MeCN; 80:20 for 3 min, changing to 10:90 linearly from 3–23 min and holding until 30 min). The fraction containing [11C]metergoline was collected (retention time 15.5–16.5 min), and the solvent was removed on a rotary evaporator. Following purification and concentration, [11C]metergoline was dissolved in saline (4.0 mL) and the resulting solution was filtered through an Acrodisc 13-mm Syringe Filter with 0.2 μm HT Tuffryn Membrane (Pall Corporation, Ann Arbor, MI) into a sterile vial for delivery to the imaging facility. The radiochemical yield based on the loss of volatile 11CO2 and HPLC was typically 35% (decay corrected to EOB). Specific activity for the imaging studies was 3.2–5.1Ci/μmol (calculated at EOB). Typical radiosynthesis and purification time was 45 min.
For quality control (i.e. identity verification and radiochemical purity), analytical TLC and HPLC were performed. [11C]Metergoline was cospotted with unlabelled (i.e. non-radioactive) standard and analyzed by radioTLC (MeOH with 0.1% TEA, Rf = 0.5). Analytical HPLC was accomplished using a Phenomenex Gemini C18 column (250 × 4.6 mm, 5 μm particles) using an isocratic elution (1.0 ml/min, 60% aqueous mobile phase to 40% MeCN). Using this method, [11C]metergoline eluted at 8.5 min. Radiochemical purity exceeded 99% as determined by both radioHPLC and radioTLC and chemical purity was >95% as determined from analytical HPLC with 254 nm detection.
4.3 LogD Determination
An aliquot (~50 μl) of the formulated [11C]metergoline was added to a test tube containing 2.5 mL of octanol and 2.5 mL of phosphate buffer solution (pH 7.4). The test tube was mixed by vortex for 2 min and then centrifuged for 2 min to fully separate the aqueous and organic phase. A sample taken from the octanol layer (0.1 mL) and the aqueous layer (1.0 mL) were saved for radioactivity measurement. An additional aliquot of the octanol layer (2.0 mL) was carefully transferred to a new test tube containing 0.5 mL of octanol and 2.5 mL of phosphate buffer solution (pH 7.4). The previous procedure (vortex mixing, centrifugation, sampling, and transfer to the next test tube) was repeated until six sets of aliquot samples had been prepared. The radioactivity of each sample was measured in a well counter (Picker, Cleveland, OH). The logD of each set of sample was derived by the following equation: logD = log (decay-corrected radioactivity in octanol sample × 10/decay-corrected radioactivity in phosphate buffer sample).
4.4 Plasma Protein Binding Assay
An aliquot of [11C]metergoline in saline (10 μl) was added to a sample of baboon plasma (0.8-mL, pooled from at least 4 separate animals). The mixture was gently mixed by repeated inversion and incubated for 10 min at room temperature. Following incubation a small sample (20 μl) was removed to determine the total radioactivity in the plasma sample (AT; AT=Abound+Aunbound). An additional 0.2 mL of the plasma sample was placed in the upper compartment of a Centrifree® tube (Amicon, Inc., Beverly, MA) and then centrifuged for 10 min. The upper part of the Centrifree tube was discarded and an aliquot (20 μl) from the bottom part of the tube was removed to determine the amount of radioactivity that passed through the membrane (Aunbound). Plasma protein binding was derived by the following equation: % unbound=Aunbound×100/AT.
4.5 PET imaging and arterial plasma sampling
All experiments with animals were approved by the Brookhaven Institutional Animal Care and Use Committee. Four female Papio anubis baboons were used for the 15 PET scans performed for this study. Anesthesia was accomplished by an intramuscular injection of ketamine hydrochloride (10 mg/kg) and then maintained with oxygen (800 mL/min), nitrous oxide (1500 mL/min) and isoflurane (Forane, 1–4%) during scanning. [11C]Metergoline was injected through a catheter placed in a radial arm vein, and arterial blood was sampled through a catheter in the popliteal artery at the following time intervals: every 5 s for 2 min, then 2, 5, 10, 20, 30, 45, 60 and 90 min. Heart rate, respiration rate, pO2 and body temperature were checked during the PET scanning. Dynamic PET imaging was performed by Siemens HR+ (Siemens high-resolution, whole-body PET scanner with 4.5×4.5×4.8 mm resolution at the center of field of view) with the brain or torso in the field of view, for a total of 90 min with the following 55 time frames in 3D mode: 12×5, 12×10, 6×20, 6×30, 8×60, 2×120, 4×300, 5×600 s. Prior to each emission scan, a transmission scan was obtained by rotating a 68Ge rod source to correct for attenuation. A total of 15 studies in the baboon were conducted (3 × brain, 1 × torso kinetics, 1 × whole body following dynamic brain scan), with an average injected dose of 3.72 ± 0.90 mCi (n = 15).
Six of the studies were performed (as detailed above) following intravenous pretreatment with one of the following drugs: metergoline (n = 2, brain; n = 1 torso), citalopram (n = 2), and altanserin (n = 1). Metergoline (1 mg) was dissolved in a solution of 0.5 mL EtOH and 0.5 mL 0.1 M HCl and passed through a sterilizing filter into a multi-injection vial containing 9 mL of sterile saline. The 1mg (10 mL) metergoline pretreatment was administered as a bolus 10 min prior to injection of [11C]metergoline. Citalopram-HBr (5.0 mg/kg based on the free base) was dissolved in 10 mL of saline and passed through a sterilizing filter into a multi-injection vial. The citalopram solution was administered as a bolus 20 min prior to injection of [11C]metergoline. Altanserin (0.5 mg/kg) was dissolved in 1.5 mL of 2% HCl in EtOH, diluted to 30 mL with saline, and passed through a sterilizing filter (final pH ~5.5). Altanserin was administered 15 min prior to injection of [11C]metergoline.
4.6 Plasma Metabolite Analysis
The percent of unmetabolized radiotracer in the sampled baboon plasma was determined using a robot solid phase extraction (SPE) method and validated using manual HPLC analysis.15 For the robot SPE method baboon plasma (~0.2 ml), sampled at given time points during the PET study (typically 1, 5, 10, 30, 60 and 90 min), was added to water (3 ml) at room temperature and mixed by vortex. The mixture was then applied onto Varian BondElut CN cartridges (500 mg, preconditioned with 5 ml methanol followed 5 ml water then preloaded with 2 ml of deionized water). Polar metabolites were removed by two 5 ml deionized water rinses. The percentage radioactivity remaining on the cartridge was reported as the % of unmetabolized radiotracer. A control consisting of baboon plasma at time zero was mixed with radiotracer and analyzed to confirm that unmetabolized radiotracer did not elute under these conditions. For validation by HPLC, baboon plasma (0.2–0.5 ml) sampled at various time points during the PET study was counted, added to a solution of unlabeled standard (20 μl of a 1 mg/ml solution) in methanol (.5 ml), subjected to an ultrasonic cell disruptor and centrifuged. Both supernatant and pellet were counted to determine the percent extracted. The supernatant was analyzed by HPLC (Phenonenx Ultramex 5 C18 5u 250 × 5.6 mm column using 80:20 MeOH: 0.1 M ammonium formate with 0.1% triethylamine at 1.2 mL/min). The fraction of radioactivity coeluting with the unlabeled standard, relative to the total radioactivity collected from the HPLC column was reported as the % of unmetabolized radiotracer, Figure 7. Total activity recovered from the HPLC column was compared to a counting standard; generally recoveries from the column were 92–110%.
Figure 7.
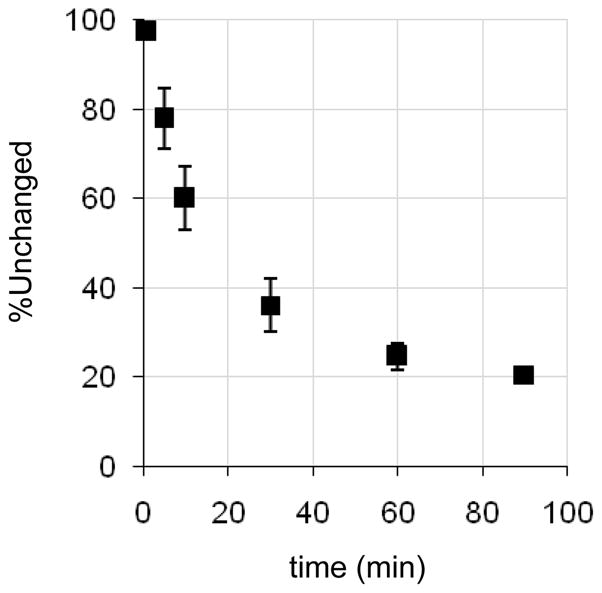
Evaluation of [11C]metergoline metabolism using plasma samples.
4.7 Image analysis
Emission data from the dynamic scans (PET) were corrected for attenuation and reconstructed using filtered back projection. After ECAT7 files were converted to ANALYZE format and time frames 5–30 were summed for each file, images were coregistered with published template images16 (H215O PET and MR) manually and then normalized (12 nonlinear iterations) using PMOD® (PMOD Technologies, Ltd). Regions of interest (ROIs) on the baboon and rodent brain were drawn on summed images and then projected to the dynamic images to obtain time activity curves (TACs) expressed as %injected dose/cm3 (decay corrected) versus time. Regions of interest (ROIs) on the baboon brain were drawn on summed images and then projected to the dynamic images to obtain time activity curves (TACs) expressed as %injected dose/cm3 (decay corrected) versus time. A common ROI file was used to generate TACs each study. Torso data we were analyzed using Amide Software and manually drawn 3-D ROIs.
4.8 Image analysis
Logan graphical analysis derived from the TACs and metabolite-correct plasma data was used to determine distribution volume (VT).17 This analysis was accomplished with General Kinetic Modeling Tool (PKIN) in PMOD. Binding potential (BPND) was calculated by taking the ratio of a given VT to a reference region (cerebellum) and subtracting 1 (the presumed non-specific contribution).
Figure 4.
Assessment of [11C]metergoline binding and specificity. Data presented are from Logan graphical analysis of occipital cortex TACs.
Acknowledgments
This work was carried out at Brookhaven National Laboratory under contract DE-AC02-98CH10886 with the U.S. Department of Energy, supported by its Office of Biological and Environmental Research. J.M.H. was supported by an NIH Postdoctoral Fellowship (1F32EB008320-01) and through the Goldhaber Distinguished Fellowship program at BNL. The authors are grateful to Dr. Michael Schueller for cyclotron operation and the PET imaging team at BNL (Pauline Carter, Payton King, and Don Warner) for carrying out primate imaging experiments and to Dr. Joanna Fowler for scientific input. The receptor binding profile for metergoline was generously provided by the National Institute of Mental Health’s Psychoactive Drug Screening Program, Contract # HHSN-271-2008-00025-C (NIMH PDSP). The NIMH PDSP is Directed by Bryan L. Roth MD, PhD at the University of North Carolina at Chapel Hill and Project Officer Jamie Driscol at NIMH, Bethesda MD, USA.
References
- 1.(a) Graeff FG, Zuardi AW, Giglio JS, Lima Filho EC, Karniol IG. Psychopharmacology (Berl) 1985;86:334. doi: 10.1007/BF00432224. [DOI] [PubMed] [Google Scholar]; (b) Martini A, Moro E, Marrari P, Pacciarini MA, Sega R, Dell’Osso L, Bertelli A, Jr, Tamassia V. Int J Clin Pharmacol Res. 1983;3:27. [PubMed] [Google Scholar]; (c) Roca CA, Schmidt PJ, Smith MJ, Danaceau MA, Murphy DL, Rubinow DR. Am J Psychiatry. 2002;159:1876. doi: 10.1176/appi.ajp.159.11.1876. [DOI] [PubMed] [Google Scholar]
- 2.Turner EH, Schwartz PJ, Lowe CH, Nawab SS, Feldman-Naim S, Drake CL, Myers FS, Barnett RL, Rosenthal NE. J Clin Psychopharmacol. 2002;22:216. doi: 10.1097/00004714-200204000-00018. [DOI] [PubMed] [Google Scholar]
- 3.(a) Ferrari C, Reschini E, Peracchi M, Crosignani PG. Gynecol Obstet Invest. 1980;11:1. doi: 10.1159/000299801. [DOI] [PubMed] [Google Scholar]; (b) Caballero A, Sr, Mena P, Caballero-Diaz JL, Caballero-Asensi A. J Reprod Med. 1987;32:115. [PubMed] [Google Scholar]
- 4.Nothling JO, Gerber D, Gerstenberg C, Kaiser C, Dobeli M. Theriogenology. 2003;59:1929. doi: 10.1016/s0093-691x(02)01292-x. [DOI] [PubMed] [Google Scholar]
- 5.(a) Bonhaus DW, Weinhardt KK, Taylor M, DeSouza A, McNeeley PM, Szczepanski K, Fontana DJ, Trinh J, Rocha CL, Dawson MW, Flippin LA, Eglen RM. Neuropharmacology. 1997;36:621. doi: 10.1016/s0028-3908(97)00049-x. [DOI] [PubMed] [Google Scholar]; (b) Nelson DL, Lucaites VL, Audia JE, Nissen JS, Wainscott DB. J Pharmacol Exp Ther. 1993;265:1272. [PubMed] [Google Scholar]; (c) Millan MJ, Newman-Tancredi A, Lochon S, Touzard M, Aubry S, Audinot V. Pharmacol Biochem Behav. 2002;71:589. doi: 10.1016/s0091-3057(01)00716-x. [DOI] [PubMed] [Google Scholar]; (d) Knight AR, Misra A, Quirk K, Benwell K, Revell D, Kennett G, Bickerdike M. Naunyn Schmiedebergs Arch Pharmacol. 2004;370:114. doi: 10.1007/s00210-004-0951-4. [DOI] [PubMed] [Google Scholar]
- 6.Beretta C, Ferrini R, Glasser AH. Nature. 1965;207:421. doi: 10.1038/207421a0. [DOI] [PubMed] [Google Scholar]
- 7.For examples see: Leibowitz SF, Alexander JT, Cheung WK, Weiss GF. Pharmacol Biochem Behav. 1993;45:185. doi: 10.1016/0091-3057(93)90103-z.Steffens SM, da Cunha IC, Beckman D, Lopes AP, Faria MS, Marino-Neto J, Paschoalini MA. Physiol Behav. 2008;95:484. doi: 10.1016/j.physbeh.2008.07.019.Halford JC, Blundell JE. Pharmacol Biochem Behav. 1996;54:745. doi: 10.1016/0091-3057(95)02228-7.Eide PK, Joly NM, Lund A. Pharmacol Toxicol. 1991;69:361. doi: 10.1111/j.1600-0773.1991.tb01311.x.
- 8.Hooker JM, Reibel AT, Hill SM, Schueller MJ, Fowler JS. Angew Chem Int Ed Engl. 2009;48:3482. doi: 10.1002/anie.200900112. [DOI] [PMC free article] [PubMed] [Google Scholar]
- 9.Hamon M, Mallat M, Herbet A, Nelson DL, Audinot M, Pichat L, Glowinski J. J Neurochem. 1981;36:613. doi: 10.1111/j.1471-4159.1981.tb01634.x. [DOI] [PubMed] [Google Scholar]
- 10.For examples see: Kumar JS, Mann JJ. Drug Discov Today. 2007;12:748. doi: 10.1016/j.drudis.2007.07.008.Ito H, Nyberg S, Halldin C, Lundkvist C, Farde L. J Nucl Med. 1998;39:208.Kumar JS, Prabhakaran J, Erlandsson K, Majo VJ, Simpson NR, Pratap M, Van Heertum RL, Mann JJ, Parsey RV. Nucl Med Biol. 2006;33:565. doi: 10.1016/j.nucmedbio.2006.02.001.Lemaire C, Cantineau R, Guillaume M, Plenevaux A, Christiaens L. J Nucl Med. 1991;32:2266.Houle S, Ginovart N, Hussey D, Meyer JH, Wilson AA. Eur J Nucl Med. 2000;27:1719. doi: 10.1007/s002590000365.Suehiro M, Scheffel U, Ravert HT, Dannals RF, Wagner HN., Jr Life Sci. 1993;53:883. doi: 10.1016/0024-3205(93)90440-e.Tarkiainen J, Vercouillie J, Emond P, Sandell J, hiltunen J, Frangin Y, Guilloteau D, Halldin C. J Label Compd and Radiopharm. 2001;44:1013.Saigal N, Pichika R, Easwaramoorthy B, Collins D, Christian BT, Shi B, Narayanan TK, Potkin SG, Mukherjee J. J Nucl Med. 2006;47:1697.Herth MM, Piel M, Debus F, Schmitt U, Luddens H, Rosch F. Nucl Med Biol. 2009;36:447. doi: 10.1016/j.nucmedbio.2009.01.012.
- 11.Dischino DD, Welch MJ, Kilbourn MR, Raichle ME. J Nucl Med. 1983;24:1030. [PubMed] [Google Scholar]
- 12.For recent examples, see: Kupers R, Frokjaer VG, Naert A, Christensen R, Budtz-Joergensen E, Kehlet H, Knudsen GM. Neuroimage. 2009;44:1001. doi: 10.1016/j.neuroimage.2008.10.011.Marner L, Knudsen GM, Haugbol S, Holm S, Baare W, Hasselbalch SG. Eur J Nucl Med Mol Imaging. 2009;36:287. doi: 10.1007/s00259-008-0945-4.Matusch A, Hurlemann R, Rota Kops E, Winz OH, Elmenhorst D, Herzog H, Zilles K, Bauer A. J Neural Transm. 2007;114:1433. doi: 10.1007/s00702-007-0751-3.Adams KH, Pinborg LH, Svarer C, Hasselbalch SG, Holm S, Haugbol S, Madsen K, Frokjaer V, Martiny L, Paulson OB, Knudsen GM. Neuroimage. 2004;21:1105. doi: 10.1016/j.neuroimage.2003.10.046.
- 13.For recent review, see: Garfield AS, Heisler LK. J Physiol. 2009;587:49. doi: 10.1113/jphysiol.2008.164152.
- 14.Smith SA, Waggoner AD, de las Fuentes L, Davila-Roman VG. J Am Soc Echocardiogr. 2009;22:883. doi: 10.1016/j.echo.2009.05.002. [DOI] [PMC free article] [PubMed] [Google Scholar]
- 15.Alexoff DL, Shea C, Fowler JS, King P, Gatley SJ, Schlyer DJ, Wolf AP. Nucl Med Biol. 1995;22:893. doi: 10.1016/0969-8051(95)00042-v. [DOI] [PubMed] [Google Scholar]
- 16.Black KJ, Snyder AZ, Koller JM, Gado MH, Perlmutter JS. Neuroimage. 2001;14:736. doi: 10.1006/nimg.2001.0752. [DOI] [PubMed] [Google Scholar]
- 17.Logan J Nucl Med Biol. 2003;30:833. doi: 10.1016/s0969-8051(03)00114-8. [DOI] [PubMed] [Google Scholar]


