

SUMMARY
Streptococcus mutans and Streptococcus sobrinus are considered the primary organisms responsible for human dental caries. The ability to generate acids and to adapt to low pH conditions is directly associated with the cariogenic potential of these bacteria. To survive acidic conditions, both species have been shown to mount an acid tolerance response (ATR). However, previous characterization of the S. sobrinus ATR identified critical differences in the mechanisms of acid adaptation between S. mutans and S. sobrinus. Here, interspecies microarray and proteomic approaches were used to identify novel, previously unrecognized genes and pathways that participate in the S. sobrinus acid stress response. The results revealed that, among other things, metabolic alterations that enhance energy generation and upregulation of the malolactic fermentation enzyme activity constitute important acid resistance properties in S. sobrinus. Some of these acid adaptive traits are shared by S. mutans and might be considered optimal targets for therapeutic treatments designed to control dental caries.
Keywords: caries, mutans streptococci, acid stress, mleS
INTRODUCTION
Dental caries is a complex and diverse disease that results from interactions of acidogenic/aciduric bacteria colonizing the tooth surface with the oral environment. Although other species may also be involved, two species of the mutans streptococci (MS) group, Streptococcus sobrinus (serotypes d and g) and Streptococcus mutans (serotypes c, e, f and k) are considered major etiological agents of human dental caries (Liljemark & Bloomquist, 1996, Lemos & Burne, 2008, Loesche, 1986). The implication of MS in dental caries is grounded on at least four factors; (i) MS are isolated in high numbers from carious lesions, (ii) are absent or found in low numbers in caries-free subjects, (iii) in vitro studies demonstrated that MS are highly acidogenic and aciduric, and (iv) experiments with animals confirmed the extreme cariogenic nature of these organisms. It is generally accepted that S. mutans can be more frequently isolated from carious lesions than S. sobrinus (Loesche, 1986, Carlsson et al., 1987). However, a number of studies suggested that S. sobrinus may be more cariogenic than S. mutans (de Soet et al., 1991, de Soet et al., 1989, Beighton, 2005), and is more closely associated with smooth surface caries (Lindquist & Emilson, 1991). In addition, clinical studies have suggested that children harboring both S. mutans and S. sobrinus had a higher incidence of dental caries than those with S. mutans alone (Okada et al., 2005).
The virulence of MS is directly related to properties that enable these organisms to colonize and thrive on the tooth surfaces during acidic conditions. These properties include the production of extracellular polysaccharides such as glucans that allow the bacteria to firmly adhere to the tooth surface in a biofilm, the ability to metabolize sugars obtained from salivary glycoproteins and from the host diet to generate acid end products (acidogenicity), and the ability to tolerate abundant amounts of lactic acid generated by the metabolism of these sugars (aciduricity) (Lemos & Burne, 2008).
In addition to being inherently aciduric, both S. mutans and S. sobrinus are able to mount and acid tolerance response (ATR). In S. mutans, the ATR is characterized by increased acid resistance, enhanced glycolytic capacities, increased activity of the H+-translocating F1F0 ATPase enzyme, cell envelope alterations, and possibly, cytoplasmic alkalinization (Belli & Marquis, 1991, Fozo & Quivey, 2004, Griswold, et al., 2006, Hamilton & Buckley, 1991, Quivey et al., 2000, Sheng & Marquis, 2007). While the ATR of S. mutans have been studied in considerable detail, much less is known about the mechanisms employed by S. sobrinus to survive environmental acidification. Factors such as the genetic amenability of S. mutans and availability of the S. mutans UA159 genome sequence (Ajdic et al., 2002) have clearly contributed to this disparity. Moreover, because of the close relatedness of these two species, the mechanisms for acid adaptation of these bacteria have tacitly been considered to be identical. However, an initial physiologic characterization of the S. sobrinus ATR revealed that there are critical differences in the mechanisms of acid adaptation between S. mutans and S. sobrinus (Nascimento et al., 2004). More specifically, while the ATR of S. sobrinus is also characterized by increased acid resistance and enhanced glycolytic capacities, this organism appears to rely on different strategies to adapt to growth at low pH. For example, while the acid adaptation of S. mutans is directly correlated to increases in F-ATPase activity (Belli & Marquis, 1991, Hamilton & Buckley, 1991), the F-ATPase enzyme activity showed no significant increases in expression in S. sobrinus cells grown at an acidic pH (Nascimento et al., 2004). Instead, expression of the S. sobrinus glucose-specific phosphoenoylpyruvate sugar:phosphotransferase system (PTS) was enhanced by growth at low pH. Interestingly, the glucose-PTS of S. mutans shows the opposite trend and was repressed during growth at low pH (Nascimento et al., 2004, Hamilton & Ellwood, 1978, Vadeboncoeur et al., 1987). In addition to differences in the activities of the F-ATPase during acid adaptation, work from the Quivey lab showed that S. mutans UA159 increases the proportions of long-chained monounsaturated membrane fatty acids in response to the acidification of the environment but found only modest changes in the membrane fatty acid composition of S. sobrinus 6715 grown under the same conditions (Quivey et al., 2000). Collectively, these results indicate that there are important differences in the mechanisms underlying acid tolerance in these two closely related species. Thus, the continued identification and dissection of the mechanisms associated with the acid stress responses of S. sobrinus is central for developing a complete understanding of the pathogenesis of dental caries.
In this report, we further characterized the acid adaptive mechanisms of S. sobrinus by using a combination of transcriptomic and proteomic analysis. In particular, we took advantage of the close genetic relatedness between S. mutans and S. sobrinus and the availability of S. mutans UA159 DNA microarrays, and used interspecies microarray hybridizations to identify previously unrecognized genes and pathways that participate in the S. sobrinus acid stress responses.
METHODS
Growth conditions
S. sobrinus 6715 was grown in a BioFlo2000 Fermentor (New Brunswick Scientific, Edison, N.J.) with a working volume of 1 L in TY base medium (3% tryptone and 0.5% yeast extract) containing 1% glucose. The dilution rate of the culture was 0.24 h−1, resulting in a generation time of 2.9 h. Initially, the culture was maintained at pH 7 by addition of 2 N KOH. After 10 generations and a cell density of approximately 1.4 at OD600, cultures were considered to have achieved steady-state, and 40 ml aliquots were harvested from the vessel by aspiration, centrifuged at 4000 rpm for 12 min at 4°C, pellets were quick-frozen in a dry-ice ethanol bath and stored at − 80°C for later analysis (unadapted cells). Cells growing at pH 7 steady-state were acid shocked to pH 5 using 2 N HCl. Titration time of the vessel from pH 7 to pH 5 was about 2 min. Cells were allowed to recover at pH 5 for another 10 generations, reaching a cell density of approximately 1.1 at OD600 before samples were harvested (acid-adapted cells). Three additional chemostat runs were obtained for a total of four independent experiments.
To compare the levels of malolactic fermentation (MLF) of cells grown in acidic pH with those cells grown at neutral pH, S. mutans UA159 and S. sobrinus 6715 were grown for 16 h at 37°C in TY broth containing 25 mM glucose and 25 mM L-malate at pH 7 and pH 5.5. The pH 7 culture was buffered with potassium phosphate (0.2 M) and the acidic TY medium was adjusted to pH 5.5 using 2 N HCl.
Genomic DNA microarrays
In order to determine whether S. mutans UA159 microarray slides were suitable to study the transcriptome of S. sobrinus 6715, we hybridized S. sobrinus 6715 genomic DNA to the S. mutans UA159 slide array. The UA159 microarrays used were obtained from the Pathogen Function Genomics Resource Center (PFGRC) at the J. Craig Venter Institute. Each slide has 1,948 70-mer oligonucleotides printed on the surface of the slide, representing 1,960 open reading frames. Additional information about the UA159 arrays can be found at http://pfgrc.jcvi.org/index.php/microarray/array_description/streptococcus_mutans/version1.html. To perform the genomic DNA hybridizations, S. mutans UA159 and S. sobrinus 6715 genomic DNA were extracted as described elsewhere (Burne et al., 1987) and sheared into fragments of approximately 300 to 600 bp by two sonication steps of 1 min each. The sheared DNA was purified using QIAquick PCR purification kit (Qiagen, Chatsworth, CA) and eluted in sterile water. Then, 1 µg of sheared DNA was treated with Klenow and labeled with Cy3 or Cy5 as detailed in the M009 protocol provided by PFGRC (http://pfgrc.jcvi.org/index.php/microarray/protocols.html). The labeled S. sobrinus genomic DNA was hybridized to S. mutans array slides at 42°C using different concentrations of formamide in the hybridization buffer.
cDNA Microarrays
RNA was isolated from unadapted (pH 7, steady-state) and acid-adapted (pH 5, steady-state) S. sobrinus 6715 chemostat cell pellets as detailed elsewhere (Abranches et al., 2006). A reference RNA was prepared from a large-scale culture of S. sobrinus 6715 cells grown in BHI to an optical density of 0.5 at 600 nm. The benefits and analytical methods associated with the utilization of a reference RNA as a normalization tool in microarray experiments are discussed elsewhere (Liu & Slininger, 2007). The S. sobrinus 6715 cDNA that was hybridized to the S. mutans UA159 arrays was generated according to PFGRC protocol found at http://pfgrc.jcvi.org/index.php/microarray/protocols.html, with minor changes. Briefly, 5 µg of RNA was incubated with SuperScriptIII Reverse Transcriptase (Invitrogen, Carlsbad, CA) to increase the amount of cDNA synthesized. The aminoallyl-labeled reference cDNA was coupled with Cy-5 mono-Reactive Dye (Amersham Biosciences, Piscataway, NJ) and the aminoallyl-labeled chemostat RNA at both pH 5 steady-state and pH 7 steady-state were coupled with Cy-3 mono-Reactive Dye (Amersham Biosciences). The Cy5 and Cy3 probes were dried separately under vacuum. The hybridization of the labeled cDNA probes was carried out according to the PFGRC protocol found at http://pfgrc.jcvi.org/index.php/microarray/protocols.html with a single modification: the stringency of the cDNA hybridization buffer was reduced from the recommended 40% formamide to 20% formamide. Each Cy3 and Cy5 labeled probe was resuspended in hybridization buffer and mixed together before heating the mixture at 95°C for 5 min. To obtain statistical power, four probes made from pH 7 steady-state cDNA and four probes made from pH 5 steady-state cDNA were mixed independently with the reference probes and hybridized to 8 independent S. mutans UA159 array slides. The slides were hybridized in a MAUI 4-Bay Hybridization System (BioMicro Systems, Salt Lake City, UT) at 42°C for 16 h. The slides were washed according to PFGRC protocols and were scanned by the GenePix scanner (Axon Instruments, Inc., Union City, CA) at 532 nm (Cy3 channel) and 635 nm (Cy5 channel). Slides were pre-scanned, during which the pixel size was set to 40 µm, the lines to average was set to 1, the sensitivity of the photomultiplier tube (PMT) was adjusted to 33% power and the PMT voltages were adjusted to obtain a Cy5:Cy3 ratio of 1:1. Once the 1:1 ratio was achieved during the pre-scan, the PMT power was adjusted to 100% power, lines to average was set to 2, and the pixel size was set to 5 µm for the full scan.
Microarray data analysis
Microarray data analysis was performed as previously detailed (Abranches et al., 2006). Briefly, single channel images generated from the array slide scans were uploaded into PFGRC Spotfinder software (http://www.tm4.org/spotfinder.html) and images were overlaid. A spot grid that was created according to PFGRC specifications was adjusted manually to fit all the spots within the grid. The intensities of the spots were measured and saved into “.mev” and “.tav” files. Data were normalized using LOWESS and iterative log mean centering with default settings, followed by in-slide replicate analysis using microarray analysis software MIDAS (http://www.tm4.org/midas.html). Statistical analysis with a cut-off P-value of 0.05 was performed using BRB array tools (http://linus.nci.nih.gov/BRB-ArrayTools.html).
Total protein cell lysates for 2D-electrophoresis and Q-TOF MS/MS
Two dimensional (2D) gels were used to compare protein expression profiles from pH 7 and pH 5 steady-state cultures as previously described (Nascimento et al., 2004). For each growth condition, total cell lysates from three independent chemostat runs were analyzed by 2D electrophoresis at Kendrick Labs (Madison, WI), and the gels were stained with a special silver method (O’Connell and Stults, 1997) that omits the glutaraldehyde step and is compatible with downstream identification by mass spectrometry. Selected protein spots with higher intensity at pH 5 that appeared in every gel replicate were excised from one of the gels and sent to the Proteomics and Mass Spectometry Facility at the Donald Danforth Plant Science Center (St. Louis, MO), where proteins were digested with trypsin, and analyzed by using a quadrupole-time of flight mass analyzer (Q-TOF MS/MS). Searches of the peptide electrospray tandem mass spectra were performed against the S. mutans NCBI non-redundant database as well as a bacterial protein database using MASCOT search engine (http://www.matrixscience.com). Unambiguous protein identification was judged by: (i) number of peptide sequences, (ii) protein sequence coverage, (iii) total MASCOT score and individual ion score (a probabilistic implementation of the MOWSE score), and (iv) the quality of the MS/MS spectra judged by a full length y-ion series of peptides comprising at least six consecutive amino acids and no missed cleavages.
Malolactic fermentation assay
The MLF assay was performed as previously described (Sheng & Marquis, 2007) with minor modifications. Briefly, cells were harvested by centrifugation at 4000 rpm for 12 min at 4°C, washed with a 50 mM KCl/1 mM MgCl2 salt solution and starved at 37°C for 1 h. Starved cells were resuspended at a cell density of 1.1 mg cell dry weight ml−1 in potassium phosphate buffer (20 mM, pH 7), and 4.5 ml of the suspension was added to a glass vial. Based on the optimal pH for MLF activity in S. mutans and S. sobrinus (Sheng & Marquis, 2007), vials containing S. mutans were adjusted to pH 4 and the vials with S. sobrinus were adjusted to pH 4.5. Malolactic fermentation was initiated by adding 0.5 ml of 0.5 M L-malate to pre-warmed (37°C) cell suspension. At selected time points, samples were enzymatically assayed for the presence of L-malate in the supernatant fluid by using a L-malic acid detection kit (Boehringer Mannheim, Darmstadt, Germany).
RESULTS AND DISCUSSION
Adaptation of the S. mutans microarray protocols for interspecies hybridization
Interspecies microarray hybridizations can be used to quickly discover genes that are present in uncharacterized bacterial genomes, providing that the genome sequence of a close relative is available. Because S. mutans and S. sobrinus are phylogenetically related, we considered the utilization of S. mutans microarrays to identify genes associated with acid stress adaptation in S. sobrinus. To assess the feasibility of this approach, we hybridized S. sobrinus 6715 genomic DNA against the S. mutans UA159 slides. By following the conditions recommended by the PFGRC (protocol M008) for hybridization of genomic DNA (i.e., 50% formamide at 42°C for 16 h), 100% of the spots representing coding regions could be detected using S. mutans UA159 genomic DNA. Under those conditions, approximately 80% of the spots could be detected using S. sobrinus genomic DNA. Lowering the formamide concentration from 50% to 30% for the interspecies hybridizations allowed for detection of approximately 90% of the coding spots without causing increases in the background represented by 500 Arabidopsis thaliana 70-mers. Similarly, reducing the concentration of formamide from 40% to 20% in the hybridization buffer for the cDNA microarrays resulted in an increase in the number of spots detected without compromising specificity (fluorescence ratio of 0.99 with only 85 genes without a signal when analyzed with PFGRC Spotfinder software).
Identification of S. sobrinus acid-inducible genes by interspecies microarray
Hybridization of S. sobrinus cDNA obtained from RNA extracted from steady-state cultures grown at pH 7 and pH 5 revealed 93 genes with altered expression (P-value ≤ 0.05); 54 down-regulated and 39 up-regulated at pH 5 (Table 1). The gene encoding the malolactic enzyme (mleS), involved in malolactic fermentation (MLF), displayed the greatest change in the level of transcription in the microarrays (17.9 fold induction) at pH 5. In S. mutans, it has been proposed that MLF, which catalyses the conversion of the dicarboxylic L-malate to the monocarboxylic lactic acid and CO2, contributes to the ATR by increasing the cytoplasmic pH via production of CO2 (Sheng & Marquis, 2007). In addition to mleS, three other genes (smu131, smu127 and smu602) displayed a greater than 7-fold induction at pH 5. These three genes have not been characterized in related streptococci but, based on BLAST searches, are predicted to encode a lipoate-protein ligase (lplA, smu131), E1 component of the α-subunit of a pyruvate/ acetoin dehydrogenase enzyme (adhA, smu127), and a bile acid:sodium-symporter (smu602). Notably, adhA and lplA are closely associated (adhA-adhB-adhC-adhD-lplA) in the S. mutans genome (Ajdic et al., 2002). LplA ligates lipoate, an essential cofactor, to specific metabolic enzyme complexes in E. coli, such as pyruvate dehydrogenases (PDH) (Morris et al., 1994). The PDH enzyme oxidizes pyruvate into acetyl-CoA and CO2, and acetyl-CoA is further catabolized into formate, acetate, and ethanol. PDH is involved in the switch from homofermentation to heterofermentation and has been shown to be active only under aerobic conditions (Carlsson et al., 1985). Heterofermentation is believed to play a role in acid tolerance of S. mutans because the metabolic end-products yield weaker organic acids, CO2, and one additional ATP per pyruvate molecule (Carlsson et al., 1985). In fact, the levels of PDH enzymes were shown to be induced during acid challenge in S. mutans (Welin et al., 2003, Len et al., 2004), and inactivation of a second putative PDH operon (smu1296-smu1299) resulted in an acid-sensitive phenotype (Korithoski et al., 2008). In addition to being converted into alternative acids, acetyl CoA is an essential precursor in the synthesis of fatty acids, amino acids, and other metabolic intermediates in bacteria, and increased amounts of acetyl CoA may be required for de novo synthesis of membrane fatty acids during acid stress.
Table 1.
Genes differentially expressed in S. sobrinus 6715 using interspecies microarrays.
| Unique ID (GenBank) |
Description | Difference (n-fold) of geom. means pH 5/ pH 7 |
Parametric P value |
|---|---|---|---|
| Up-regulated genes | |||
| Energy metabolism | |||
| SMU.137 | malolactic enzyme, mleS | 17.893 | 3.00E-07 |
| SMU.131 | putative lipoate-protein ligase, lplA | 14.891 | 3.00E-07 |
| SMU.127 | pyruvate/ acetoin dehydrogenase, E1 component α, adhA/acoA |
8.646 | 1.4E-06 |
| SMU.1528 | F0F1 membrane-bound proton- translocating ATPase, β subunit, atpD |
2.742 | 0.0032706 |
| SMU.1537 | glycogen biosynthesis protein, glgD | 2.405 | 0.0081713 |
| SMU.670 | aconitate hydratase aconitase, citB/acnA |
2.097 | 0.0146193 |
| SMU.275 | L-ribulose 5-phosphate 4-epimerase, rmpF |
1.857 | 0.0287093 |
| SMU.1115 | lactate dehydrogenase, ldh/lct | 1.850 | 0.0154089 |
| SMU.99 | fructose-1,6-biphosphate adolase, sorG/fbaA |
1.660 | 0.0285881 |
| SMU.1191 | 6-phosphofructokinase, pfkA | 1.593 | 0.0426727 |
| Transport and binding | |||
| SMU.602 | putative sodium-dependent transporter | 7.627 | 0.000666 |
| SMU.1668 | putative branched chain amino acid ABC transporter, livH |
2.892 | 0.001657 |
| SMU.248 | ABC transporter, membrane protein | 1.954 | 0.0072554 |
| SMU.827 | polysaccharide ABC transporter, permease protein, rgpCc |
1.953 | 0.0253459 |
| SMU.1927 | ABC transporter, ATP-binding protein, psaA |
1.880 | 0.0126816 |
| SMU.247 | putative ABC transporter, ATP-binding protein, yurY |
1.758 | 0.0380766 |
| SMU.1347 | ABC transporter permease protein, ylbB |
1.734 | 0.0286651 |
| Amino acid biosynthesis | |||
| SMU.873 | putative homocysteine methyltransferase methionine synthase II, metE/metC |
1.792 | 0.035998 |
| Regulatory functions | |||
| SMU.2044 | stringent response protein, ppGpp synthetase, relA |
2.959 | 0.0357087 |
| SMU.1515 | conserved hypothetical protein CovX (VicX), covX/vicX |
2.368 | 0.0063014 |
| SMU.479 | RNA polymerase-associated protein RpoZ, Ω subunit, rpoZ |
2.047 | 0.0113671 |
| Protein synthesis | |||
| SMU.1311 | asparaginyl-tRNA synthetase, asnS | 1.829 | 0.043923 |
| SMU.1272 | histidyl-tRNA synthase, hisZ/hisS | 1.818 | 0.0466654 |
| Central intermediary metabolism | |||
| SMU.249 | putative NifS protein homologue, class- V aminotransferase, nifS |
3.007 | 0.0005185 |
| SMU.1415 | putative phosphatases involved in N- acetyl-glucosamine catabolism, nagD/ylfH |
2.043 | 0.0240285 |
| DNA metabolism and repair | |||
| SMU.1649 | exodeoxyribonuclease III, exoA/smxA | 2.725 | 0.0006884 |
| SMU.1650 | endonuclease III (DNA repair), end3 | 1.789 | 0.0359052 |
| SMU.991 | similar to ribonucleotide reductase α subunit, nrdE |
2.267 | 0.0059736 |
| Detoxification | |||
| SMU.838 | glutathione reductase, gshR/gor | 1.791 | 0.021416 |
| SMU.1451 | putative alpha-acetolactate decarboxylase, aldB |
2.860 | 0.0018603 |
| Cell division | |||
| SMU.1713 | segregation and condensation protein A, scpA |
1.746 | 0.0334277 |
| SMU.15 | cell division protein FtsH, ftsH | 1.682 | 0.0443664 |
| Hypothetical proteins | |||
| SMU.1700 | hypothetical protein possible LrgB family protein |
3.200 | 0.0121089 |
| SMU.1755 | conserved hypothetical protein | 2.202 | 0.0036035 |
| SMU.573 | conserved hypothetical protein | 2.127 | 0.0468976 |
| SMU.564 | conserved hypothetical protein | 2.125 | 0.0349508 |
| SMU.591 | hypothetical protein | 1.850 | 0.0192613 |
| SMU.748 | hypothetical protein | 1.781 | 0.0370629 |
| SMU.173 | putative ppGpp-regulated growth inhibitor, mazF |
1.695 | 0.027644 |
| Down-regulated genes | |||
| Energy metabolism | |||
| SMU.671 | citrate synthase, citZ | 0.291 | 0.0003693 |
| SMU.1011 | putative CitG protein, citG | 0.171 | 0.0003965 |
| Transport and binding | |||
| SMU.998 | ABC transporter, periplasmic ferrichrome-binding protein, yclQ/fatB |
0.592 | 0.0415653 |
| SMU.568 | amino acid ABC transporter, ATP- binding protein, glnQ |
0.538 | 0.0313816 |
| SMU.2116 | osmoprotectant amino acid ABC transporter, ATP-binding, opuCA |
0.414 | 0.0034014 |
| SMU.460 | putative amino acid ABC transporter, permease |
0.374 | 0.0025901 |
| SMU.461 | putative amino acid ABC transporter, ATP-binding protein |
0.261 | 0.0006624 |
| SMU.933 | putative amino acid ABC transporter, periplasmic amino acid, atmA |
0.147 | 1.21E-05 |
| SMU.935 | putative amino acid ABC transporter | 0.135 | 5.18E-05 |
| Amino acid biosynthesis | |||
| SMU.1836 | DAHP synthase phosphor-2-dehydro- 3-deoxyphosphoheptonate adolase, aroG |
0.655 | 0.0427644 |
| SMU.317 | putative tetrahydrodipicolinate succinylase, ykuQ/ dapD |
0.569 | 0.0315775 |
| SMU.335 | argininosuccinate lyase, argH | 0.563 | 0.0445401 |
| SMU.1383 | 3-isopropylmalate dehydrogenase, leuB |
0.530 | 0.0105533 |
| SMU.1382 | 3-isopropylmalate dehydratase, large subunit, leuC |
0.499 | 0.014424 |
| SMU.784 | 5-enolpyruvylshikimate-3-phosphate synthase, aroA |
0.460 | 0.0314230 |
| SMU.990 | dihydrodipicolinate synthase, dapA | 0.385 | 0.0429038 |
| SMU.1653 | D-3-phosphoglycerate dehydrogenase, serA |
0.324 | 0.0001565 |
| Regulatory function | |||
| SMU.1037 | Putative histidine kinase, phoR | 0.613 | 0.0425196 |
| SMU.1958 | fructose-specific enzyme IIC component, levF |
0.149 | 0.0001353 |
| Biosynthesis of proteins/ purine ribonucleotides/cofactors | |||
| SMU.2003 | 30S ribosomal protein S13, rs13/rpsM | 0.613 | 0.0482857 |
| SMU.2157 | inosine monophosphate dehydrogenase, guaB/impH |
0.454 | 0.0077039 |
| SMU.465 | NAD(+) synthetase (nitrogen regulatory protein), nadE |
0.386 | 0.0011386 |
| Central intermediary metabolism | |||
| SMU.376 | putative aminotransferase | 0.366 | 0.0406214 |
| SMU.636 | N-acetylglucosamine-6-phosphate isomerase, nagB |
0.203 | 0.0026116 |
| DNA metabolism | |||
| SMU.1002 | DNA topoisomerase I, topA | 0.556 | 0.0220572 |
| Cell division | |||
| SMU.2165 | chromosome segregation protein, ParB-like nuclease domain, smc |
0.581 | 0.0303665 |
| Protein fate/chaperone | |||
| SMU.1929 | protease HtpX, heat shock protein, htpX |
0.563 | 0.0345522 |
| SMU.91 | peptidyl-prolyl isomerase RopA (trigger factor), ropA |
0.560 | 0.0455648 |
| SMU.539 | signal peptidase type IV, hopD | 0.439 | 0.0159205 |
| Hypothetical proteins | |||
| SMU.1151 | conserved hypothetical protein | 0.626 | 0.0484003 |
| SMU.607 | conserved hypothetical protein | 0.608 | 0.0403010 |
| SMU.1404 | conserved hypothetical protein | 0.600 | 0.0351768 |
| SMU.252 | hypothetical protein | 0.580 | 0.0251873 |
| SMU.383 | conserved hypothetical protein | 0.543 | 0.0491039 |
| SMU.1853 | conserved hypothetical protein | 0.529 | 0.0357836 |
| SMU.163 | hypothetical protein | 0.522 | 0.0464475 |
| SMU.295 | hypothetical protein | 0.508 | 0.0096429 |
| SMU.673 | conserved hypothetical protein | 0.503 | 0.0269833 |
| SMU.1089 | conserved hypothetical protein | 0.501 | 0.0385478 |
| SMU.1884 | hypothetical protein | 0.472 | 0.0267431 |
| SMU.462 | conserved hypothetical protein | 0.442 | 0.0195586 |
| SMU.1284 | conserved hypothetical protein | 0.436 | 0.0146092 |
| SMU.1703 | conserved hypothetical protein | 0.435 | 0.0119016 |
| SMU.201 | conserved hypothetical protein | 0.432 | 0.0165989 |
| SMU.919 | hypothetical protein, putative ATPase, confers aluminum resistance |
0.421 | 0.0229347 |
| SMU.1480 | hypothetical protein | 0.409 | 0.0289793 |
| SMU.195 | hypothetical protein | 0.388 | 0.0072813 |
| SMU.1956 | hypothetical protein | 0.383 | 0.0094685 |
| SMU.862 | hypothetical protein | 0.354 | 0.0151455 |
| SMU.213 | hypothetical protein | 0.327 | 0.0032760 |
| SMU.1220 | conserved hypothetical protein | 0.282 | 0.0013358 |
| SMU.1723 | conserved hypothetical protein | 0.236 | 0.0002403 |
| SMU.684 | hypothetical protein | 0.190 | 0.0008547 |
| SMU.940 | putative hemolysin III, patB | 0.382 | 0.0107347 |
Proton-extrusion via the H+-translocating F-ATPase is common to all streptococci and is considered critical for acid tolerance because it allows the organism to maintain a cytoplasmic pH that is more alkaline than the extracellular environment (Lemos & Burne, 2008, Cotter & Hill, 2003). In S. mutans, transcriptional regulation of the atp operon correlates well with a significant increase in the enzyme activity during growth at acidic pH (Belli & Marquis, 1991, Gong et al., 2009). Although the S. sobrinus F-ATPase activity is constitutively high, the F-ATPase activity of S. sobrinus strains grown at pH 5 showed no significant increases as compared to cells grown at pH 7 (Nascimento et al., 2004). Here, we found that transcription of atpD, encoding the β-subunit of the F-ATPase enzyme was up-regulated by low pH (Table 1). Clearly, to fully appreciate the role of the F-ATPase in S. sobrinus acid tolerance, further studies are warranted.
The syntheses of intracellular polysaccharides (IPS), which are glycogen-like storage polymers, enhance survival during nutrient starvation and have been shown to contribute to caries formation (Busuioc et al., 2009, Spatafora et al., 1995). Previous work in S. mutans have identified and characterized the genes responsible for the accumulation of IPS, including glgD, encoding a subunit of glucose-1-phosphate pyrophosphorylase (Busuioc et al., 2009, Spatafora et al., 1995). Here, we found that expression of the S. sobrinus glgD homologue was induced by 2.4-fold during growth at low pH (Table 1). The importance of the IPS to S. mutans virulence has been largely associated with its use as a source of carbohydrate upon nutrient depletion that, as a result, increases survival and extends acid production by the organism. In S. mutans, the expression of the glg genes is induced by exogenous glucose (Spatafora et al., 1995), but there has been no evidence that this is also the case for low pH. We assessed the ability of batch-grown S. sobrinus 6715 and S. mutans UA159 cultures to drop the extracellular pH using endogenous sugar and found that the resting pH for S. sobrinus 6715 was at least 0.5 units below the resting pH of S. mutans UA159 (data not shown), suggesting that S. sobrinus 6715 is more acidogenic than S. mutans UA159. Interestingly, previous reports have also shown that S. sobrinus strains are able to produce acids more rapidly than S. mutans, and that fresh isolates of S. sobrinus are more cariogenic in rats than fresh isolates of S. mutans (de Soet et al., 1991, de Soet et al., 1989).
A number of other genes that have been associated with stress tolerance in S. mutans and other related organisms were up-regulated in our microarrays, including genes encoding for the stringent response effector RelA, the MazF toxin of the MazEF toxin-antitoxin system, DNA repair enzymes (SmxA, NrdE, EndIII), and glutathione reductase (Gor), an important antioxidant enzyme involved in oxidative stress and detoxification (Table 1). The up-regulation of these pathways is not surprising since bacteria are known to depend on multiple and often overlapping pathways for dealing with different stresses. In particular, the association between acid stress responses and DNA repair systems has been reported in S. mutans and related lactic acid bacteria (Lemos & Burne, 2008, Cotter & Hill, 2003)
In general terms, the interspecies microarray analysis allowed for the rapid identification of several, previously unrecognized genes that participate in the acid stress responses of S. sobrinus. However, it is important to consider the limitations inherent to this technology. A clear limitation is that this approach can only identify genes whose sequences are nearly identical to the fully sequenced relative and it fails to identify genes that are not highly conserved or genes that are unique in the species of interest. Thus, the list presented here is likely to represent only a subset of the genes that participate in acid tolerance, and by no means should be viewed as a complete snapshot of the S. sobrinus acid stress genes. To further advance the field, the acquisition of a reference genome sequence for S. sobrinus is clearly of high priority. This would allow the development of species-specific gene arrays, but more importantly, it would provide a framework for genomic comparisons with S. mutans and other related streptococci.
Proteomic analysis revealed that many glycolytic enzymes are upregulated at low pH
In addition to the interspecies microarray hybridizations, we used a proteomic approach to identify protein spots with higher intensity at pH 5 (cutoff ≥ 1.5-fold change). A 2D gel approach was used to obtain the protein profile of pH 7 and pH 5 steady-state cultures of S. sobrinus 6715 (Fig. 1). Because a protein database of S. sobrinus is not available, protein identification was obtained by using Q-TOF MS/MS that allowed for the amino acid sequence assignment from the interpretation of the MS/MS spectra. Mass spectra were searched against bacterial protein databases using MASCOT with 11 out of 18 protein spots confidently identified (Table 2). Among the proteins identified, there were two cases of proteins with two isoforms (Dpr and GapC). Six of the identified proteins (Ldh, FbaA, PfkA, PykA, Pgk, and GapC) are involved in glycolysis/ gluconeogenesis. These same proteins were also found to be up-regulated in a proteomic study of acid adapted cells in S. mutans (Len et al., 2004), suggesting that enhanced glycolytic activity during low pH conditions may be a common trait in mutans streptococci. To further support these results, the genes encoding lactate dehydrogenase (ldh), fructose-1, 6-biphosphate aldolase (fbaA), and 6-phosphofructokinase (pfkA) were also up-regulated at pH 5 in our S. sobrinus- S. mutans interspecies microarrays (Table 1). This observation, along with the previous finding that the glucose-PTS was up-regulated at low pH (Nascimento et al., 2004), suggests that glucose transport and glycolysis are enhanced in cells grown at low pH. We speculate that this increase in glycolysis generates higher rates of ATP production that activates ATP-dependent pathways used to enhance the ability of the cells to maintain ΔpH across the membrane. However, it should be noted that cell density was lower at pH (OD600 ≈ 1.1) than at pH 7 (OD600 ≈ 1.4). Thus, it is possible that at pH 5 genes encoding glycolytic enzymes could be induced due to an increase in glucose availability, or to cell-density dependent signaling.
Fig. 1.
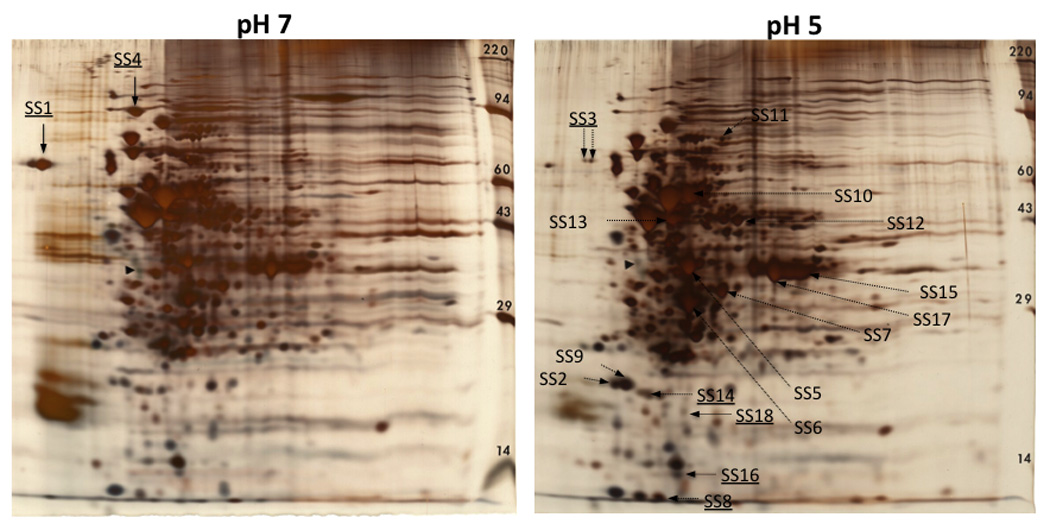
2D protein patterns of S. sobrinus 6715 grown to pH 7 and pH 5 steady-state levels. The silver-stained proteins with enhanced expression at pH 5 (fold-change ≥ 1.5) that were identified by Q-TOF MS/MS are indicated in the pH 5 gel image, and proteins that were enhanced at pH 7 (fold change ≥ 1.5) are indicated in the pH 7 gel image. Underlined spot ID labels indicate proteins that were subjected to Q-TOF MS/MS analysis but the results failed to meet the criteria for confident identification. Refer to Table 2 for name and description of identified proteins. The filled triangle indicates tropomyosin (33 kDa, pI 5.2) loaded as an internal control.
Table 2.
List of acid-stress proteins of S. sobrinus 6715 identified by Q-TOF MS/MS.
| Spot ID | Protein | Description | Pathway |
|---|---|---|---|
| SS2 & 9 | Dpr | peroxide resistance/iron binding | Oxidative stress |
| SS5 | Ldh | L(+)-lactate dehydrogenase | Glycolysis/ gluconeogenesis |
| SS6 | FbaA | fructose-1,6-biphosphate adolase |
Glycolysis |
| SS7 | PfkA | 6-phosphofructokinase | Glycolysis/ gluconeogenesis |
| SS10 | PykA | pyruvate kinase | Glycolysis/ gluconeogenesis |
| SS11 | NrdE | ribonucleotide reductase alpha- subunit |
DNA replication/ repair |
| SS12 | GdhA | NADP-specific glutamate dehydrogenase |
Glutamate metabolism |
| SS13 | Pgk | phosphoglycerate kinase | Glycolysis/ gluconeogenesis |
| SS15 &17 | GapC | Glycerehyde-3-phosphate dehydrogenase |
Glycolysis/ gluconeogenesis |
In addition to proteins associated with energy metabolism, GdhA, a glutamate dehydrogenase involved in the biosynthesis of glutamate (Cvitkovitch et al., 1997), NrdE, associated with DNA replication and repair (Jordan et al., 1996) and Dpr, an iron-binding protein involved in oxygen tolerance (Yamamoto et al., 2000), were also identified as up-regulated at pH 5. Glutamate serves as a precursor for the synthesis of other amino acids and proteins and has been found to be a required nutrient in both S. mutans and S. sobrinus (Terleckyj & Shockman, 1975). Moreover, glutamate has been shown to play a role in the ATR of E. coli and Lactococcus lactis (Castanie-Cornet et al., 1999, Sanders et al., 1998). The NrdE protein corresponds to the α-subunit of the ribonucleotide reductase enzyme that catalyzes the reduction of ribonucleotide di- or triphosphates providing the molecules necessary for DNA replication and repair (Jordan et al., 1996). Of note, the gene encoding NrdE was also upregulated in our microarray analysis (Table 1). Finally, Dpr is an antioxidant iron-binding protein involved in peroxide resistance by preventing the Fenton reaction through sequestration of intracellular free iron ions (Yamamoto et al., 2000). Notably, transcription of dpr was induced by low pH in S. mutans (Gong et al., 2009), and a Δdpr strain of Streptococcus pyogenes showed reduced survival rate at low pH when compared to parent strain (Tsou et al., 2008) suggesting that Dpr might be a general stress protein.
The 2D gel approach only reveals a “narrow-slice” of the cell’s total proteome. It is important to recognize the limitations inherent to the 2D gel approach, with limited sample capacity and detection sensitivity that reduces the ability to detect proteins with medium or low abundance, and with membrane proteins being frequently underrepresented because of poor solubility. Regardless of these limitations, the proteomic data showed good correlation with the transcriptomic data with four of the nine identified proteins also identified in the microarray analysis (Ldh, FbaA, PfkA and NrdE), and with a trend suggesting upregulation of metabolic enzymes by low pH observed with both technologies.
MLF activity is enhanced at low pH
It has been previously demonstrated that the catabolism of L-malate serves to protect S. mutans against acid killing in vitro (Sheng & Marquis, 2007). It was interesting to note that transcription of the gene encoding the malolactic enzyme (mleS) displayed the greatest change in the microarrays (17.8-fold induction). On the other hand, a recent global transcriptomic analysis of acid-inducible genes did not indicate upregulation of the mle genes by environmental pH in S. mutans (Gong et al., 2009). Therefore, we hypothesized that MLF could play a larger role in the acid tolerance of S. sobrinus. To test this hypothesis, we assessed MLF activity in S. sobrinus 6715 and S. mutans UA159. Because MLF activity is not detected in the absence of malate, we used batch cultures containing L-malate buffered at pH 7 and pH 5.5. . When the terminal pH of the pH 7 potassium phosphate buffered and pH 5.5 cultures were measured, the pH was approximately 6 and 4.5, respectively for both S. mutans and S. sobrinus. When compared to pH 7 grown cells, MLF activity was significantly higher (approximately 2.5-fold induction) in pH 5.5 grown cells in both organisms (Fig. 2) but there was no significant difference between S. mutans and S. sobrinus MLF activity under the tested conditions. This result indicates that increased MLF activity may be part of a common acid resistance mechanism shared by S. mutans and S. sobrinus.
Fig. 2.
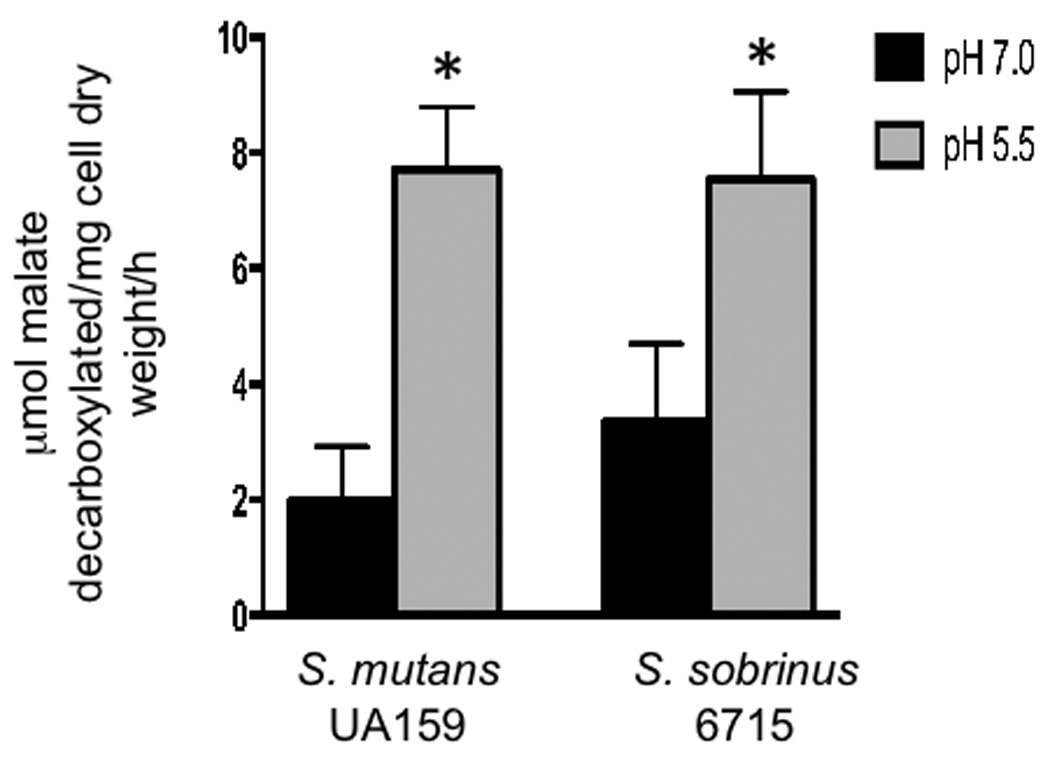
Malolactic fermentation activity of S. sobrinus 6715 and S. mutans UA159 at pH 5.5 and pH 7. S. sobrinus and S. mutans cells were grown in TY broth (adjusted with HCl, pH 5.5 or buffered with potassium phosphate, pH 7), supplemented with 25mM glucose and 25mM L-malate until stationary phase. Cells were harvested, washed with salt solution, and resuspended with 50 mM L-malate. The results represent the means ± the standard deviation of three independent experiments. (*) P ≤ 0.05.
Concluding remarks
In this report, transcriptomic and proteomic approaches have been used to identify novel, previously unrecognized acid tolerance genes and pathways in S. sobrinus. Our results indicated that to survive the acid challenge, among other things, S. sobrinus relies on the up-regulation of key metabolic activities (PDH and glycolysis) and increased MLF activity. Notably, some of these acid tolerance properties are shared by S. mutans, and might be considered ideal targets for the development of new anti-caries strategies. Clearly, the continued investigation of the mechanisms that allow S. sobrinus to thrive in dental plaque is central to developing a better understanding of the pathogenesis of dental caries. Unfortunately, progress in this field has been hampered by the lack of a reference genome sequence and by the extremely refractory nature of S. sobrinus to genetic manipulations. Work is underway to identify and develop new strategies to enhance transformability of S. sobrinus.
ACKNOWLEDGEMENTS
The authors would like to thank R. A. Burne and R. G. Quivey for their support and helpful discussions. This study was supported by NIH-NIDCR award DE017101 to J. A. L., and by NIDCR Training Program in Oral Sciences T32 DE007202 to J. A. and J. K. K.
REFERENCES
- Abranches J, Candella MM, Wen ZT, Baker HV, Burne RA. Different roles of EIIABMan and EIIGlc in regulation of energy metabolism, biofilm development, and competence in Streptococcus mutans. J Bacteriol. 2006;188:3748–3756. doi: 10.1128/JB.00169-06. [DOI] [PMC free article] [PubMed] [Google Scholar]
- Ajdic D, McShan WM, McLaughlin RE, Savic G, Chang J, Carson MB, Primeaux C, Tian R, Kenton S, Jia H, Lin S, Qian Y, Li S, Zhu H, Najar F, Lai H, White J, Roe BA, Ferretti JJ. Genome sequence of Streptococcus mutans UA159, a cariogenic dental pathogen. Proc Nat Acad Sci USA. 2002;99:14434–14439. doi: 10.1073/pnas.172501299. [DOI] [PMC free article] [PubMed] [Google Scholar]
- Beighton D. The complex oral microflora of high-risk individuals and groups and its role in the caries process. Comm Dent Oral Epidemiol. 2005;33:248–255. doi: 10.1111/j.1600-0528.2005.00232.x. [DOI] [PubMed] [Google Scholar]
- Belli WA, Marquis RE. Adaptation of Streptococcus mutans and Enterococcus hirae to acid stress in continuous culture. Appl Env Microbiol. 1991;57:1134–1138. doi: 10.1128/aem.57.4.1134-1138.1991. [DOI] [PMC free article] [PubMed] [Google Scholar]
- Burne RA, Schilling K, Bowen WH, Yasbin RE. Expression, purification, and characterization of an exo-beta-D-fructosidase of Streptococcus mutans. J Bacteriol. 1987;169:4507–4517. doi: 10.1128/jb.169.10.4507-4517.1987. [DOI] [PMC free article] [PubMed] [Google Scholar]
- Busuioc M, Mackiewicz K, Buttaro BA, Piggot PJ. Role of intracellular polysaccharide in persistence of Streptococcus mutans. J Bacteriol. 2009;191:7315–7322. doi: 10.1128/JB.00425-09. [DOI] [PMC free article] [PubMed] [Google Scholar]
- Carlsson J, Kujala U, Edlund MB. Pyruvate dehydrogenase activity in Streptococcus mutans. Infect Immun. 1985;49:674–678. doi: 10.1128/iai.49.3.674-678.1985. [DOI] [PMC free article] [PubMed] [Google Scholar]
- Carlsson P, Gandour IA, Olsson B, Rickardsson B, Abbas K. High prevalence of mutans streptococci in a population with extremely low prevalence of dental caries. Oral Microbiol Immunol. 1987;2:121–124. doi: 10.1111/j.1399-302x.1987.tb00274.x. [DOI] [PubMed] [Google Scholar]
- Castanie-Cornet MP, Penfound TA, Smith D, Elliott JF, Foster JW. Control of acid resistance in Escherichia coli. J Bacteriol. 1999;181:3525–3535. doi: 10.1128/jb.181.11.3525-3535.1999. [DOI] [PMC free article] [PubMed] [Google Scholar]
- Cotter PD, Hill C. Surviving the acid test: responses of gram-positive bacteria to low pH. Microbiol Mol Biol Rev. 2003;67:429–453. doi: 10.1128/MMBR.67.3.429-453.2003. [DOI] [PMC free article] [PubMed] [Google Scholar]
- Cvitkovitch DG, Gutierrez JA, Bleiweis AS. Role of the citrate pathway in glutamate biosynthesis by Streptococcus mutans. J Bacteriol. 1997;179:650–655. doi: 10.1128/jb.179.3.650-655.1997. [DOI] [PMC free article] [PubMed] [Google Scholar]
- de Soet JJ, Toors FA, de Graaff J. Acidogenesis by oral streptococci at different pH values. Caries Res. 1989;23:14–17. doi: 10.1159/000261148. [DOI] [PubMed] [Google Scholar]
- de Soet JJ, van Loveren C, Lammens AJ, Pavicic MJ, Homburg CH, ten Cate JM, de Graaff J. Differences in cariogenicity between fresh isolates of Streptococcus sobrinus and Streptococcus mutans. Caries Res. 1991;25:116–122. doi: 10.1159/000261353. [DOI] [PubMed] [Google Scholar]
- Fozo EM, Kajfasz JK, Quivey RG., Jr Low pH-induced membrane fatty acid alterations in oral bacteria. FEMS microbiology letters. 2004;238:291–295. doi: 10.1016/j.femsle.2004.07.047. [DOI] [PubMed] [Google Scholar]
- Fozo EM, Quivey RG., Jr Shifts in the membrane fatty acid profile of Streptococcus mutans enhance survival in acidic environments. Appl Environ Microbiol. 2004;70:929–936. doi: 10.1128/AEM.70.2.929-936.2004. [DOI] [PMC free article] [PubMed] [Google Scholar]
- Gong Y, Tian XL, Sutherland T, Sisson G, Mai J, Ling J, Li YH. Global transcriptional analysis of acid-inducible genes in Streptococcus mutans: multiple two-component systems involved in acid adaptation. Microbiology. 2009;155:3322–3332. doi: 10.1099/mic.0.031591-0. [DOI] [PubMed] [Google Scholar]
- Griswold AR, Jameson-Lee M, Burne RA. Regulation and physiologic significance of the agmatine deiminase system of Streptococcus mutans UA159. J Bacteriol. 2004;188:834–841. doi: 10.1128/JB.188.3.834-841.2006. [DOI] [PMC free article] [PubMed] [Google Scholar]
- Hamilton IR, Buckley ND. Adaptation by Streptococcus mutans to acid tolerance. Oral Microbiol Immunol. 1991;6:65–71. doi: 10.1111/j.1399-302x.1991.tb00453.x. [DOI] [PubMed] [Google Scholar]
- Hamilton IR, Ellwood DC. Effects of fluoride on carbohydrate metabolism by washed cells of Streptococcus mutans grown at various pH values in a chemostat. Infect Immun. 1978;19:434–442. doi: 10.1128/iai.19.2.434-442.1978. [DOI] [PMC free article] [PubMed] [Google Scholar]
- Jordan A, Pontis E, Aslund F, Hellman U, Gibert I, Reichard P. The ribonucleotide reductase system of Lactococcus lactis. Characterization of an NrdEF enzyme and a new electron transport protein. J Biol Chem. 1996;271:8779–8785. doi: 10.1074/jbc.271.15.8779. [DOI] [PubMed] [Google Scholar]
- Korithoski B, Levesque CM, Cvitkovitch DG. The involvement of the pyruvate dehydrogenase E1 alpha subunit, in Streptococcus mutans acid tolerance. FEMS Microbiol Lett. 2008;289:13–19. doi: 10.1111/j.1574-6968.2008.01351.x. [DOI] [PubMed] [Google Scholar]
- Lemos JA, Burne RA. A model of efficiency: stress tolerance by Streptococcus mutans. Microbiology. 2008;154:3247–3255. doi: 10.1099/mic.0.2008/023770-0. [DOI] [PMC free article] [PubMed] [Google Scholar]
- Len AC, Harty DW, Jacques NA. Proteome analysis of Streptococcus mutans metabolic phenotype during acid tolerance. Microbiology. 2004;150:1353–1366. doi: 10.1099/mic.0.26888-0. [DOI] [PubMed] [Google Scholar]
- Liljemark WF, Bloomquist C. Human oral microbial ecology and dental caries and periodontal diseases. Crit Rev Oral Biol Med. 1996;7:180–198. doi: 10.1177/10454411960070020601. [DOI] [PubMed] [Google Scholar]
- Lindquist B, Emilson CG. Dental location of Streptococcus mutans and Streptococcus sobrinus in humans harboring both species. Caries Res. 1991;25:146–152. doi: 10.1159/000261358. [DOI] [PubMed] [Google Scholar]
- Liu ZL, Slininger PJ. Universal external RNA controls for microbial gene expression analysis using microarray and qRT-PCR. J Microbiol Methods. 2007;68:486–496. doi: 10.1016/j.mimet.2006.10.014. [DOI] [PubMed] [Google Scholar]
- Loesche WJ. Role of Streptococcus mutans in human dental decay. Microbiol Rev. 1986;50:353–380. doi: 10.1128/mr.50.4.353-380.1986. [DOI] [PMC free article] [PubMed] [Google Scholar]
- Morris TW, Reed KE, Cronan JE., Jr Identification of the gene encoding lipoate-protein ligase A of Escherichia coli. Molecular cloning and characterization of the lplA gene and gene product. J Biol Chem. 1994;269:16091–16100. [PubMed] [Google Scholar]
- Nascimento MM, Lemos JA, Abranches J, Goncalves RB, Burne RA. Adaptive acid tolerance response of Streptococcus sobrinus. J Bacteriol. 2004;186:6383–6390. doi: 10.1128/JB.186.19.6383-6390.2004. [DOI] [PMC free article] [PubMed] [Google Scholar]
- O'Connell KL, Stults JT. Identification of mouse liver proteins on two-dimensional electrophoresis gels by matrix-assisted laser desorption/ionization mass spectrometry of in situ enzymatic digests. Electrophoresis. 1997;18:349–359. doi: 10.1002/elps.1150180309. [DOI] [PubMed] [Google Scholar]
- Okada M, Soda Y, Hayashi F, Doi T, Suzuki J, Miura K, Kozai K. Longitudinal study of dental caries incidence associated with Streptococcus mutans and Streptococcus sobrinus in pre-school children. J Med Microbiol. 2005;54:661–665. doi: 10.1099/jmm.0.46069-0. [DOI] [PubMed] [Google Scholar]
- Quivey RG, Jr, Faustoferri R, Monahan K, Marquis R. Shifts in membrane fatty acid profiles associated with acid adaptation of Streptococcus mutans. FEMS Microbiol Lett. 2000;189:89–92. doi: 10.1111/j.1574-6968.2000.tb09211.x. [DOI] [PubMed] [Google Scholar]
- Sanders JW, Leenhouts K, Burghoorn J, Brands JR, Venema G, Kok J. A chloride-inducible acid resistance mechanism in Lactococcus lactis and its regulation. Mol Microbiol. 1998;27:299–310. doi: 10.1046/j.1365-2958.1998.00676.x. [DOI] [PubMed] [Google Scholar]
- Sheng J, Marquis RE. Malolactic fermentation by Streptococcus mutans. FEMS Microbiol Lett. 2007;272:196–201. doi: 10.1111/j.1574-6968.2007.00744.x. [DOI] [PubMed] [Google Scholar]
- Spatafora G, Rohrer K, Barnard D, Michalek S. A Streptococcus mutans mutant that synthesizes elevated levels of intracellular polysaccharide is hypercariogenic in vivo. Infect Immun. 1995;63:2556–2563. doi: 10.1128/iai.63.7.2556-2563.1995. [DOI] [PMC free article] [PubMed] [Google Scholar]
- Terleckyj B, Shockman GD. Amino acid requirements of Streptococcus mutans and other oral streptococci. Infect Immun. 1975;11:656–664. doi: 10.1128/iai.11.4.656-664.1975. [DOI] [PMC free article] [PubMed] [Google Scholar]
- Tsou CC, Chiang-Ni C, Lin YS, Chuang WJ, Lin MT, Liu CC, Wu JJ. An iron-binding protein, Dpr, decreases hydrogen peroxide stress and protects Streptococcus pyogenes against multiple stresses. Infect Immun. 2008;76:4038–4045. doi: 10.1128/IAI.00477-08. [DOI] [PMC free article] [PubMed] [Google Scholar]
- Vadeboncoeur C, Thibault L, Neron S, Halvorson H, Hamilton IR. Effect of growth conditions on levels of components of the phosphoenolpyruvate:sugar phosphotransferase system in Streptococcus mutans and Streptococcus sobrinus grown in continuous culture. J Bacteriol. 1987;169:5686–5691. doi: 10.1128/jb.169.12.5686-5691.1987. [DOI] [PMC free article] [PubMed] [Google Scholar]
- Welin J, Wilkins JC, Beighton D, Wrzesinski K, Fey SJ, Mose-Larsen P, Hamilton IR, Svensater G. Effect of acid shock on protein expression by biofilm cells of Streptococcus mutans. FEMS Microbiol Lett. 2003;227:287–293. doi: 10.1016/S0378-1097(03)00693-1. [DOI] [PubMed] [Google Scholar]
- Yamamoto Y, Higuchi M, Poole LB, Kamio Y. Role of the dpr product in oxygen tolerance in Streptococcus mutans. J Bacteriol. 2000;182:3740–3747. doi: 10.1128/jb.182.13.3740-3747.2000. [DOI] [PMC free article] [PubMed] [Google Scholar]